


Ultra-processed foods (UPF) are formulations of ingredients used mainly for industrial purposes and created by industrial techniques. UPF are characterised by their high-energy density; low protein, micronutrients and fibre content and high Na, saturated fat and sugar content(Reference Monteiro, Cannon and Moubarac1,2) . This composition is extremely palatable and addictive to humans, which can lead to greater energy consumption and relatively lower protein and micronutrient intake(2). Furthermore, given that these foods are widely available and require little to no culinary preparation, they are convenient and increasingly pervasive in the diets of many populations(Reference Monteiro, Cannon and Moubarac1).
In developed countries, studies of household samples indicate that UPF account for 57·5 %, 56·8 % and 48 % of energies in the typical diets of individuals in the USA, UK and Canada, respectively(Reference Steele, Popkin and Swinburn3–Reference Moubarac, Batal and Louzada5). In Latin America, 24 % of the energies in the diet came from UPF in Chile(Reference Crovetto, Uauy and Martins6), whereas this value was 21·5 % in Brazil(Reference Louzada, Martins and Canella7). In all studies, the added energies in UPF were negatively correlated to some vitamin and mineral content and positively correlated to the Na and fat content of the diet in question. Moreover, excessive consumption of UPF is associated with obesity(Reference Mendonça, Pimenta and Gea8,Reference Monteiro, Moubarac and Levy9) , arterial hypertension(Reference Mendonça, Lopes and Pimenta10), metabolic syndrome(Reference Steele, Juul and Neri11), cancer(Reference Fiolet, Srour and Sellem12), heart and cerebrovascular diseases(Reference Srour, Fezeu and Kesse-Guyot13), depression(Reference Gómez-Donoso, Sanchez-Villegas and Martinez-Gonzalez14,Reference Adjibade, Julia and Alles15) and increased risk of morbidity(Reference Sandoval-Insausti, Blanco-Rojo and Graciani16) and mortality(Reference Kim, Hu and Rebholz17–Reference Rico-Campà, Martínez-González and Alvarez-Alvarez19). These findings highlight the need to intervene on the excessive consumption of UPF and to encourage the consumption of minimally processed foods aimed at promoting health and preventing and controlling chronic non-communicable diseases (NCD).
In light of these facts, Brazil published its Dietary Guidelines for the Brazilian Population in 2014, which has as its golden rule the following guideline: ‘Always prefer fresh or minimally processed foods and culinary preparations to ultra-processed foods’. These guidelines are incorporated into national nutrition policy(20,21) , and it is used as a reference for building policies on food and nutrition, for directing food and nutrition educational activities and guiding the production of materials to the practice of professionals that work in health promotion services of Brazil’s Unified Health System (SUS)(22–24), which is coordinated by the Primary Health Care (PHC).
The PHC’s health professionals develop recommendations of health promotion, disease prevention and rehabilitation based on the principles of universality and equity(25). An important initiative at PHC was the creation of the Health Academy Program (Programa Academia da Saúde (PAS)) in 2011, whose objective is to advance general health promotion and prevent NCD. This programme offers free health promotion activities to vulnerable populations with limited access to health promotion services or facilities(26). Among the activities carried out are those related to food and nutrition, which address various topics defined according to local demand and Brazilian Dietary guidelines. Currently, PAS has reached 2900 Brazilian municipalities spanning all units of the Federal District(27).
Despite these and other efforts, the rate of NCD continues to grow. Studies investigating UPF consumption remain scarce, since the classification of food by its degree of industrial processing (NOVA) was only recently introduced. It is unknown whether regular users of public health promotion services have a different nutritional profile with respect to UPF consumption relative to the general population, and, further, what the relationship might be between the consumption of these foods and overall nutritional profile. Thus, this study aimed to describe the consumption of UPF and analyse its association with the nutritional profile of health promotion service users of PHC in a Brazilian city.
Methods
Data source and sampling
This cross-sectional study of baseline data from a controlled and randomised community trial aimed to assess the impact of intervention to encourage the consumption of fruits and vegetables in users of PAS in the city of Belo Horizonte in Minas Gerais, Brazil(Reference Menezes, Costa and Ferreira28). This city has an estimated population of 2 512 070 inhabitants distributed across nine administrative regions, making it the sixth largest city in the country(29).
Sampling of the PAS units was stratified by the nine administrative regions of the municipality(Reference Menezes, Costa and Ferreira28). At the time of the sampling process (2012), 50 PAS units were in operation in these nine administrative regions, including those with morning operation, which were located in an area of medium and high to very high vulnerability to health problems, due to greater availability of PAS in this municipality. The areas were classified by the Health Vulnerability Index, which is composed of socio-economic and environmental variables and classifies the risk of vulnerability as low risk, medium risk, high risk or very high risk(30), and including the units that had not participated in a nutritional intervention study in the past 2 years. Of the forty-two eligible units, two were drawn by municipal region, resulting in 18 (42·8 %) total units, two in each administrative region of the municipality. This sample was representative of services in the municipality with medium and high or very high Health Vulnerability Index, with a 95 % CI and an error rate of 1·4 %(Reference Menezes, Costa and Ferreira28).
In the sampled units, all individuals aged ≥20 years who participated in at least one activity in the most recent month were interviewed. The exclusion criteria were being pregnant and having a cognitive impairment that precluded completion of the questionnaire. Of the 3763 eligible individuals, 112 (3 %) failed to meet the inclusion criteria and were excluded and 237 (6·3 %) declined to complete the questionnaire. The baseline sample comprised 3414 participants(Reference Menezes, Costa and Ferreira28). Additional details about the study’s sampling process are described in a previous publication(Reference Menezes, Costa and Ferreira28).
As recommended by Willet(Reference Willett31), our study’s analyses excluded individuals who reported, according to the 24-h dietary recall (R24 h) interview, those who reported a very low (<500 kcal/d) or a very high (> 7000 kcal/d) total daily energy consumption (n 37) and those who returned incomplete questionnaires (n 5). Therefore, the final sample comprised 3372 individuals, accounting for a participation rate of 98·8 % relative to the baseline of the community trial.
Data collection
Data were collected between February 2013 and June 2014 via in-person interviews conducted by trained interviewers who were supervised by nutritionists(Reference Menezes, Costa and Ferreira28). Training for data collection occurred every 6 months, and a field manual was drafted for consultation(Reference Menezes, Costa and Ferreira28).
Dietary intake
The R24 h was used because it is indicated for individuals who have a low level of education and for epidemiological studies with large samples(Reference Fisberg, Martini, Slater and Fisberg32,Reference Fisberg, Marchioni and Colucci33) . To minimise biases, the interviewees were not informed about their R24 h completion date.
The R24 h was administered on two non-consecutive days (one corresponding to a weekend day), and the data were tabulated and processed in the Brazil Nutri software program. The self-reported measurements of food preparations were transformed into grams or millilitres using food consumption assessment tables and manuals(Reference Pinheiro, Lacerda and Benzecry34–Reference Fisberg and Marchioni36) and industrialised food labels and measurements (standardising/weighing). The standardised tabulation and processing of food consumption data were performed by trained and supervised nutritionists.
For the inclusion of food in the Brazil Nutri program’s database, the content of sugar added in beverages was considered in cases where the individual reported adding only sugar (10 % of the volume) or adding both sugar and artificial sweeteners (5 % of the volume) (7·35). The inclusion of salt and oil to the culinary preparations was considered, as well as the amount of table salt added to the food. Data from individuals who completed at least one R24 h form (n 196; 5·6 %) were analysed. For the other participants who answered both R24 h forms, the data were averaged.
Classification of foods according to processing
Foods were assigned to one of three groups according to the NOVA food classification system: (1) unprocessed (fresh) or minimally processed foods, including culinary preparations based on one or more natural or minimally processed foods, and processed culinary ingredients; (2) processed foods and (3) UPF. UPF are industrial formulations composed mostly or entirely of substances extracted from food, derived from food constituents, or synthesised in the laboratory based on organic materials (e.g. dyes, flavourings and flavour enhancers)(2).
Consumption of UPF and nutritional dietary profile
The total energetic consumption of UPF was expressed as a percentage of the total energetic value of the diet according to self-reported data from R24 h. To assess the nutritional profile, quintiles of the percentage-based contribution of energy from UPF consumption were assessed, with the first quintile referring to the lowest consumption of UPF and the last to the highest consumption.
The macronutrients investigated were carbohydrates, proteins, total fats and fat subtypes: saturated, monounsaturated, polyunsaturated, trans, linolenic (n-3) and linoleic (n-6) fatty acids. They were evaluated according to their percentage-based energetic contribution to the total energetic value of the diet.
The micronutrients investigated were vitamins A, B3, B6, B12, folate and C and the minerals Ca, Fe, P, Mg, K and Na. To present these micronutrients and fibre, the measure of nutrient density was used; that is, the amount of nutrient or fibre consumed per every 1000 kcal (g, mg, or µg/1000 kcal). The energy density of the diet (kcal/g) was calculated by dividing the sum of the energies from the intake of solid foods by their quantity in grams. The recommendations used for this indicator were based on those proposed by the World Cancer Research Foundation(37).
Study variables
The socio-demographic variables investigated were age (adult: 20–59 years; elderly: ≥60 years), sex (female or male), marital status (married or stable union; separated or divorced; single or widowed), education (<8 and >8 years of study) and per capita income (categorised in tertiles). To calculate per capita income, the sum of the income of all family members was divided by the number of residents.
The main independent variable was the percentage-based contribution of energy from UPF to the total energetic value of the diet. The dependent variables were total energies (kcal); energy density (kcal/g); energetic distribution (%) of macronutrients and density of fibre, vitamins and minerals (µg, mg or g/1000 kcal).
To estimate the prevalence of non-recommended intake levels of nutrients (total fat, saturated fat, trans-fat, fibre, K and Na), the recommended levels for the prevention of NCD were adopted(38–40). They were considered inadequate if their consumption patterns were characterised by ≥30 % of total energy intake for total fat; ≥10 % of total energy intake for saturated fats; ≥1 % of total energy intake for trans fats; ≤12·5 g/1000 kcal for dietary fibre; ≥1000 mg/1000 kcal for Na and ≤1755 mg/1000 kcal for K. The Estimated Average Requirement was used to estimate the prevalence of vitamin and mineral deficiency, as recommended by the Dietary Reference Intakes(41–44).
Statistical analysis
The contribution of energy from UPF to the diet and its distribution in quintiles were presented according to socio-demographic variables (gender, age, marital status, education and per capita income in tertiles). The consumption of the macro- and micronutrients were presented according to the quintiles of percentage contribution of energy from UPF in the diet and stratified by sex.
Histograms were generated to assess the normality of the variables. The variables that presented a distorted distribution (vitamin A, B12, C, trans fats and n-3) underwent a logarithmic transformation before statistical analysis; however, the original values are presented in the corresponding Tables. Then, parametric tests were chosen for all variables based on their greater statistical power and result accuracy. To assess the direction of the correlations, ANOVA and Scheffé’s post hoc tests were used. Trend tests were also performed for socio-demographic and food consumption variables according to quintiles of energy contribution from UPF.
For the analysis of the diet’s nutritional profile (macro- and micronutrients), linear regression models were applied to each dependent variable. Unadjusted and adjusted models for age, marital status, education and sex were performed, and standardised regression coefficients (sd) were calculated.
The prevalence of inadequate nutrient intake was presented according to the quintiles of the percentage-based contribution of energy from UPF in the diet, which was stratified by sex. Trend tests were performed for food consumption inadequacy according to quintiles of energy contribution from UPF, and the difference in the prevalence of inadequacy between the first and last quintiles was assessed using the χ 2 test with Bonferroni correction (P < 0·005). To measure the relationship between the prevalence of inadequate nutrient intake and the quintiles of the contribution of energy from UPF in the diet, the prevalence ratio was calculated using Poisson regression. The models were adjusted for sex, age, marital status and education. All analyses were performed with Data Analysis and Statistical Software (STATA) v. 14.0, with a significance level of 5 % (P < 0·05).
Results
Among the 3372 individuals who participated in the study. About 88·1 % were female and 43·6 % were elderly. Participants reported an average daily energy consumption of 1435·4 kcal/d (± 559 kcal), with 27·7 % coming from UPF. The percentage of UPF consumption was higher among women (28·2 % v. 23·9 % in men), adults (29·3 % v. 25·6 % in the elderly) and those with a higher level of education (29·7 % v. 25·6 % with a lower level of education) and income (28·9 % v. 27·2 % in second tertile v. 27·1 % in first tertile) (Table 1).
Table 1 Average and distribution in quintiles of the percentage of energy from the consumption of ultra-processed foods (UPF) in the total energy of the diet, according to the socio-demographic characteristics of those attending a Brazilian health promotion service. Belo Horizonte, Minas Gerais, Brazil (2013–2014)

* Percentage of total energy consumption originated from UPF: average (amplitude): Q1 = 8·4 % (0 to 14·4); Q2 = 18·5 % (14·4 to 22·6); Q3 = 26·4 % (22·6 to 30·4); Q4 = 34·9 % (30·4 to 40·6); Q5 = 50·2 % (40·6 to 85·7).
† P value <0·05 for linear trend test.
‡ They presented a significant difference with percentage of UPF consumption.
Individuals of either sex in the quintile of highest consumption of UPF had diets with a higher energy density, greater consumption of energy, total, saturated, monounsaturated and trans-fats and lower protein intake relative to individuals in the first quintile. Furthermore, a smaller proportion of n-3 fatty acids was observed in women in the highest quintile of consumption (Table 2).
Table 2 Averages of energy consumption and macronutrients according to the quintiles of percentage of energy derived from the consumption of ultra-processed foods (UPF) from regulars in a Brazilian health promotion service. Belo Horizonte, Minas Gerais, Brazil (2013–2014)
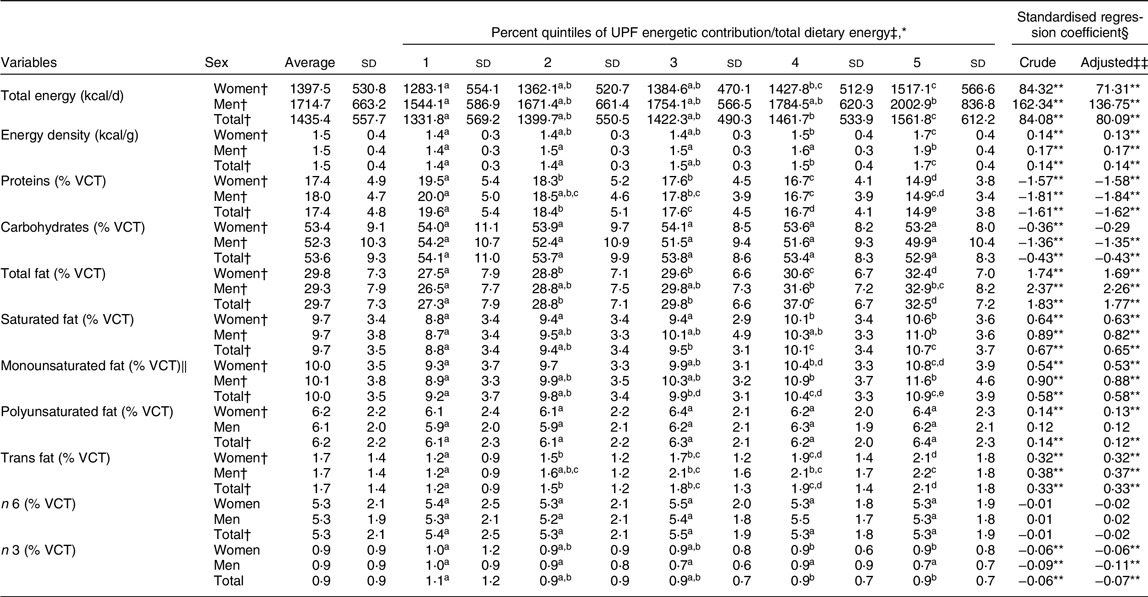
VCT, total energetic value of the diet.
* Values with the same letter do not differ using the ANOVA and Scheffe test at 5 % of probability.
† P value <0·05 for linear trend test of food consumption variables according to ultra-processed food consumption quintiles.
‡ Percentage of total energy consumption of ultra-processed foods: average (amplitude): Q1 = 8·4 % (0–14·4); Q2 = 18·5 % (14·4–22·6); Q3 = 26·4 % (22·6–30·4); Q4 = 34·9 % (30·4–40·6); Q5 = 50·2 % (40·6–85·7).
§ Linear regression of dietary nutrients in quintiles of% energy from consumption of ultra-processed foods, expressed in units of sD.
‖ Recommendation: difference between% total fats and other fats (polyunsaturated, trans, linoleic and linolenic fatty acids), with a range of 1·21 to 31·93 % in the sample.
** P value <0·05.
‡‡ Adjusted by sex, age, years of study and marital status.
For both sexes, linear regression analysis showed a direct relationship between the contribution of energy from UPF and the total diet energy, energy density and the consumption of total, saturated, monounsaturated and trans fats; an inverse relationship was found between the proportion of protein and the proportion of n-3 fatty acids. For women, a direct relationship was also observed between high UPF consumption and energies coming from polyunsaturated fat; for men, an inverse relationship was found between high UPF consumption and energies coming from carbohydrates (Table 2).
For all participants who reported a higher consumption of UPF, we found a lower intake of fibre, Fe, P, Mg and K and a higher intake of Na relative to participants in the first quintile. After the adjustments, an inverse relationship was observed between the coefficients of the contribution of energy from UPF and the consumption of fibre, Fe, P, Mg and K, and a direct relationship was observed to Na consumption for both sexes. An inverse association between a higher intake of UPF and Ca was also identified for women (Table 3).
Table 3 Average consumption of fibre and minerals according to the quintiles of percentage of energy derived from the consumption of ultra-processed foods (UPF) from regulars in a Brazilian health promotion service. Belo Horizonte, Minas Gerais, Brazil (2013–2014)
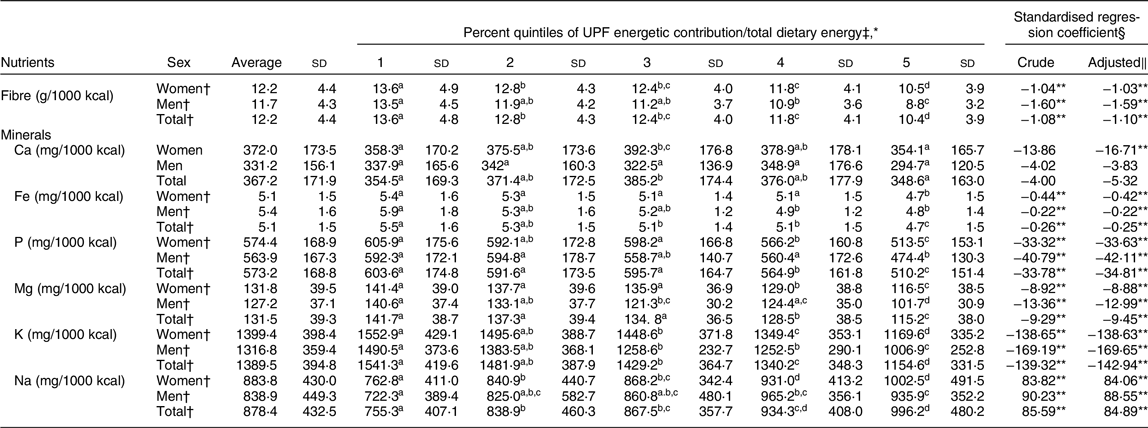
* Values with the same letter do not differ using the ANOVA and Scheffe test at 5 % of probability.
† P value <0·05 for linear trend test of food consumption variables according to UPFS consumption quintiles.
‡ Percentage of total energy consumption from UPF: average (amplitude): Q1 = 8·4 % (0 to 14·4); Q2 = 18·5 % (14·4 to 22·6); Q3 = 26·4 % (22·6 to 30·4); Q4 = 34·9 % (30·4 to 40·6); Q5 = 50·2 % (40·6 to 85·7).
§ Obtained by Linear Regression of the amount of dietary nutrients in the quintiles of energy percentage from consumption of UFP and expressed in units of sD.
‖ Adjusted by sex, age, years of education and marital status.
** P value statistically significant at P < 0·05.
Women in the quintile of highest consumption of UPF were found to consume a smaller amount of all vitamins, except B12. On the other hand, men had a lower consumption of only vitamin B6. For both sexes, an inverse relationship was found between the coefficients of the contribution of energy from UPF and the consumption of vitamins B6, C and folate; and the consumption of vitamins A, B3 and B12 for women (Table 4).
Table 4 Average consumption of vitamins according to the quintiles of percentage of energy from the consumption of ultra-processed foods (UPF) from regulars in a Brazilian health promotion service. Belo Horizonte, Minas Gerais, Brazil (2013–2014)

* Values with the same letter do not differ using the ANOVA and Scheffe test at 5 % of probability.
† P value <0·05 for linear trend test of food consumption variables according to ultra-processed food consumption quintiles.
‡ Percentage of total energy consumption from ultra-processed foods: average (amplitude): Q1 = 8·4 % (0 to 14·4); Q2 = 18·5 % (14·4 to 22·6); Q3 = 26·4 % (22·6 to 30·4); Q4 = 34·9 % (30·4 to 40·6); Q5 = 50·2 % (40·6 to 85·7).
§ Obtained by linear regression of the amount of dietary nutrients in the quintiles of energy percentage from consumption of ultra-processed foods and expressed in units of sD.
‖ Adjusted by sex, age, years of education and marital status.
** P values statistically significant at P < 0·05.
The prevalence of nutrient inadequacy associated with a higher risk of developing NCD was higher in the quintile of highest consumption of UPF relative to the first quintile, except for Na among men. When the prevalence of inadequate consumption was analysed, and considering the first quintile of percentage contribution of energy from UPF as a reference, a 100 % increase was found in inadequate Na intake, an 80 % increase in inadequate total fat intake, a 70 % increase in inadequate fibre and saturated fat intake, a 60 % increase in inadequate trans-fat intake and a 30 % increase in inadequate K intake among individuals in the last quintile. Among men, no significant increase was found in the prevalence of inadequate consumption of K, considering the quintiles of contribution of energy from UPF (Table 5).
Table 5 Prevalence and prevalence ratio of inadequate nutrient intake with recommendations for the prevention of non-communicable disease (NCD) according to the quintiles of energy percentage derived from the consumption of ultra-processed foods (UPF) among health promotion service users in Brazil, Belo Horizonte, Minas Gerais, Brazil (2013–2014)
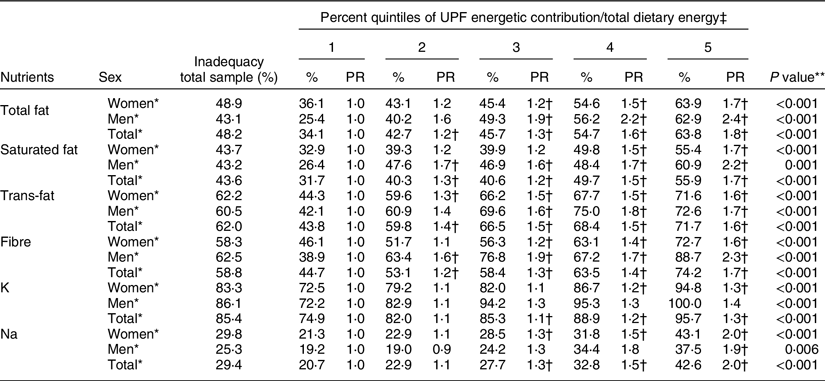
PR, prevalence ratio.
* P value <0·05 for linear trend test.
† Statistically significant values for Wald test at 5 % significance.
‡ Percentage of total energy consumption from ultra-processed foods: average (amplitude): Q1 = 8·4 % (0 to 14·4); Q2 = 18·5 % (14·4 to 22·6); Q3 = 26·4 % (22·6 to 30·4); Q4 = 34·9 % (30·4 to 40·6); Q5 = 50·2 % (40·6 to 85·7).
** χ 2 test with Bonferroni correction.
The prevalence of inadequate micronutrient intake was > 50 % for vitamins A, B3, and folate and for the minerals Ca and Mg. The higher consumption of UPF from the fifth to the first quintile was associated with a higher prevalence of inadequate intake of vitamin B6 among women and vitamins A and C among both sexes and a lower prevalence of inadequate Ca intake among women and vitamin B3 among men. The inadequate intake prevalence ratios were significantly higher in the last quintile of UPF consumption for vitamins B6 and C among females, reaching an increase of 64 % and 25 %, respectively, when compared with the first quintile (Table 6).
Table 6 Prevalence and prevalence ratio of inadequate consumption of micronutrients according to quintiles of percentage of energy from consumption of ultra-processed foods (UPF) among health promotion service users in Brazil, Belo Horizonte, Minas Gerais, Brazil (2013–2014)

PR, prevalence ratio.
* P value <0·05 for linear trend test.
† Statistically significant values for Wald test at 5 % significance.
‡ Percentage of total energy consumption from ultra-processed foods: average (amplitude): Q1 = 8·4 % (0 to 14·4); Q2 = 18·5 % (14·4 to 22·6); Q3 = 26·4 % (22·6 to 30·4); Q4 = 34·9 % (30·4 to 40·6); Q5 = 50·2 % (40·6 to 85·7).
** χ 2 test with B.
Discussion
The consumption of UPF among the participants in a health-promotion service of Brazilian Primary Care was high, especially among women, adults and those with a higher income or education. The higher consumption of UPF was associated with higher energy density and energy consumption, higher content of total and trans fats and lower content of fibre, Fe, P, Mg, K and vitamin B6. For women in particular, the higher consumption of UPF was associated with lower consumption of monounsaturated and n-3 fats and of vitamins A, B3, B12, folate and C and higher Na content. The prevalence ratios of inadequate nutrient intake associated with a higher risk of NCD ranged from 30 % to 100 % for the total sample when the highest and first quintile of UPF consumption are compared.
A high consumption of UPF was found that reached 50·2 % (40·6–85·7 %) of the total energetic intake in the last quintile, even in users of a health-promotion service(Reference Lopes, Ferreira and Mendonça45). This consumption was even higher than that observed in the Brazilian population (27·7 % v. 21·5 %)(Reference Louzada, Martins and Canella7), but lower than that found in countries such as the USA (57·5 %)(Reference Steele, Popkin and Swinburn3) and the UK (56·8 %)(Reference Rauber, Da Costa Louzada and Steele4) and in a study of young adults from a Brazilian city (51·2 %)(Reference Bielemann, Motta and Minten46). These discrepancies between national data may be related to differences in the age groups investigated.
Similar to the results found in our study, in general, past studies have broadly found that the consumption of UPF is higher in women(Reference Bielemann, Motta and Minten46), adults(Reference Moubarac, Batal and Louzada5,Reference Marrón-Ponce, Sánchez-Pimienta and Louzada47) and those with higher educational attainment(Reference Bielemann, Motta and Minten46–Reference Simoes, Barreto and Molina48) and income(Reference Bielemann, Motta and Minten46–Reference Simoes, Barreto and Molina48). The developed countries, which have greater income equality and less inequality in its distribution, also present with higher consumption of UPF (42 % in Australia; 47·7 % in Canada; 56·8 % in the UK and 57·5 % in the USA)(Reference Steele, Popkin and Swinburn3–Reference Moubarac, Batal and Louzada5,Reference Machado, Steele and Levy49) compared with developing countries (29·8 % in Mexico; 28·6 % in Chile; 21·5 % in Brazil and 15·9 % in Colombia)(Reference Louzada, Martins and Canella7,Reference Marrón-Ponce, Sánchez-Pimienta and Louzada47,Reference Cediel, Reyes and Louzada50,Reference Parra, da Costa-Louzada and Moubarac51) . A study carried out in the same city as the present study showed that the energetic contribution of UPF is higher among individuals of high socio-economic status(Reference Simoes, Barreto and Molina48).
The majority of PHC service users in Brazil present an economic classification from medium (54·3 %) to low (38 %), with 32 % receiving some type of financial government aid(Reference Guibu, Moraes and Guerra Junior52). Although some studies(Reference Bielemann, Motta and Minten46,Reference Simoes, Barreto and Molina48) have shown that lower income is associated with lower consumption of UPF, a high consumption of UPF is nevertheless found in users of PHC services residing in vulnerable areas. This result may be related to social inequalities such as limited access to establishments that sell healthy food and a high supply of readily accessible UPF(Reference Costa, Oliveira and Lopes53). In addition, marketing and advertisements for UPF are pervasive in Brazil, which is also home to an ineffective food labelling system that may not be easily understood by a wide range of populations(Reference Maia, Costa and Coelho54).
Similar to results from other studies(Reference Steele, Popkin and Swinburn3–Reference Moubarac, Batal and Louzada5,Reference Louzada, Martins and Canella7,Reference Bielemann, Motta and Minten46,Reference Marrón-Ponce, Sánchez-Pimienta and Louzada47,Reference Machado, Steele and Levy49–Reference Parra, da Costa-Louzada and Moubarac51,Reference Steele, Baraldi and Louzada55,Reference Marrón-Ponce, Flores and Cediel56) , we found that a high consumption of UPF is associated with a poorer diet quality, which can compromise metabolic processes and which constitutes an important risk factor for NCD(Reference Mendonça, Pimenta and Gea8–Reference Srour, Fezeu and Kesse-Guyot13). Corroborating these results, we identified a high prevalence of inadequate consumption of nutrients (total, saturated and trans fats; fibre; K and Na) according to the references for the prevention of NCD, with an upward progression proportional to the contribution of energy derived from UPF. The prevalence of inadequate intake of vitamins B6 and C among women also has become worse, with the highest contribution of energy derived from UPF, as analysed according to Dietary Reference Intakes guidelines.
Compared to the results of a UK-based study(Reference Rauber, Da Costa Louzada and Steele4), the prevalence of nutrient inadequacy in our study was lower for saturated fats (43·6 % v. 74·45 %), fibre density (58·8 % v. 84·02 %) and Na (29·4 % v. 74·92 %) and higher for K (85·4 % v. 74·76 %). In relation to an Australian-based study(Reference Machado, Steele and Levy57), the prevalence of inadequate intake in our study was lower for total fats (48·2 % v. 60·0 %), saturated fats (43·6 % v. 73·8 %), fibre (58·8 % v. 70·2 %), Na (29·4 % v. 77·9 %) and K (85·4 % v. 86·1 %). Both studies took place in developed countries with an average consumption of UPF greater than 40 %, which may explain the higher rate of inadequate nutrient intake. Further studies are needed to investigate inadequate nutrient intake associated with NCD in developing countries and in health promotion services.
Unlike national and international studies, our study identified positive characteristics of the participants’ diets, even among those with high consumption of UPF. The values for energy consumption (average: 1435 kcal/d) and energy density (average: 1·5 kcal/g) of the diet were lower than those found in a Brazilian population study (1866 kcal/d and 1·7 kcal/g, respectively)(Reference Louzada, Martins and Canella7). Similarly, average fibre consumption was higher (12·2 v. 11·1 g/d for the Brazilian population study)(Reference Louzada, Martins and Canella7), and Na consumption was lower (average: 877·8 mg/1000 kcal) relative to the national average of approximately 12 000 mg/person(58).
These positive characteristics of the diet, such as lower energy consumption, energy density and Na and higher fibre consumption, when compared to the national average may be related to the high prevalence of overweight or obesity (64·3 %) and chronic diseases, such as arterial hypertension (53·3 %) and diabetes (16·1 %), identified among PAS users. The presence of NCD can encourage the search for food choices that promote an energetic deficit and participation in regular physical exercise, especially among women(Reference Assumpção, Domene and Fisberg59). Data from the Surveillance System risk and protection factors for NCD carried out in the 27 Brazilian capitals (VIGITEL) showed that only 22·9 % of Brazilian respondents and 31·3 % of respondents from Belo Horizonte presented recommended consumption of fruits and vegetables(60), which differed from the results of our study that found a high rate of adequate consumption of fruits and vegetables (5·4 servings/d)(Reference Mendonça, Lopes and Freitas61). This fact may explain the higher fibre content and lower energy density in the diet of the health promotion service users studied when compared with national data(Reference Louzada, Martins and Canella7). In addition, the PAS offers frequent health education activities and services that aim to promote adequate food intake and healthy choices(Reference Sá, Dornelles and Cruz62).
This paper makes a significant contribution to the field by highlighting the importance of health services for improving diet quality and thereby delaying the progression of NCD and their associated risk factors. On the other hand, the high consumption of UPF found in our study population reinforces the importance of access to dietary guidelines that discourage UPF consumption in favour of healthier alternatives and that provides guidance on strategies to limit UPF intake. The new Dietary Guidelines for the Brazilian Population(21), which provides guidance on food consumption according to the degree and extent of industrial processing, was published after the data collection period in the present study. Thus, further studies are needed to assess changes in the consumption of UPF in these services following the implementation of this dietary guideline.
These results also alert to challenges of nutritional care in SUS. The expansion of health promotion programmes such as PAS must occur in tandem with the production and dissemination of materials based on the Dietary Guidelines for the Brazilian Population(21–24). Ongoing food and nutrition education and professional development for health professionals is also urgently required(Reference Tramontt and Jaime63). In addition, it is important to promote the expansion of dietitian’s presence in PHC. However, since November 2019, the Expanded Nucleus of Family Health and Primary Care, a strategy that expanded the hiring of professionals, including dietitians, no longer has specific financing, and this choice was conditioned to the political organisation of each municipality(64,65) . Concomitantly, the current government approved a freeze on spending on the health sector and attempted to modify the Brazilian Federal Constitution to remove the minimum investment in health in the country. All these aspects increase the challenges to implement health food promotion policies in Brazilian PHC.
Another important strategy to reduce UPF consumption is the deployment of intersectoral public policies with guaranteed funding, including the National Food and Nutrition Security Policy(66), National Food and Nutrition Policy(67), National System Food and Nutrition Surveillance(68) and programmes as Food Acquisition Program and Bolsa Família, which is a cash transfer programme(69). Considering the importance of intersectoral policies, Belo Horizonte (the municipality of this study) has several internationally awarded initiatives aimed at improving access to adequate and healthy food, such as the implementation of public farmer’s market and open air markets. However, these initiatives are scarce in their reach(Reference Lopes, Menezes and Araújo70), highlighting the importance of policies that expand access and commercialisation of healthy foods in the context of health promotion services.
Policies that meet the regulatory advertising rules and nutritional labelling requirements of foods and that include proposals such as the taxation of UPF are also important for minimising UPF intake. In a study evaluating the immediate effects of adopting front-of-pack nutrition labelling in Uruguay, 58 % of respondents changed their typical purchasing decisions, opting for healthier products, presumably due to the simplified nutritional information that was more visible and more easily understood(Reference Ares, Antúnez and Gimenez71). In Brazil, front-of-pack nutrition labelling was approved for nationwide use as early as late 2022(72).
Another effective example in which UPF consumption was reduced was the tax on sugar-sweetened beverages adopted in Mexico, which was associated with fewer purchases of the taxed beverages and greater purchases of untaxed beverages(Reference Colchero, Popkin and Rivera73). In a study conducted with a household sample of the Brazilian population, taxation of UPF was suggested as a method for obesity control. A 1 % increase in the retail price of UPF is believed to result in a lower prevalence of overweight and obesity by 0·33 % and 0·59 %, respectively(Reference Passos, Maia and Levy74). However, there is no political perspective for taxing UPF in Brazil. So far, there have been few bill proposals for taxation and what few there were failed to be approved in 2020(Reference Mariath and Martins75).
Among the study’s limitations are possible inherent biases in food-related questionnaires, such as memory errors, underreporting and conscious or subconscious modification of food consumption patterns on recorded days. To minimise these biases, the data collection team was trained every 6 months, the instruments were pre-tested and validated and a field manual was compiled for consultation. In addition, the use of R24 h is advised for epidemiological studies with a large sample size, and especially for individuals with reduced education, because it is less sensitive to the respondent’s educational and literacy levels(Reference Menezes, Costa and Ferreira28,29) .
Another limitation is that added or free sugars were not analysed in this study. Given that self-reports of sugar additions by participants were often inaccurate, thereby leading to possible measurement biases, this analysis was excluded; rather, sugar content was standardised according to the volume ingested. Further studies are needed to uncover the relationship between the consumption of UPF and the sugar content of the diet in the context of preventing NCD.
Furthermore, the external validity of this study is limited because the participants were recruited from health services rather than from the general population. However, the study was conducted in a city that was a pioneer in implementing this health promotion service and that has a larger number of PAS units than most Brazilian municipalities. Finally, data were collected in 2013–2014, suggesting that the results of the study may not accurately reflect the dynamic fluctuations characteristic of the UPF market. Nevertheless, our results can be used as a baseline for future studies that wish to assess the impact of the Dietary Guidelines for the Brazilian Population, which was published in 2014(21).
The advantages of this study are the large sample size and the inclusion of the NOVA food system to analyse food consumption in a health promotion programme, even before this classification was proposed in the Dietary Guidelines for the Brazilian Population. Our study is the first study to assess the consumption of UPF and its association with the nutritional profile of the users of a health promotion service, highlighting the challenges yet to be overcome to improve public policies and health promotion strategies.
The results suggest that the actions taken to promote adequate and healthy food consumption developed in a health promotion service of PHC apparently contribute to an adequate nutritional dietary profile. On the other hand, the results indicate the need to incorporate socio-demographic factors and approaches that encourage the reduction of UPF consumption in order to generate more informative data. In addition, addressing issues inherent to the food environment in the design of public policies can contribute to promoting healthy food environments and thereby favour a broader range of interventions offered by health services.
Conclusions
The high consumption of UPF, which was especially observed among women, adults and individuals with higher education or income levels, was associated with a worse diet profile in participants in a health promotion service of Brazilian PHC. The positive characteristics of the diet of the health service users, such as lower energy consumption, energy density and Na and higher fibre consumption, when compared to the national data, suggest the importance of investing in health services that offer regular actions to promote adequate and healthy food consumption, since these diet characteristics configure protective factors for NCD. However, the results also highlight the need for future studies to include approaches that encourage the reduction of UPF consumption and to support these approaches with public policies that promote healthy food consumption.
Acknowledgements
Acknowledgements: To the team of the Research Group on Nutrition Interventions at the Federal University of Minas Gerais who conducted the community trial and who organised the database; to the users of the Health Gym Program and employees of municipal health secretary of the city of Belo Horizonte who contributed to this study and to Luiza Ali Dinis and Mariana Oliveira Martiniano for reviewing the English. Financial support: This research was funded by Conselho Nacional de Desenvolvimento Científico e Tecnológico –CNPq (476686/2013-0; a research productivity scholarship to ACSL e LCS) and Fundação de Amparo à Pesquisa do Estado de Minas Gerais – FAPEMIG (21618/2013). The funders had no role in the design of the study; in the collection, analyses or interpretation of data; in the writing of the manuscript, or in the decision to publish the results. Conflict of interest: There are no conflicts of interest. Authorship: S.F.C. – designed the research; took care analyses; interpreted the data; wrote the first draft of the manuscript; contributed to the data interpretation and revised each draft for important intellectual content. L.C.D.S. – took care of data collection and management; interpreted the data; contributed to the data interpretation and revised each draft for important intellectual content. M.S.L. – took care of data collection and management; contributed to the data interpretation and revised each draft for important intellectual content. P.P.D.F. – took care of data collection and management; contributed to the data interpretation and revised each draft for important intellectual content; got funding acquisition. A.C.S.L. – designed the research; took care of data collection and management; interpreted the data; wrote the first draft of the manuscript; contributed to the data interpretation and revised each draft for important intellectual content; got funding acquisition; was responsible for conceptualisation and project administration. Ethics of human subject participation: This study was conducted according to the guidelines laid down in the Declaration of Helsinki, and all procedures involving research study participants were approved by the Research Ethics Committees of Universidade Federal de Minas Gerais (0537.0.0203.000-11) and of the Belo Horizonte municipality (0537.0.0203.410-11 A). In addition, it was registered at the Brazilian government’s Registry of Clinical Trials (RBR-9h7ckx) in accordance with the criteria required by the International Committee of Medical Journal Editors (ICMJE) and by the WHO. All users of the PAS units signed an informed consent form.


