


Over the past few decades, the prevalence of overweight and obesity has been increasing globally, with particularly high increases in low- and middle-income countries(Reference Ng, Fleming and Robinson1). In Sub-Saharan Africa (SSA), most countries are in the first stage of the obesity transition, with a higher prevalence of overweight and obesity among women than men(Reference Jaacks, Vandevijvere and Pan2), among those with higher socio-economic status (SES)(Reference Jaacks, Vandevijvere and Pan2) and among those in urban compared with rural settings(Reference Ford, Patel and Narayan3). Despite substantial increases in rural body mass index (BMI), rising BMI among women in urban SSA remains one of the main drivers of the obesity epidemic in the region(Reference Bixby, Bentham and Zhou4). In Ghana, Malawi and Tanzania, the countries of focus in the present study, the prevalence of overweight or obesity (BMI ≥ 25 kg/m2) among adult women ≥20 years of age was 38·4, 25·7 and 38·5 % in 2013, respectively(Reference Ng, Fleming and Robinson1). Among women of reproductive age (WRA) living in urban areas, overweight or obesity prevalence ranged from a low of 36·2 % in Malawi in 2015–2016(5) to a high of 49·0 % in Ghana in 2014(6). The prevalence in Tanzania in 2015–2016 was 41·6 %(7), close to Ghana’s. Estimates of the prevalence of overweight and obesity among older women are lacking, but they are likely similar to those for adult women in general. In 2017, high BMI accounted for 16·2, 8·3 and 11·6 % of disability-adjusted life years among women 50–69 years in Ghana, Malawi and Tanzania, respectively, a larger contribution compared with WRA(8).
Dietary patterns (DP) are a useful way to describe overall diets and eating behaviour that takes advantage of the correlation of nutrients and foods, and the potential synergistic and cumulative effects of multiple nutrients on obesity and chronic disease. In addition, DP parallel real-world consumption of foods and may therefore be easier to interpret and translate by the general public, potentially improving the development of and adherence to food-based dietary guidelines and recommendations(Reference Hu and Hu9).
Many studies have looked at DP in high-income countries and their relationship with obesity, particularly among women(Reference Arabshahi, Ibiebele and Hughes10–Reference Zhang, Wang and Wang18). Despite the heterogeneity among studies, they generally find that healthier, in many cases more traditional, DP characterised by higher intakes of vegetables, fruits and reduced-fat foods are associated with a lower prevalence of overweight and obesity, while modern or Western DP, characterised by higher intakes of meat and fried foods, are associated with a higher prevalence of overweight and obesity(Reference Boggs, Palmer and Spiegelman11–Reference Newby, Muller and Hallfrisch17). However, less is known about DP among adult women in urban SSA and their relationship with BMI, overweight and obesity.
Few studies have previously characterised DP in SSA(Reference Keding, Msuya and Maass19–Reference Frank, Kröger and Schulze31). The majority of these studies were small, focusing on rural areas, specific populations or narrow age groups, for example, adolescents in South Africa(Reference Pisa, Pedro and Kahn23), defence forces in Cameroon(Reference Nkondjock and Bizome24) and secondary school students in Tanzania(Reference Tluway, Leyna and Mmbaga22). Only six of these studies have examined DP among adult women in urban areas in Benin(Reference Sodjinou, Agueh and Fayomi29), Botswana(Reference Maruapula and Chapman-novakofski25), Burkina Faso(Reference Becquey, Savy and Danel30), Cameroon(Reference Nkondjock and Bizome24), Ghana(Reference Frank, Kröger and Schulze31) and Tanzania(Reference Katalambula, Meyer and Ngoma21). Of the six studies, only one described DP among the elderly (≥60 years)(Reference Maruapula and Chapman-novakofski25). The association between DP and overweight among women was assessed only in Burkina Faso(Reference Becquey, Savy and Danel30). The authors identified two DP: a snacking DP, characterised by frequent food consumption outside of main meals, and a modern DP, characterised by modern foods and preparation methods (e.g., scrambled eggs, pasta, cheese and soda, among others). They found that the modern, but not the snacking, DP was associated with a higher prevalence of overweight(Reference Becquey, Savy and Danel30).
Given the rising prevalence of obesity among women in urban SSA, and limited evidence on DP and their association with BMI, overweight and obesity in this population, the objectives of the current study were to: (1) derive and characterise DP among WRA and older women in urban settings in SSA – Accra, Ghana; Lilongwe and Kasungu, Malawi and Dar es Salaam, Tanzania, and (2) examine the association between DP and BMI, overweight and obesity.
Methods
Ghana study
We used data from the Women’s Health Study of Accra Wave II conducted in Accra, Ghana between October 2008 and June 2009. Details on the study design, sampling and administration have been previously published(32). Briefly, Women’s Health Study of Accra Wave II was the second wave of a community-based longitudinal study of women’s health aiming to quantify the burden of disease among adult women living in Accra, Ghana. A representative sample of women ≥18 years of age usually resident in Accra was drawn for the first wave in 2003, stratified by SES of the enumeration area of residence and age group (18–24, 25–34, 35–54 and 55+ years). Older women were oversampled to ensure statistical power. In 2008–2009, a total of 2814 women ≥18 years of age from all 195 enumeration areas were interviewed. Written informed consent was obtained by fieldworkers who provided information about the study to each participant.
A twenty-five-section quantitative household questionnaire was used to collect information on women’s socio-economic and demographic characteristics, general health and diet. Additional sections administered in line with the primary objective of the study are described elsewhere(32). Height and weight were directly assessed by trained female fieldworkers. Women wore lightweight clothing and no shoes for the assessment. Height was measured to the nearest 0·1 cm using a Shorr height board. Weight was measured to the nearest 0·1 kg using a calibrated Fazzini scale. Finally, women’s diet was assessed using a locally adapted modified non-quantitative food frequency questionnaire (FFQ) of the previous day. Respondents were asked if they consumed each of twenty-one individual foods or food groups in the past 24 h. Portion sizes and frequencies of intake were not collected.
Malawi study
The Malawi sample came from a study on the drivers of food choice among mothers (19–48 years) with children 6–59 months of age in the Lilongwe and Kasungu Districts in the Central Region of Malawi. The study purposefully sampled three types of mother–child pairs: overweight mothers with an overweight child, overweight mothers with a normal weight child and normal weight mothers with an overweight child. The primary objectives of the study were to compare the dietary intake of mothers and children in the three types of mother–child pairs and to identify and explain predictors of dietary intake and food choice. We used data on 138 mothers living in urban areas (n 68 in Lilongwe and n 70 in Kasungu). Trained fieldworkers obtained written informed consent from each participant.
Quantitative household questionnaires collected information on women’s socio-economic and demographic characteristics and diet, among other outcomes related to the primary objectives of the study. Fieldworkers assessed height and weight directly. Height was measured to the nearest 0·1 cm using a portable stadiometer (Seca 213). Weight was measured to the nearest 0·1 kg using a digital scale (Seca 803). Women wore lightweight clothing and no shoes for the assessment. Finally, women’s diet was assessed using a quantitative locally adapted FFQ, previously developed and validated for use among low-literate populations in South Africa(Reference Wrottesley, Micklesfield and Hamill33). Respondents were given pictures of 147 individual foods and asked to sort them into three piles based on how frequently they consumed each food in the past 7 d: ‘rarely or never’, ‘less frequently, occasionally’ or ‘regularly’. Next, for regularly consumed foods, information on the frequency (number of times consumed in the past 7 d), quantity (weight in grams measured on an electronic kitchen scale using actual foods or water/dry rice as proxies) and typical preparation method was collected.
Tanzania study
Data from the Dar es Salaam Urban Cohort Hypertension Study (DUCS-HTN) were used. Details on DUCS-HTN have been previously published(Reference Zack, Irema and Kazonda34–Reference Kakarmath, Zack and Leyna36). In brief, DUCS-HTN was a prospective cohort study conducted in two (out of seven) randomly selected neighbourhoods in the Ukonga Ward of Dar es Salaam. A total of 2290 adults ≥40 years living in these two neighbourhoods were enrolled in the study in March–June 2014. The primary objectives of the study were to determine the prevalence of hypertension in Dar es Salaam, its risk factors and the barriers to diagnosis and treatment. Written informed consent was obtained from all participants.
Trained fieldworkers administered quantitative household questionnaires and conducted physical examinations in participants’ homes. The household questionnaires collected information on socio-economic and demographic characteristics, general health and diet, among other information relevant to the primary objectives of the study. Height and weight were directly assessed during the at-home physical examination. Height was measured to the nearest 1 cm. Weight was measured to the nearest 0·1 kg using a digital scale (Seca). Participants wore minimal clothing and no shoes for the assessment.
A dietary sub-study was conducted among 415 participants, 252 of whom were women. Diet was assessed using a locally adapted semi-quantitative FFQ with 179 food items, specified portion sizes and a recall period of 30 d. Portion sizes and frequencies were collected for each food. The frequency categories in reference to the pre-specified portion size for each food were: ‘never’, ‘1–3 per month’, ‘1 per week’, ‘2–4 per week’, ‘5–6 per week’, ‘1 per d’, ‘2–3 per d’, ‘4–5 per d’ and ‘6+ per d’. Further details on the FFQ and its validity are described elsewhere(Reference Zack, Irema and Kazonda34).
Sample size
We constructed four analytical samples for our analyses. For the first comparison of WRA (referred to as the WRA comparison from hereon), we used data from Ghana and Malawi. The samples were restricted to women 18–54 years in Ghana (n 1877) and women 19–48 years in Malawi (n 138). In the Ghana sample, pregnant women (n 73) and women with missing data on BMI (n 13), diet (n 9) and education (n 10) were excluded. The final sample of WRA in Ghana consisted of 1762 women. In the Malawi sample, one woman with missing age was excluded, leaving us with a final sample size of 137 WRA.
For the second comparison of older women (referred to as the older women comparison from hereon), data from Ghana and Tanzania were used. The samples were restricted to women ≥55 years in Ghana (n 559) and women ≥50 years in Tanzania (n 138). In the Ghanaian sample, thirty-three women with missing BMI data, six women with missing diet data and six women with missing education data were excluded. The final sample size of older women in Ghana was 514. We excluded four women from the Tanzania sample: one with missing diet data and three with missing household wealth data. The final sample size in Tanzania was 134.
Measures
BMI was calculated as weight (kg) divided by height (m) squared. A categorical variable was created with the following BMI categories: underweight (BMI < 18·5 kg/m2), normal weight (BMI ≥ 18·5 kg/m2 and BMI < 25 kg/m2), overweight (BMI ≥ 25 kg/m2 and BMI < 30 kg/m2) and obese (BMI ≥ 30 kg/m2)(37). A binary variable for whether a woman was overweight or obese (BMI ≥ 25 kg/m2) or normal weight (BMI ≥ 18·5 kg/m2 and BMI < 25 kg/m2) was also created.
With respect to socio-economic and demographic characteristics, we examined SES, marital status and education. SES was assessed using principal component analysis (PCA)-derived indices of twenty items measuring housing quality and asset ownership in Ghana and twenty-six items measuring housing quality, asset and animal ownership in Tanzania. In Malawi, we created a summary variable for the number of household assets owned (possible range 0–12). Similar summary variables were constructed for Ghana (possible range 0–10) and Tanzania (possible range 0–20) as well. Marital status was assessed using a binary indicator for whether the woman was married or living with her partner. Education was defined using a binary indicator for whether the woman had no education or primary and higher.
Dietary patterns analysis
We used the same approach to derive DP separately for each comparison in each country. We aimed to ensure both comparability across samples and sufficient variability to conduct PCA. First, we created harmonised binary indicators for whether women consumed each food during the reference period (1 = food was regularly consumed, 0 = food was not consumed or was consumed infrequently). The reference period was the past 24 h in Ghana and the past 7 d in Malawi and Tanzania. While the FFQ reference period in Tanzania was the past 30 d, we converted it to 7 d to ensure better comparability with the Ghana and Malawi samples, and to ensure enough variability in food group consumption. Preliminary analyses of the Tanzania data showed that with a reference period of 30 d, nearly all participants consumed each food group (details on how food groups were aggregated are provided in the next paragraph), leaving low to no variance to be explained by PCA. For the binary indicators, no coding changes were done in the Ghana sample. In the Malawi sample, foods consumed ‘rarely or never’ or ‘less frequently, occasionally’ were coded as 0 = food was not consumed, and foods consumed ‘regularly’ were coded as 1 = food was consumed. In the Tanzania sample, foods consumed at least once per week were coded as 1 = food was consumed, and foods consumed less frequently (i.e., ‘never’ or ‘1–3 times per month’) were coded as 0 = food was not consumed.
Next, we examined the proportion of women who consumed each food in the reference period (Supplemental Tables 1A–1D). Foods that were consumed by ≤10 % of respondents or by ≥90 % of respondents were excluded from the analyses due to their lack of variation. Food items that did not contribute to energy or macronutrient content, such as condiments, were also excluded from the analyses. Remaining foods were grouped into twenty-one mutually exclusive food groups based on guidelines for measuring minimum dietary diversity among WRA(38): cereals and grains; roots and tubers; legumes and pulses; nuts and seeds; dairy; meat, poultry and fish; eggs; dark green leafy vegetables (DGLV), vitamin A-rich vegetables; vitamin A-rich fruits; other fruits; other vegetables; oils and fats; savoury and fried snacks; sweets; sugar-sweetened beverages (SSB); and other beverages. The ‘meat, poultry and fish’ food group was disaggregated into separate meat, organ meat, poultry and fish groups given the existing evidence on differential associations between these individual food groups and overweight and obesity(Reference Schwingshackl, Schwedhelm and Hoffmann39). Lastly, binary indicators were created for whether a food group was consumed (1 = at least one of the food items in the food group was consumed, 0 = none of the food items in the food group were consumed).
DP were derived separately for each comparison in each country using PCA. In the Malawi sample, the cereals and grains food group was excluded from the DP derivation since it was consumed by all women in the sample. The final selection of DP was based on scree plots, eigenvalues >1, Kaiser–Meyer–Olkin measure of sampling adequacy >0·55(Reference Kaiser40) and interpretability. Orthogonal varimax rotation was applied to improve the interpretability of the factors and to ensure that the retained factors were uncorrelated. DP were interpreted and labelled based on minimum absolute factor loadings ≥0·25. Food groups with higher absolute factor loadings weighed more in labelling the DP. DP scores were calculated by summing the foods consumed weighed by all their factor loadings. DP scores were then qualitatively examined and divided into quantiles: quintiles for WRA in Ghana and quartiles for WRA in Malawi and older women in Ghana and Tanzania.
Statistical analysis
Socio-economic and demographic characteristics were examined across quantiles for each DP in each country in each comparison. Bivariate relationships were assessed using a non-parametric test for trend across the ordered DP quantiles. Trends were considered statistically significant at P < 0·05.
To assess the relationship between the PCA-derived DP and continuous BMI, we used a generalised linear model with an identity link. For the combined overweight or obese variable, we fit a log-binomial model, and for the categorical BMI classification a multinomial logistic model. The lowest DP quantile in each sample was used as the reference group, representing women with the lowest DP scores. Unadjusted and adjusted mean differences (aMD) and 95 % confidence interval (CI) or odds ratio (aOR) and 95 % CI were calculated. Adjusted models controlled for women’s age, education, marital status and SES. All covariates were identified a priori. Associations were considered statistically significant at P < 0·05. Sampling weights were applied to the Ghana analyses. To account for multiple hypothesis testing, we also calculated corrected P-values, using the Hochberg method(Reference Hochberg41) which ensures sufficient power and Type I error protection(Reference Blakesley, Mazumdar and Dew42). All statistical tests were two-sided. All analyses were performed using Stata 15(43).
Results
Sample characteristics and diet
Socio-economic and demographic characteristics for each country in each comparison are shown in Table 1. In all four samples, overweight and obesity were prevalent, with over half of the women falling in either category.
Table 1 Socio-economic and demographic characteristics of women in the analysis sample by age group comparison and country
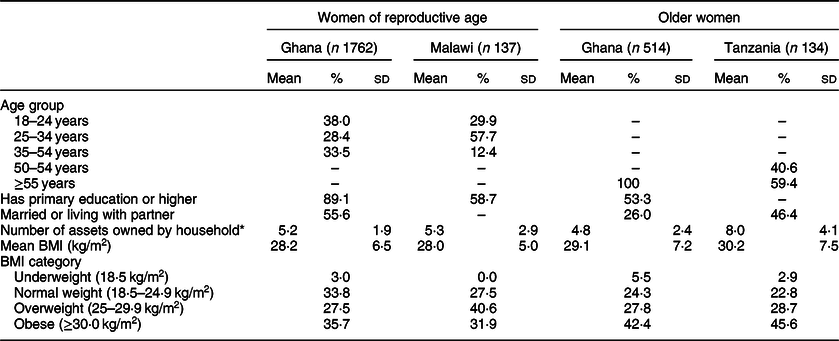
* Possible range: 0–10 in Ghana, 0–12 in Malawi and 0–20 in Tanzania.
WRA in Ghana consumed an average of 6·3 foods in the past 24 h (range 0–18), while WRA in Malawi consumed an average of 20·4 foods in the past 7 d (range 4–40). Older women consumed an average of 5·5 foods in the past 24 h (range 0–15) in Ghana and 33·5 foods in the past 7 d (range 0–71) in Tanzania. Consumption of food groups retained in the DP scores is shown in Supplemental Tables 1A–1D.
Dietary patterns
Among WRA in Ghana, two DP, which explained 30 % of dietary variance, were identified and labelled as protein and healthy (Table 2, Supplemental Fig. 2A). The protein DP was characterised by high consumption of cereals, legumes and pulses, chicken, oils and fats, and savoury and fried snacks. High consumption of nuts and seeds, eggs, DGLV and other fruits characterised the healthy DP. Higher protein DP quintiles were associated with younger age (P for trend < 0·001), while higher healthy DP quintiles were marginally significantly associated with higher number of household assets (P for trend = 0·07) (Supplemental Table 2A).
Table 2 Food group factor loadings by principal component analysis (PCA)-derived dietary pattern by age group comparison and country

–, Food group was not available and therefore was not included in the PCA.
* Food group with minimum absolute factor loading ≥0·25 characterising the dietary pattern.
† In Ghana, legumes and pulses consisted only of beans.
‡ In Ghana, nuts and seeds consisted only of groundnuts.
§ In Tanzania, vitamin A-rich vegetables consisted only of carrots.
║ In Ghana, oils and fats consisted only of butter.
Similarly, two DP, explaining 31 % of dietary variance, were identified among WRA in Malawi (Table 2, Supplemental Fig. 2B). The first DP was characterised by high consumption of roots and tubers, nuts and seeds, dairy, red meat, eggs, vitamin A-rich fruits, sweets and SSB. We labelled this DP as protein. The second DP was characterised by high consumption of legumes and pulses, chicken, vitamin A-rich vegetables, other fruits, other vegetables, and savoury and fried snacks. We labelled this DP as healthy. Higher quartiles of the protein DP were associated with a higher proportion of women with primary education or higher and higher number of household assets (P for trend = 0·02 and <0·001, respectively) (Supplemental Table 2B). Higher healthy DP quartiles were associated with a higher proportion of younger women and a lower proportion of older women (P for trend = 0·04).
Three DP were identified among older women in Ghana: cereal, protein and healthy (Table 2, Supplemental Fig. 2C). These three DP explained 43 % of dietary variance. The cereal DP was defined by high consumption of cereals and SSB. The protein DP was similar to that identified among WRA in Ghana. It was characterised by high consumption of legumes and pulses, red meat, chicken, and savoury and fried snacks. Finally, the healthy DP was characterised by high consumption of eggs, DGLV and other fruits and low consumption of savoury and fried snacks. Women in higher cereal DP quartiles were more likely to have primary education or higher (P for trend = 0·01) and had a marginally higher number of household assets (P for trend = 0·06) (Supplemental Table 2C). Higher protein DP quartiles were associated with a higher proportion of women with primary education or higher and lower number of household assets (P for trend <0·001 and 0·01, respectively). Finally, the number of household assets owned was higher in higher healthy DP quartiles (P for trend < 0·001).
Protein and healthy DP were identified among older women in Tanzania (Table 2, Supplemental Fig. 2D). The percentage of dietary variance they explained was 31 %. The protein DP was characterised by high consumption of dairy, red meat, chicken, eggs, SSB and tea. In contrast, the healthy DP was defined by high consumption of cereals, roots and tubers, nuts and seeds, fish, DGLV and vitamin A-rich fruits. Higher quartiles of both the protein and healthy DP were associated with a higher number of household assets (P for trend <0·001 and 0·02, respectively) (Supplemental Table 2D).
Association with BMI, overweight and obesity
Of the two DP identified among WRA in Ghana, the protein DP was associated with higher odds of overweight and obesity, while the healthy DP was not associated with either BMI or BMI categories (Fig. 1(a), Supplemental Table 3A). Relative to quintile 1 (Q1), higher protein DP quintile was associated with increased odds of overweight (aOR 1·87, 95 % CI 1·23, 2·83 for Q2; and aOR 1·67, 95 % CI 1·12, 2·48 for Q4) and obesity (aOR 1·79, 95 % CI 1·19, 2·70 for Q2). However, none of these estimates were statistically significant after correcting for multiple hypothesis testing. Estimates for the combined overweight or obesity category remained significant after the P-value correction, indicating higher odds of overweight or obesity in Q2 of the protein DP, compared with Q1: aOR 1·82, 95 % CI 1·27, 2·60.

Fig. 1 (a) Association between principal component analysis-derived dietary patterns and overweight and obesity among women of reproductive age (18–54 years) in Ghana. Estimates from a multinomial logistic model controlling for age, education, marital status and wealth. For each dietary pattern, comparisons were to quintile 1 (Q1). Overweight was defined as BMI ≥ 25 kg/m2 and BMI < 30 kg/m2 and obesity as BMI ≥ 30 kg/m2. Comparison was to women of normal weight (BMI ≥ 18·5 kg/m2 and BMI < 25 kg/m2). (b) Association between principal component analysis-derived dietary patterns and overweight and obesity among women of reproductive age (19–48 years) in Malawi. Estimates from a multinomial logistic model controlling for age, education and wealth. For each dietary pattern, comparisons were to quartile 1 (Q1). Overweight was defined as BMI ≥ 25 kg/m2 and BMI < 30 kg/m2 and obesity as BMI ≥ 30 kg/m2. Comparison was to women of normal weight (BMI ≥ 18·5 kg/m2 and BMI < 25 kg/m2). (c) Association between principal component analysis-derived dietary patterns and overweight and obesity among older women (≥55 years) in Ghana. Estimates from a multinomial logistic model controlling for age, education and wealth. For each dietary pattern, comparisons were to quartile 1 (Q1). Overweight was defined as BMI ≥ 25 kg/m2 and BMI < 30 kg/m2 and obesity as BMI ≥ 30 kg/m2. Comparison was to women of normal weight (BMI ≥ 18·5 kg/m2 and BMI < 25 kg/m2). (d) Association between principal component analysis-derived dietary patterns and overweight and obesity among older women (≥50 years) in Tanzania. Estimates from a multinomial logistic model controlling for age, marital status and wealth. For each dietary pattern, comparisons were to quintile 1 (Q1). Overweight was defined as BMI ≥ 25 kg/m2 and BMI < 30 kg/m2 and obesity as BMI ≥ 30 kg/m2. Comparison was to women of normal weight (BMI ≥ 18·5 kg/m2 and BMI < 25 kg/m2). ![]() , overweight and
, overweight and ![]() , obesity
, obesity
Similarly, the healthy DP was not associated with BMI, overweight or obesity among WRA in Malawi, while higher quartiles of the protein DP were associated with higher odds of overweight: aOR 5·04 (95 % CI 1·07, 23·76) for Q3 v. Q1 (Fig. 1(b), Supplemental Table 3B). However, these estimates were not statistically significant after correcting for multiple hypothesis testing.
Among older women in Ghana, the cereal and healthy DP were not associated with either BMI or BMI categories (Fig. 1(c), Supplemental Table 1C). Similar to WRA in Ghana and Malawi, older women in higher protein DP quartiles had higher BMI (aMD 2·76, 95 % CI 0·54, 4·99 for Q2 and aMD 2·83, 95 % CI 0·95, 4·71 for Q3) and higher odds of obesity (aOR 2·32, 95 % CI 1·02, 5·30 for Q2 and 2·29, 95 % CI 1·17, 4·48 for Q3) compared with women in the first protein DP quartile. Likewise, the odds of overweight or obesity were higher among women in the third protein DP quartile compared with women in the first: aOR 2·08, 95 % CI 1·12, 3·86. After adjusting for multiple hypothesis testing, the only association that remained significant was that between higher BMI and protein DP Q3.
Finally, none of the DP identified in Tanzania (protein and healthy) were associated with BMI, overweight or obesity (Fig. 1(d), Supplemental Table 3D). Results suggested that higher healthy DP quartiles lowered the odds of overweight, but the results did not reach statistical significance: aOR 0·18, 95 % CI 0·03, 1·01.
Discussion
We identified protein and healthy DP in each sample of WRA in Ghana and Malawi, explaining 30 and 31 % of dietary variance, respectively. Among older women, we identified cereal, protein and healthy DP (explaining 43 % of dietary variance) in Ghana, and protein and healthy DP (explaining 31 % of dietary variance) in Tanzania.
Protein DP were identified in all four samples. Among WRA, the protein DP were defined by high consumption of both animal- and plant-based proteins. In both the Ghana and Malawi samples, DP suggested a potential shift towards unhealthy foods: savoury and fried snacks characterised the protein DP among WRA in Ghana and the healthy DP among WRA in Malawi, while sweets and SSB characterised the protein DP among WRA in Malawi. However, the protein DP among WRA in Malawi was also characterised by consumption of healthier foods (nuts and seeds, eggs and vitamin A-rich fruits) and therefore possibly represented a transitional rather than a wholly unhealthy diet. Evidence from urban Benin suggests that transitional DP, with relatively low percentage of energy from fat, saturated fat and sugar, may represent a diversification of traditional diets instead of a shift from a traditional to a modern diet(Reference Sodjinou, Agueh and Fayomi29). However, given differences in diet assessment tools, we could not examine DP macro- and micronutrient contents in all samples and did not formally test this transitional-diversification hypothesis. Similarly, the protein DP among older women in Ghana was not wholly unhealthy. Despite the high intake of savoury and fried snacks, this DP was most strongly defined by consumption of plant-based proteins and lean meat. Finally, the protein DP identified among older women in Tanzania was the only protein DP entirely defined by animal-based proteins and unhealthy foods like SSB, suggesting a clearer shift towards a more unhealthy, modern diet in this population.
Previous studies among women living in urban SSA have identified similar combinations of DP: healthy and meat DP in Cameroon(Reference Nkondjock and Bizome24) and Botswana(Reference Maruapula and Chapman-novakofski25), or traditional/healthy and transitional/purchase/modern DP in Benin(Reference Sodjinou, Agueh and Fayomi29), Ghana(Reference Frank, Kröger and Schulze31) and Tanzania(Reference Katalambula, Meyer and Ngoma21). Our findings are consistent with studies from other regions, which have previously identified healthy, Western/modern or meat/protein DP or some combination of these(Reference Arabshahi, Ibiebele and Hughes10–Reference Zhang, Wang and Wang18,Reference Kant44–Reference Mayén, Stringhini and Ford47) . In Ghana, the only other study of DP among women living in urban areas (mean age 50·4 years, data collected in 2007–2008) identified purchase and traditional DP(Reference Frank, Kröger and Schulze31). The latter was characterised by high consumption of plantains, DGLV, eggs and fruits, among other foods(Reference Frank, Kröger and Schulze31) and was closely aligned with the healthy DP we identified among both WRA and older women in Ghana. The protein DP we identified in WRA and older women in Ghana also tracked the purchase DP identified by Frank et al. (Reference Frank, Kröger and Schulze31) to the extent that we found high consumption of protein-rich foods and savoury and fried snacks. Further, the DP we identified among both WRA and older women in Ghana explained a larger proportion of dietary variance (30 and 43 %, respectively) compared with the 22 % of dietary variance explained by DP identified by Frank et al. (Reference Frank, Kröger and Schulze31). With respect to Tanzania, a study conducted in Arusha City, a much smaller urban area compared with Dar es Salaam, examined DP among women 25–64 years of age and identified healthy, Western and complex DP(Reference Katalambula, Meyer and Ngoma21). The former two DP closely resembled the healthy and protein DP we identified among older women in Tanzania. Finally, one study characterised DP among a nationally representative sample of elderly people (≥60 years old) in Botswana(Reference Maruapula and Chapman-novakofski25). The milk, tea and candy DP (one of the five DP identified: beer, meat and fruit, vegetable and bread, seasonal produce, and milk, tea and candy) also loaded highly on cereals and grains, although the factor loadings did not reach the cut-offs established by the authors(Reference Maruapula and Chapman-novakofski25). This DP corresponded to the cereal DP in our sample of older women in Tanzania. The remaining DP identified among the elderly in Botswana differed from the healthy-meat and healthy-modern DP dichotomy identified in more recent studies. These differences may reflect an earlier stage of the nutrition transition (data from 1998 were used in Botswana), or an innately different diet in this population.
Higher quantiles of all DP were associated with higher wealth (number of household assets owned) in all but the older women sample in Ghana, where wealth was inversely associated with higher protein DP quartiles. Similar associations between healthy/traditional DP and wealth have been previously observed both in SSA(Reference Becquey, Savy and Danel30) and other regions(Reference Kant44). Additionally, higher protein DP quartiles among WRA in Malawi and higher cereal and protein DP quartiles among older women in Ghana were associated with a higher level of education. Contrary to our findings, women’s education only played a marginal role in urban diets in Burkina Faso(Reference Becquey, Savy and Danel30), while low education was associated with higher purchase DP and not associated with traditional DP in Ghana(Reference Frank, Kröger and Schulze31).
We found no associations between DP and BMI, overweight and obesity in any of the four samples, except for a higher odds of overweight or obesity among women in protein DP Q2, compared with women in Q1, in WRA in Ghana, and a higher BMI among women in protein DP Q3, compared with women in Q1, in older women in Ghana. The only other study which has previously examined the association between DP and overweight among women in urban SSA showed that a modern DP, characterised by meat and eggs consumption among other foods, was positively associated with overweight among adult women living in urban Burkina Faso(Reference Becquey, Savy and Danel30). While we observed a similar association between the protein DP and overweight or obesity among WRA in Ghana, the relationship was stronger in lower rather than higher DP quintiles, which could partially be explained by the much higher consumption of plant-based protein in these higher quintiles. In addition, the protein DP we identified was more strongly characterised by plant-based proteins and lean meat rather than red meat and eggs, which described the modern DP in Burkina Faso(Reference Becquey, Savy and Danel30). Together with the different age range of participants (20–65 years in Burkina Faso, and 18–54 years in our sample), these differences between our protein DP and the Burkina Faso modern DP could help account for some of the differences in associations between these protein-heavy DP and overweight. In our Malawi sample, the lack of association between the protein DP, most strongly defined by high consumption of dairy and SSB, should be interpreted with caution. Given the small sample size of WRA in Malawi, it is possible we lacked power to detect a statistically significant association. In addition, we did not use data on the quantity of dairy and SSB consumed, which could potentially play a more important role in raising BMI than the frequency of consumption of these two food groups. Finally, the diversified nature of this protein DP may distort the relationship between wholly unhealthy meat-and-fat DP and higher prevalence of overweight and obesity previously reported in high-income settings(Reference Boggs, Palmer and Spiegelman11–Reference Schulze, Fung and Manson15).
With respect to older women, only the protein DP in Ghana was associated with BMI, with women in Q3 having significantly higher BMI compared with women in Q1. The lack of association between the remaining DP in Ghana or Tanzania and overweight and obesity could reflect an earlier stage of the nutrition transition (data collected in 2008–2009 in Ghana and 2014 in Tanzania) or somewhat healthier expressions of the DP. For example, the protein DP in older women in Tanzania was also characterised by moderate consumption of vitamin A-rich vegetables and other fruits, while in Ghana, the protein DP was characterised by high consumption of plant-based proteins and lean meat. Given the lack of studies that have examined the relationship between DP and BMI among older women in urban SSA, our findings should be interpreted with caution as it is possible that they reflect context- or sample-specific trends rather than broader patterns among older women in urban SSA.
One of the main strengths of our study is the use of an a posteriori approach to derive the DP. PCA allowed us to explore and summarise women’s diets as they were observed in each sample. In the absence of any national dietary or nutrition recommendations or guidelines in any of the countries in our study(Reference Herforth, Arimond and Álvarez-Sánchez48), a priori approaches based on pre-defined indices were deemed infeasible. Although a posteriori approaches tend to produce DP that are population-specific and difficult to reproduce, making them less suitable for a cross-country comparison, DP derived using a posteriori approaches reflect actual dietary practices and differences in these practices(Reference Jacques and Tucker49).
Our study also has limitations. First, diet assessment tools differed across countries. The diet assessment in Ghana did not collect information on portion size or frequency of food consumption, both of which are likely more important predictors of overweight and obesity. The shorter recall period in Ghana (24 h) compared with Malawi and Tanzania (7 d in each) can also help explain the lower variability in food consumption observed in Ghana. Despite these differences in diet assessment tools, we harmonised and aligned our diet indicators across countries to the extent possible to ensure comparability. Second, while in Ghana, we had a large sample representative of adult women living in Accra, the samples in both Malawi and Tanzania were small and we may have lacked power to detect a statistically significant association between DP and BMI and BMI categories in these samples. In addition, the sampling strategy in Malawi differed from those in Ghana and Tanzania: it sampled mother–child pairs with an overweight mother, an overweight child or both. Thus, it is possible that these women’s diets might not be representative of all WRA. Third, the dates of data collection differed by 10 years and it is possible the DP we identified reflect different stages of the nutrition transition. The protein DP in Malawi and Tanzania (data collected 2017–2018 and 2014, respectively) showed greater diversity than the protein DP in Ghana (data collected 2008–2009). However, despite the gap between data collection years, levels of economic development were comparable in Ghana (2008–2009 gross domestic product (GDP) per capita of $2844) and Tanzania (2014 GDP per capita of $2575). Although Malawi’s GDP per capita in 2017–2018 ($1159) was lower than Ghana’s in 2008–2009 or Tanzania’s in 2014, Malawi’s 2017–2018 annual GDP growth rate of 4 % was comparable with Ghana’s 4·8 % GDP growth rate in 2009. These similarities across time in economic development and the prevalence of overweight and obesity in our samples suggest that all three countries were in the same stage of the obesity transition(Reference Jaacks, Vandevijvere and Pan2), which lends validity to our comparison of data collected 10 years apart. Therefore, it is likely that the differences in diversity across the protein DP we identified in the different settings are likely due to differences in the diet assessment tools that were used rather than dietary changes over time. Finally, the cross-sectional nature of our study did not allow us to establish causality between diet and overweight and obesity, or to examine changes in this relationship over time.
Conclusions
Among WRA in urban SSA, healthy and protein DP characterised diets in Ghana and Malawi. In Ghana, higher protein DP quintiles were associated with higher odds of overweight or obesity. Among older women in SSA, cereal, protein and healthy DP were identified in Ghana, and protein and healthy DP in Tanzania. Only the protein DP in Ghana was associated with higher BMI. Further research is needed to understand the role of protein-rich foods and the lack of association between DP and overweight and obesity among WRA and older women living in urban SSA to help inform local diet recommendations and interventions that aim to reduce the prevalence of overweight and obesity in urban settings.
Acknowledgements
Acknowledgements: The authors would like to acknowledge the research teams in each study country, as well as the participants for their time and participation in the studies. Financial support: This research received no specific grant from any funding agency, commercial or not-for-profit sectors. The Malawi study was funded by the Drivers of Food Choice (DFC) Competitive Grants Programs, which is funded by the UK Government’s Department for International Development and the Bill & Melinda Gates Foundation, and managed by the University of South Carolina, Arnold School of Public Health, USA; however, the views expressed do not necessarily reflect the UK Government’s official policies. Conflict of interest: None. Authorship: L.B. and L.M.J. conceptualised the study. G.D. designed the Tanzania study and led the fieldwork and data collection activities. G.F. was part of the Ghana study team and supervised all fieldwork and data collection activities. V.L.F., C.T. and L.M.J. designed the Malawi study and led the fieldwork and data collection activities. L.B. and L.M.J. led the data analyses. L.B. drafted the manuscript. All authors contributed to interpretation of the results and the intellectual content. All authors read and approved the final version of the paper. L.B. had final responsibility for submitting this article for publication. Ethics of human subject participation: The study was approved by the institutional review board of the Harvard T.H. Chan School of Public Health (reference number: IRB18-1671). All data were anonymous and contained no identifiable information on the study participants. The study was considered exempt from full review.
Supplementary material
For supplementary material accompanying this paper visit https://doi.org/10.1017/S1368980019005202


