


Every country has its traditional foods, but cultural dietary patterns may change in a globalised food system(Reference Monteiro, Moubarac and Cannon1,Reference Adair and Popkin2) . In modern societies, food accessibility and food advertisement are important environmental factors which trigger automatic and uncontrollable responses on individuals, leading to inadequate food consumption(Reference Monteiro, Levy and Claro3).
Unhealthy diet behaviour is a central contributing factor to obesity, and both are major risk factors for non-communicable diseases (NCD) – such as cardiovascular diseases, type II diabetes and certain types of cancer – the major causes of premature death worldwide(4). The global NCD deaths attributable to dietary risk have increased from 8 to 11 million between 1990 and 2017(5), which is relevant considering food consumption as the major modifiable determinant of NCD(6).
In Brazil and other low- and middle-income countries, beans are the core of a traditional eating(Reference Hayemeier, Erickson and Slavin7,Reference Rawal and Navarro8) . Data from the Brazilian national Household Budget Surveys (HBS) revealed a decline in the household consumption of traditional foods over the years(9,10) . The most recent HBS, conducted between 2017 and 2018 (HBS 2017–2018), revealed a considerable reduction of 52 % in the consumption of beans in comparison with the HBS 2002–2003(10). While these data provide an important overview on the reduction of a traditional food in the country, complementary information is still needed, especially regarding frequency of consumption, since this could also reveal changes in dietary behaviour.
More than a good marker of a healthy diet (due to its nutritional profile)(11,Reference Messina12) , beans is a marker of a traditional dietary pattern and represents a food culture expressed in different culinary preparations all over the country. The assessment of time trends offers a proper understanding of the role of traditional dietary patterns on health and nutrition in populations, contributing for health and diet promotion, as well as the debate of changes in food consumption worldwide. Thus, the present study aimed to identify changes in traditional dietary pattern through the evaluation of trends in beans frequency of consumption among adults in Brazil, between 2007 and 2017, and to estimate its projections up to 2030.
Methods
Study design, sample and data collection
A time-series analysis was conducted based on data from the Surveillance System of Risk and Protective Factors for Non-Communicable Chronic Diseases by Telephone Survey (Vigitel) on a probabilistic sample of Brazilian adults aged ≥ 18 years from all state capitals and Federal District, between 2006 and 2019. This system was implemented in 2006 by the Ministry of Health to investigate, annually, risk and protective factors for NCD among the adult population of all Brazilian capitals and Federal District. A subset of this data (concerning data collected from 2007 and 2017 (n 572 675)) was employed in the present study. Information is obtained through annual telephone surveys conducted with households with, at least, one landline telephone. A probabilistic sample of, approximately, 2000 individuals is interviewed in each city per year of system operation, allowing the estimation of any factors studied with maximum error margin of two percentage points(pp)(13).
The sampling process is systematic and stratified by study site, being carried out in two stages. Initially, a sample of at least 5000 landline telephones per city is drawn, followed by a reorganisation in twenty-five replicas of 200 lines. Each line is contacted up to six times in distinct days and hours (from 09·00 to 21·00 h, including weekends and holidays) to verify its eligibility. Non-residential lines, out-of-service lines and lines that do not answer to any attempt of contact were considered ineligible. At the second stage, one of the adults’ resident in each household is randomly selected and invited to participate in the survey. Vigitel data are accompanied by weighting factors developed in two steps. The first step corrects the unequal probability of selecting households with more than one landline telephone or with more than one resident, and the second step adjusts the distribution of the population interviewed in each city (by gender, age and schooling) to match that predicted for the complete set of the adult population according to gender, age and schooling (based on the official projections for each year)(13).
Data collection was conducted through a computer-assisted telephone interview system, in which the responses were recorded directly in an electronic form by a previously trained interviewer. The system allows the immediate discrimination of invalid responses and the automatic pass through over not applicable questions ensuring the continuous feeding of the system database, in addition to the provision of the total time duration of the full interview. The questionnaire evaluates socio-demographic characteristics and the modules of risk and protection factors for NCD which includes referred data related to food consumption, alcoholic beverages consumption, smoking habits and physical activity practice, as well as overweight and obesity, self-assessment of health status and morbidity. Food consumption was investigated through questions regarding the intake of markers of healthy and unhealthy diets. Bean consumption, a healthy diet marker, was the indicator used to identify changes in the traditional dietary pattern in the country. More details on the sampling process and data collection of Vigitel are described on their annual reports(13).
Data organisation and analysis
Bean consumption was investigated by Vigitel from 2007 to 2017 through the question: ‘How many days a week, do you usually eat beans? (1–2 d/week; 3–4 d/week; 5–6 d/week; every day, including Saturday and Sunday; almost never; never)’. Three indicators were developed to represent bean consumption: ‘regular consumption’ (≥ 5 d/week), ‘non-regular consumption’ (1–4 d/week) and ‘non-consumption’ (almost never | never), and all were calculated independently of the quantity consumed.
A set of three variables complemented the analysis: gender (male; female), age group (18–24 | 25–34 | 35–44 | 45–54 | 55–64 | ≥ 65 years) and educational level (0–8 | 9–11 | ≥ 12 years of study).
Initially, the distribution of the studied population according to socio-demographic characteristics was presented. The prevalence of each indicator of weekly consumption of beans was estimated for each year. The analysis was conducted for the complete set of the population and according to socio-demographic strata. Prais–Winsten regression in a linear splines models was used to identify significant changes in the period. These models offer a less biased and more efficient alternative to standard linear, curvilinear or categorical analyses of continuous exposures and confounders(Reference Howe, Cole and Westreich14). The linear splines modelling used three fixed knots at the years 2007, 2012, 2017 composing two periods of analyses: The first analysed period (2007–2011), the second analysed period (2012–2017) and for the complete period as well.
In these models, the dependant variables were all the indicators of bean consumption (the annual prevalence of regular, non-regular and non-consumption of beans) and the independent variables were the years of data collection, expressed as a continuous variable. The statistical significance of the trends was evaluated using the regression coefficient, which indicates the annual average rate of increase or decrease of each analysed indicator on the period (expressed in percentage points/year). Variations corresponding to a regression coefficient statistically different from zero (P < 0·05) were considered significant. Finally, these models were also used in the estimation of prevalence projections up to the year 2030 for the complete set of the population and by gender, based on its tendency from 2012 to 2017.
The software Stata, version 14.2 (Stata Corp.) was used to organise, process and analyse the data, considering the design of the Vigitel and weighting factors.
Vigitel was approved by the National Commission of Ethics in Research for Human Beings of the Ministry of Health (Conep 355·590 – CAAE: 16202813·2·0000·0008). Data are freely available for public access and use, not allowing the identification of the interviewees.
Results
A total of 572 675 adults from the Brazilian capitals and the Federal District was interviewed by Vigitel from 2007 to 2017. The studied population was mostly female. Between 2007 and 2017, the population faced an increase in age and education. While the proportion of individuals aged between 18 and 44 year decreased, that of individuals aged 45 and over increased. On the same hand, the proportion of individuals with 0 to 8 years of education decreased from 45·0 % to 30·8 %, while that of individuals with 9 years and over increased (data not shown).
Overall, regular consumption of beans (≥ 5 d/week) remained stable in the studied period (2007 to 2017). Similar scenario was observed in all socio-economic strata (except among those aged 35 to 44 years) and among individuals with 9 to 11 years of education. However, stratified analysis revealed contrasting trends in the period. While in the first half of the studied period (from 2007 to 2011), a stability trend was observed – with punctual increases among those aged 18 to 24 years and with 0 to 8 years of education – in the second half (from 2012 to 2017) the prevalence of consumption decreased among both genders, and all age groups and educational levels (except for higher education (≥ 12 years). Considering this recent time period, higher magnitude of reduction was observed among women (−1·37 pp/year), youngers age groups (18–44 years) and those with higher education (−1·25 pp/year) (Table 1). Stratified analyses of the other indicators (non-regular consumption (1–4 d/week) and non-consumption) are consistent with those observed for regular consumption of beans and are available as supplementary material (see online supplementary material, Supplemental Table S1 and Table S2).
Table 1 Prevalence§ (%) of the regular consumption of beans (≥ 5 d/week) among the adult population (aged ≥18 years) from the Brazilian capitals and Federal District by socio-demographic variables, Vigitel, Brazil, 2007–2017||
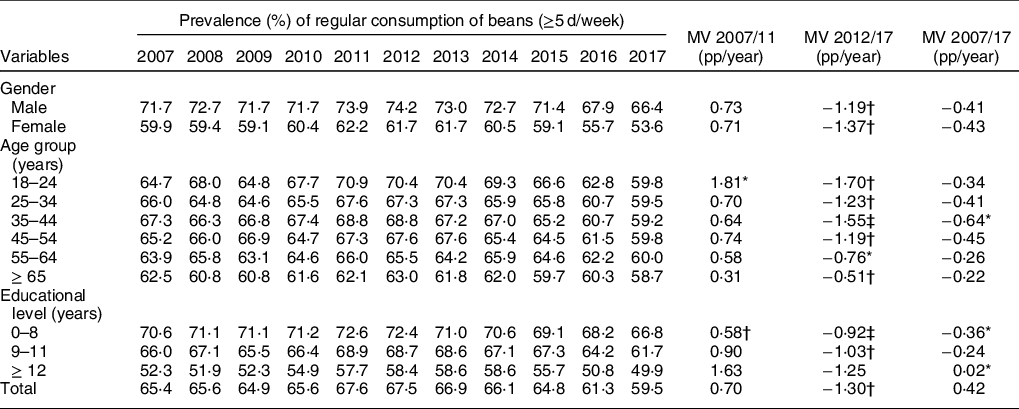
Vigitel, Surveillance System of Risk and Protective Factors for Chronic Diseases by Telephone Survey; MV, mean variation; pp/year, percentual points per year.
* P < 0·05.
† P ≤ 0·01.
‡ P ≤ 0·002.
§ Weighted percentage to adjust the socio-demographic distribution of the Vigitel sample to the distribution of the adult population of each city estimated for each year of the study.
|| P-values < 0·05 were considered statistically significant.
Regular consumption of beans held the highest prevalence in both halves of the analysed periods, followed by non-regular consumption (1–4 d/week) and finally by non-consumption of beans (Figs 1a, 1b and 1c). Estimated prevalence projections for bean consumption, calculated up to the year 2030, indicated that an inversion will likely to occur by 2025, whereas non-regular consumption of beans will become the most frequent in the population (48·2 %), reaching 56·1 % in 2030, while the prevalence of regular consumption of beans was projected at 38·6 % (Fig. 1a). Similar scenario was also projected for males (Fig. 1b) and females (Fig. 1c), but with different years of inversion and final magnitude of each indicator. Due to a higher magnitude of reduction in the period between 2012 and 2017 for females, the inversion between the indicators of weekly frequency of consumption was predicted for 2022, while for males it is expected to happen in 2029 (Figs 1b and 1c). Finally, an increase in the prevalence of non-consumption was also projected, reaching 3·7 % in males and 6·7 % in females in 2030.
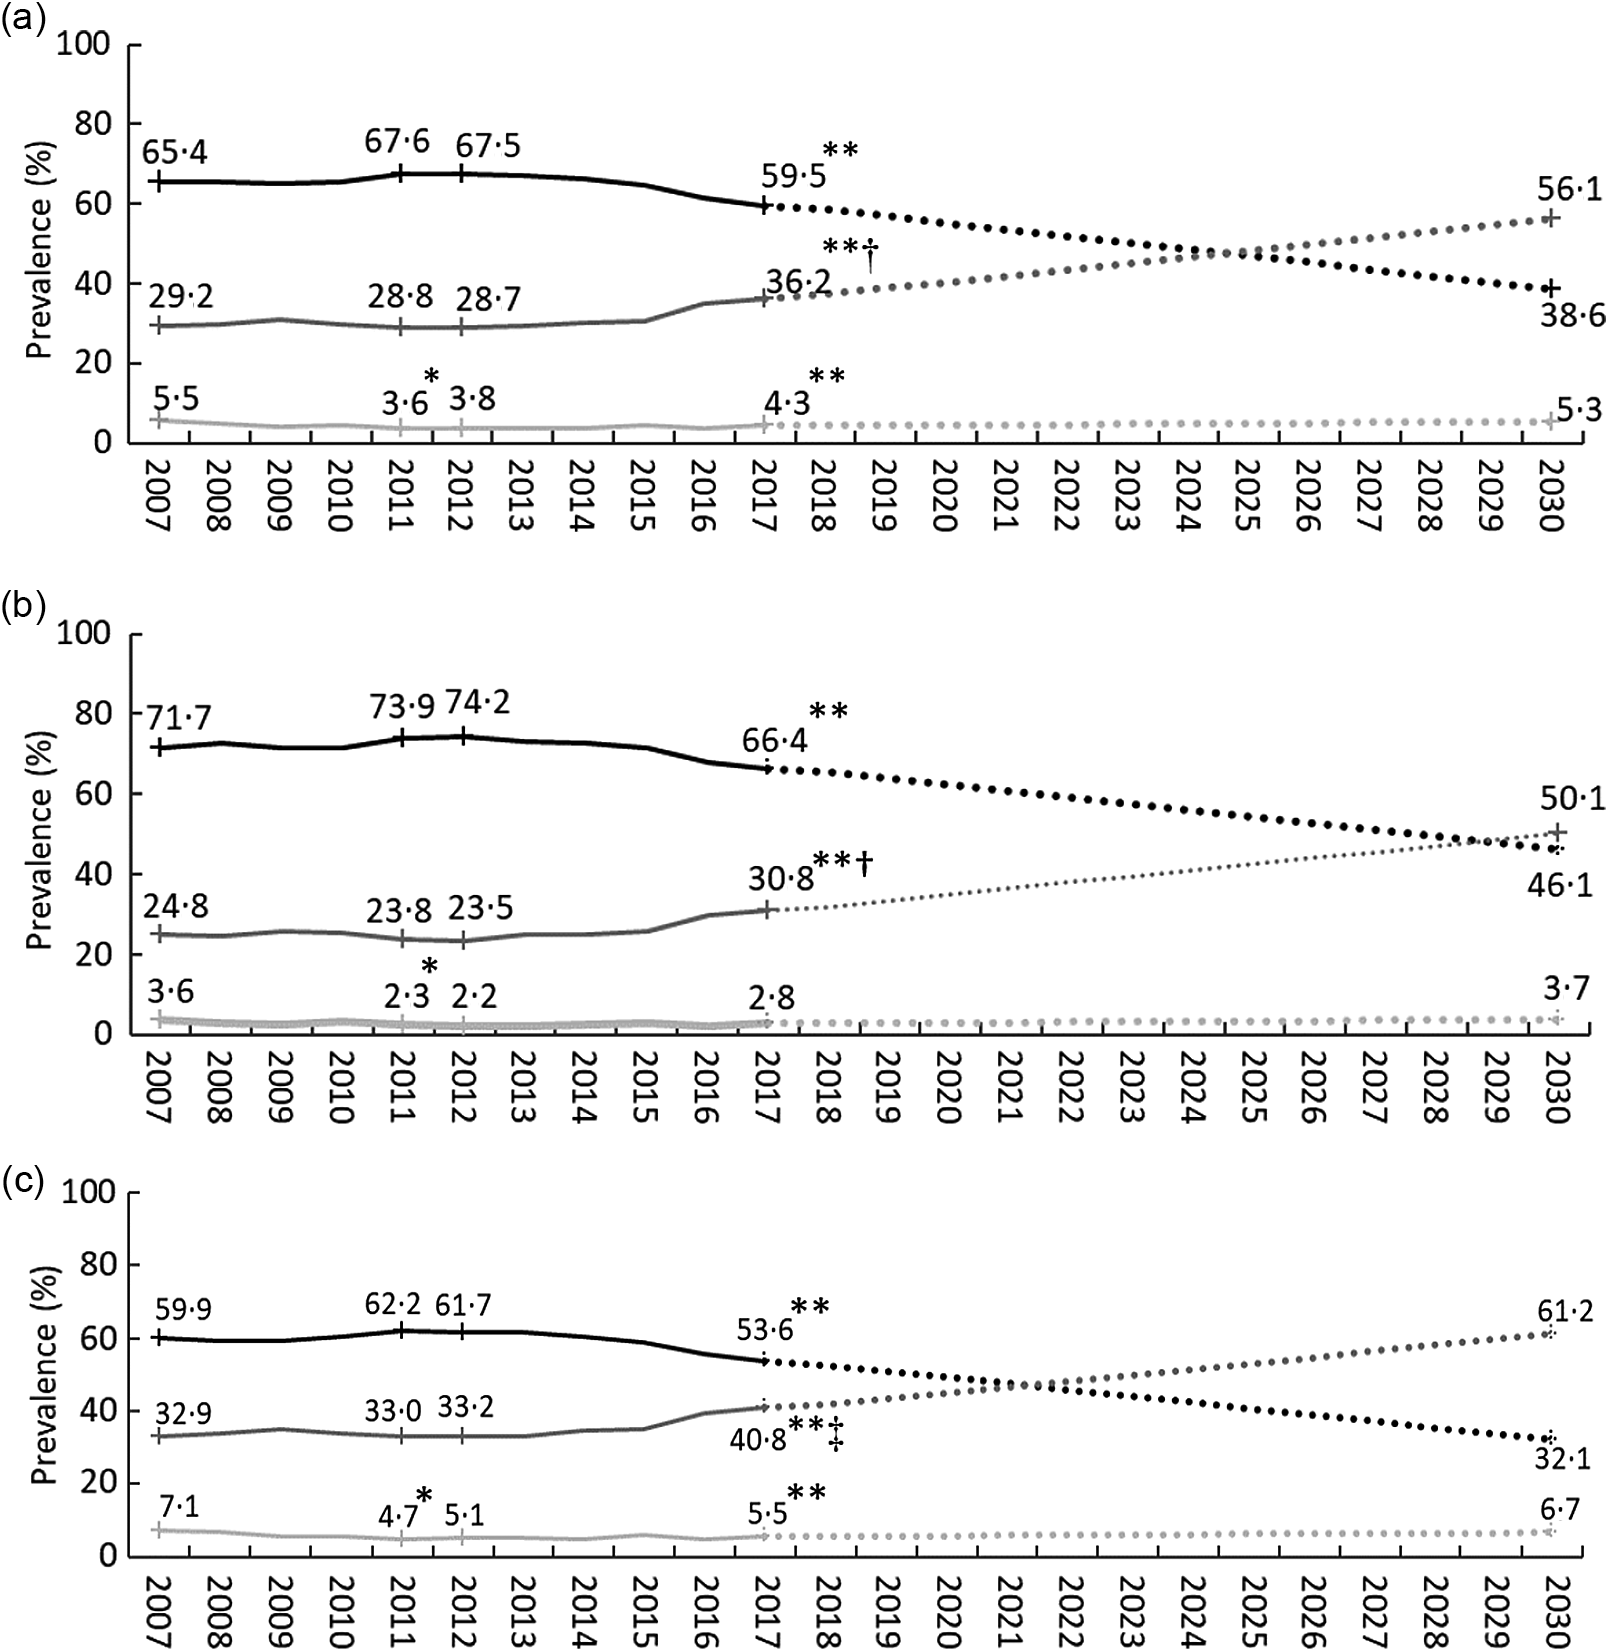
Fig. 1 Trends and estimated prevalence projection‡ (%) of weekly bean consumption among the adult population (a), males (b) and females (c) from Brazilian capitals and Federal District. Vigitel, Brazil, 2007–2030. ![]() , 5-7 days/week;
, 5-7 days/week; ![]() , 1-4 days/week;
, 1-4 days/week; ![]() , non-consumption;
, non-consumption; ![]() , Est. Prev. 5-7 days/week;
, Est. Prev. 5-7 days/week; ![]() , Est. Prev. 1-4 days/week;
, Est. Prev. 1-4 days/week; ![]() , Est. Prev. non-consumption
, Est. Prev. non-consumption
Discussion
Important changes in the traditional dietary pattern in Brazil were identified based on information systematically collected with adults for over a decade. There were an important downward trend in the frequency of consumption of beans in the country, especially in the recent analysed period. From 2012 onward, reductions in the prevalence of regular consumption of beans (≥5 d/week) were observed in all population strata. Greater reduction was observed among women. Magnitude of reduction was also inversely associated with age and directly with educational level. Estimated projections point out that from 2028, most Brazilians adults will not consume beans regularly. Among women, this inversion is likely to occur 3 years earlier (in 2025) and among men in 2030. At the same time, the prevalence of non-consumption of beans increased and is projected to reach 5·3 % of the adult population of all the state capitals and the Federal District in 2030.
The understanding of this scenario lies on a shift in consumption from traditional foods to processed and ultra-processed foods. The NOVA food classification system employed on the Brazilian Dietary Guidelines divides foodstuffs into four groups based on the extent, nature and purpose of food processing: Group (1) Unprocessed (Fresh) and minimally processed foods, Group (2) Processed culinary or food industry ingredients, Group (3) Processed food products; and Group (4) Ultra-processed food products (11). Processed products are whole foods preserved with salt, sugar or oil or by other methods such as smoking or curing. Ultra-processed food products consider industrial formulations mostly or entirely made from industrial ingredients containing little or no whole foods. Most of them are often termed ‘fast’ foods or convenience foods(Reference Monteiro, Cannon and Lawrence15,Reference Monteiro, Levy and Claro16) . Beans are included in Group 1, and the downward trend of regular consumption of beans up to 2030 observed in our results can contribute to integrate a body of evidence that indicate the loss of importance of basic and traditional foods in the Brazilian diet, in which ready-to-eat or ready-to-heat ultra-processed foods (such as breads, sausages, biscuits, soft drinks and ready meals) are displacing unprocessed/minimally processed foods (including beans) and processed culinary ingredients(Reference Monteiro, Levy and Claro3,Reference Monteiro, Levy and Claro16,17) .
The recent HBS 2017–2018 revealed, based on data of food purchases for household consumption, a decrease in the relative share (% of total dietary energy) of unprocessed and minimally processed food group and of processed culinary or food industry ingredients, along with an increase of processed and ultra-processed food groups for household consumption and by income level(10). The decrease in the relative contribution between the first and the fifth quintile of family income occurred for beans (5·4 %–3·4 %) and rice (its complement; 20·1 %–10·9 %) (but not for fruits (1·8 %–3·9 %)), while the opposite occurred for cakes, sweets, sugary drinks, soft drinks, breads, chocolates, prepared meals and pizza (arise of nearly 200 %)(10). This consumption pattern reinforces our data regarding the reduction in the consumption of traditional foods, such as beans, over the consumption of ultra-processed items.
Another study also conducted with Vigitel data set identified reduction in the prevalence of regular bean consumption(Reference Velásquez-Meléndez, Mendes and Pessoa18). Since Vigitel’s weighting methodology has changed in 2013 (also affecting estimates from previous year)(19), our analysis is important not only to complement but also to update this initial study. Thus, our results increase the number of years in the analysis and include new indicators (non-regular consumption and non-consumption) and a different proposal of data analysis (by their annual average rate of change in the indicator), as well as their forecasting up to 2030 for the total population and by gender. It should be kept in mind that due to this update of Vigitel’s methodology, the reduction trend identified in previous study(Reference Velásquez-Meléndez, Mendes and Pessoa18) in the initial years of the system was not observed in our analysis, in which a significant reduction was observed only in recent years.
Vigitel’s data set does not allow the identification of food consumption on specific days of the week. Evidences indicate a worst diet quality over the weekends in comparison with the days of the week(Reference Haines, Hama and Guilkey20–Reference Rothausen, Matthiessen and Andersen22) and also for the Brazilian population in which the consumption of beans is specially sensitive to weekends(Reference Monteiro, Hassan and Estima23). It is worth mentioning that the main indicator analysed already allows some freedom – as only 5 days of consumption are required. Thus, the change here observed transcends simple intraindividual variation between week and weekend days, reflecting real changes in consumption patterns. Important trends also affect food consumption during the studied period, with the increase in consumption away from home being among the most important ones. Data from 2008 to 2009 HBS indicated a significant increase of food share away from home in the total food expenses, especially among middle- and upper level of income and of schooling of the head of the household, in a way that each 10 % increase in the mean per capita income led to a 3·5 % increase in the share of food consumed away from home among Brazilians(Reference Claro, Baraldi and Martins24). Consumption outside the home may contribute for a reduction of food quality and for the deterioration of a healthy dietary pattern(Reference Bowman and Vinyard25–Reference Bhutani, Schoeller and Walsh27), with potential harmful effects on health at short and medium term, such as obesity(Reference Bhutani, Schoeller and Walsh27).
Although evidence suggests an economic advantage in meals prepared at home in comparison with its substitution for ultra-processed foods (due to the lowest price per calorie of the first one) – highlighting bean and rice as an economic alternative for the adoption of a healthier food practice(Reference Claro, Maia and Costa28) – a recently published study analysing data from 1995 to 2030 indicated that this scenario has been changing unfavourably to the consumption of healthy foods(Reference Maia, Passos and Levy29). Even though no data on the perception of consumers on this price trend are available, this might constitute an important influence on the reduction of consumption observed among our results, since it impacts not only the own price of beans but also the price of complementary items (such as rice) and potentially substitutes (such as ready to eat ultra-processed items).
Besides, the harvest of fresh foods is variable due to climatic issues and land availability and has direct impact on the price of these products in Brazil, since the government abdicated the formation of regulatory stocks to keep a steady price level in the market. In addition, beans compete to soya and maize regarding plantation area. Since these commodities have high demand internationally (due to their use in the production of biofuel, animal feeding and specialy of ultra-processed foods), they end up pressuring farmers to abandon bean plantations at the expense of more profitable crops. Thus, from the latter analysed period in the present study, the price of beans showed great fluctuations especially in the year of 2012/2013 and 2015/2016 with a mean arousal of 30 % in their final price, as reported in the newspapers at the time(30,31) , and this might have influenced the reduction in bean consumption in the second analysed period (2012–2017).
Availability, access and place for food sale, along with quality and variety of foods, are also important environmental factors in the determination of food consumption(Reference Duran, Almeida and Latorre32). The greater availability of places selling healthy food contributes to a lower consumption of unhealthy food and a better dietary pattern in populations(Reference Black, Moon and Baird33). Evidence demonstrated the relation between supermarkets and ultra-processed products acquisition in Brazilian population due to the smaller price of products and convenience(Reference Machado, Claro and Canella34,Reference Machado, Claro and Martins35) . According to the Brazilian Supermarket Association, the number of Brazilian food self-service stores increased by 7·3 % in the country, between 2012 and 2018(36), which may also have influenced the reduction in the prevalence of bean consumption observed in the latter analysed period of our results (2012–2017). Public policies and acts should consider facilitators and barriers sustained by the food system’s structure(Reference Glanz, Bader and Iyer37,Reference Hawkes, Smith and Jewell38) aiming to create healthy food environments to increase decision-making power by consumers, based on better access to information, encouraging purchasing at sites specialised in selling healthy foods, especially those from the family agriculture items, guaranteed by initiatives like the zoning policies. Moreover, the WHO recommends the implementation of subsidies as well as nutrition education to increase the intake of fruits and vegetables as a global strategy on diet aiming at the prevention and control of NCD(6,39) .
From a systemic perspective, beans represent not only a marker of a healthy eating but also a core of traditional dietary pattern all over the country. However, beyond beans, our results offer an evidence of the weakness of a traditional food culture. In a wider spectrum, it may represent the loss of culinary diversity and the decline of family time during meals(Reference Monteiro, Levy and Claro3). Facing the dynamics of everyday life, the globalised food system offers convenience on fast food products with long or very long shelf-lives, often relatively devoid of perishable nutrients, or even practically imperishable(Reference Monteiro, Levy and Claro3). Appropriate food choices explore dimensions related to commensality as the need to develop, exercise and practice culinary skills (expressed in the knowledge sharing between different generations and the perpetuation of a food culture)(11). In addition, there are several environmental factors that also influence consumers food choice such as price, availability and access to foods, the rapidity in the consumption of no-cook meals and the aggressive advertising and marketing of brands(Reference Monteiro, Levy and Claro3,Reference Duran, Almeida and Latorre32,Reference Smith, Kelly and Yeatman40) . In a sense that, basic and traditional foods are being replaced by the convenience of ultra-processed food products(Reference Monteiro, Levy and Claro3,Reference Monteiro, Cannon and Lawrence15–17,Reference Maia, Passos and Levy29) . The main outcome of this shift in consumption is the reduction in food quality and the deterioration of healthy/traditional/habitual and cultural dietary patterns(Reference Bowman and Vinyard25–Reference Bhutani, Schoeller and Walsh27).
Temporal analysis studies allow comprehending changes in dietary behaviour, and forecasting future scenarios, contributing to guide preventive actions in public health nutrition. It highlights the importance of nutrition policy to redeem the healthy and traditional dietary patterns, the need to stimulate appropriate living spaces at work environments, schools and any other places to favour eating meals prepared at home (but consumed away from home), as well as the need to empower individuals regarding healthier food choices on as many days of the week as possible, especially in an increasingly growing obesogenic environment.
The results of the present study also suggest that monitoring trend in the composition of the diet referring to fresh and minimally processed items might be relevant as the increase in the consumption of ultra-processed products may impact the consumption of fresh and minimally processed foods subgroups in different ways, possibly affecting traditional items more intensely than non-traditional ones, increasing its harmful effects. Extending such investigation to other countries will contribute to the understanding of this hypothesis.
The present study has limitations. Self-reported information was obtained by telephone interview using a proper questionnaire for large population samples (572 675 interviews per year), which include closed, short and objective questions contributing to its simplicity and low cost. On the other hand, it does not allow detailed quantitative and qualitative data evaluation. As a positive aspect, although self-reported food consumption is prone to inaccuracies, such as under-reporting, Vigitel’s questionnaire presented good reproducibility and adequate validity of food and beverage consumption indicators(Reference Monteiro, Moura and Jaime41–Reference Moreira, Claro and Felisbino-Mendes43). Similar method is adopted by other health surveys, namely the Behavioural Risk Factor Surveillance System(Reference Remington, Smith and Williamson44) and the WHO STEPwise approach(45), and all offer great value to ground the identification of dietary patterns and diet-related associations which, therefore, contributes to nutrition policies. Furthermore, the present study evaluated a large and representative sample of the Brazilian adult population of all state capitals and the Federal District.
Conclusion
Brazilian traditional dietary pattern has been changing unfavourably for over a decade. Adults are reducing the weekly consumption of beans and excluding it from their diet. Estimated projections points out that regular consumption of beans is likely to be replaced as a modal consumption among adults in Brazil in 2025 and also that non-consumers will likely increase up to 2030.
Acknowledgements
Acknowledgements: This work was supported by the Coordenação de Aperfeiçoamento de Pessoal de Nível Superior – Brasil (CAPES; finance code 001). Financial support: This research received no specific grant from any funding agency, commercial or not-for-profit sectors. Conflicts of interest: The authors have no conflicts of interest. Authorship: The authors F.S.G. and R.M.C. carried out the conceptualisation of the study, performed the formal analysis and writing – original draft preparation. The authors F.S.G., E.G.M., L.L.M. and R.M.C. participated in validation, visualisation and writing – review and editing of the manuscript. All authors approved the final version to be published. Ethics of human subject participation: The current study was conducted according to the guidelines laid down in the Declaration of Helsinki, and all procedures involving research study participants were approved by the National Commission of Ethics in Research for Human Beings of the Ministry of Health (CAAE: 65610017.1.0000.0008). Verbal informed consent was obtained from all subjects/patients. Verbal consent was witnessed and formally recorded. Data are freely available for public access and use and do not allow participants´ identification.
Supplementary material
For supplementary material accompanying this paper visit https://doi.org/10.1017/S1368980020005066


