The use of anthropometry as an indicator of nutritional and health status of adults is well established and strongly recommended by the WHO( 1 ). The BMI is an indicator of overall adiposity (fatness) or energy reserve in the human body. Although adult nutritional status can be evaluated in many ways, BMI is the most widely used because it is inexpensive, non-invasive and thus suitable for large-scale population surveys( Reference Lohman, Roche and Martorell 2 – Reference James, Mascie-Taylor and Norgan 4 ). It is not only a sensitive indicator of nutritional status but also of the socio-economic condition of the population, especially the adult populations in developing countries( Reference Ferro-Luzzi, Sette and Franklin 3 , Reference Shetty and James 5 – Reference Khongsdier 7 ). BMI<18·5 kg/m2 is widely used as a practical measure of chronic energy deficiency (CED), defined as a state of ‘steady underweight’ in which an individual is in energy balance irrespective of a loss of body weight or energy stores( Reference Ferro-Luzzi, Sette and Franklin 3 , Reference Khongsdier 8 ). Such a ‘steady’ underweight has been associated with morbidity and other physiological and functional impairments( Reference Nube, Asenso-Okyere and van den Bloom 6 , Reference James, Ferro-Luzzi and Waterlow 9 ). Low BMI was shown to be associated with increased morbidity and mortality in clinical settings and in several large epidemiological studies( Reference Aune, Sen and Prasad 10 – Reference Kelly, Lilley and Leonardi-Bee 14 ). Although, in general, height and weight appear to be simple measures, procurement, maintenance and calibration of the measuring instruments are necessary. The calculation of BMI requires literacy and numeracy skills to a certain extent. In many field settings, although warranted, it could be difficult to obtain accurate height and weight measurements, particularly in situations where time and resources are scarce.
Another simple anthropometric measure, the mid-upper arm circumference (MUAC), can also be efficiently used to determine poor nutritional status in adults( Reference James, Mascie-Taylor and Norgan 4 , Reference Dorlencourt, Priem and Legros 15 – Reference Bose, Chakraborty and Mitra 17 ). It is a measure of the circumference of the upper arm at the midpoint between the olecranon and acromion processes( Reference Gibson 18 ). Practically, it is a simpler measure than BMI, requiring minimum equipment (i.e. only a standardized tape), and was shown to predict morbidity and mortality as accurately as a deficit in weight in young children( Reference Briend, Garenne and Maire 19 ). Low MUAC was also associated with increased risk of adverse clinical outcomes including mortality in HIV-infected patients( Reference Liu, Spiegelman and Semu 20 – Reference Gustafson, Gomes and Vieira 22 ) and the elderly( Reference Wijnhoven, Schilp and van Bokhorst-de van der Schueren 23 , Reference Allard, Aghdassi and McArthur 24 ), and with morbidity in other populations( Reference Chakraborty, Bose and Bisai 25 – Reference Lemmer, Badri and Visser 27 ). It was recommended as a substitute for BMI when rapid screening of an adult population was required( Reference James, Mascie-Taylor and Norgan 4 ). Especially when individuals tend to have smaller amounts of subcutaneous fat, changes in MUAC are more likely to reflect changes in muscle mass with a higher precision( Reference Gibson 18 ). In such conditions, MUAC measurements can be useful as an indicator of protein–energy malnutrition or a state of starvation. It is a useful nutritional indicator during pregnancy in particular, as BMI reflects the body mass of the mother including the fetus at this time( Reference Fakier, Petro and Fawcus 28 ). MUAC is also a convenient measure in hospitalized patients who cannot stand erect( Reference Benítez Brito, Suárez Llanos and Fuentes Ferrer 29 ). The measurement of MUAC offers several advantages. It can be taken with a simple tape measure and does not require any other calculation. It also requires neither highly trained personnel nor expensive or delicate equipment.
Several previous investigations showed the interrelationships of socio-economic status, BMI, CED and morbidity among different populations( Reference Khongsdier 8 , Reference Campbell and Ulijaszek 30 – Reference Mahmud Khan, Hotchkiss and Berruti 39 ). Numerous studies found that MUAC was highly correlated with BMI in adult populations( Reference Singla, Sharma and Mohan 26 , Reference Mazicioglu, Yalcin and Ozturk 40 – Reference Bose 44 ). However, there exist distinct ethnic differences in the pattern of body fat deposition( Reference Bose 45 ) and the relationship between overall adiposity (measured as BMI) and regional adiposity (measured by body circumferences like MUAC and skinfolds) varies across ethnic groups( Reference Bose 45 , Reference Tang, Chung and Dong 46 ). At same level of BMI, there were significant ethnic differences in regional adiposity and body composition measures, such as percentage body fat( Reference Deurenberg, Yap and van Staveren 47 , Reference Deurenberg, Deurenberg-Yap and Guricci 48 ). Similarly, although MUAC<23 cm has been recommended to identify the state of undernutrition( Reference James, Mascie-Taylor and Norgan 4 ), this value may not be the most appropriate cut-off point in all ethnic groups and populations even within the same country. For instance, a study from Nigeria( Reference Olukoya 49 ) reported that an MUAC cut-off point of 23 cm was optimal for the north of the country, while a 24 cm cut-off point was more appropriate for the south. Thus, there is a need to establish ethnic- and/or region-specific cut-off points of MUAC. However, the efforts made to find appropriate cut-off values of MUAC to correspond with CED status (BMI<18·5 kg/m2) are limited, especially in India. In two such studies, MUAC was shown to be a suitable and simpler alternative to BMI in identification of CED and reported morbidity status among the Oraon tribal people( Reference Chakraborty, Bose and Koziel 50 ) and adult male non-tribal slum dwellers( Reference Chakraborty, Bose and Bisai 25 ) in the eastern part of India. These studies nevertheless emphasized the necessity for further validation studies with larger sample sizes before this cut-off point can be recommended for use among these populations. Similar studies are needed also among women, to determine whether the cut-off point of MUAC<22 cm recommended by James et al. ( Reference James, Mascie-Taylor and Norgan 4 ) is appropriate for them or if a more appropriate and efficient cut-off point can be established. However, all these studies were conducted among adult males but not on females. In view of this and considering the huge population variation in India, the present investigation was carried out to explore the possibility for a statistically appropriate cut-off point of MUAC to identify the state of undernutrition (defined by BMI) among adult Bengalee male and female slum dwellers of Midnapore, West Bengal, India.
Methods
Participants and setting
The current cross-sectional study was carried out in an urban slum in Midnapore town approximately 130 km from Kolkata, the capital of West Bengal State in the eastern part of India. Municipal authorities, community leaders and local community organizations were informed about the study before commencement. They were requested to campaign in the slum about it. After a few days of such campaigning the actual data collection was initiated. No strict statistical sampling of individuals could be applied to collect data due to operational difficulties in the field, as mentioned in other studies( Reference Khongsdier 7 , Reference Chakraborty, Bose and Koziel 50 ). Besides, the entire slum area was covered for the study, except a very few households (five), which were always found closed during the study period. The houses were situated in a linear fashion from one end to the other of the slum areas. During the total period of study, each household was approached physically by one of the authors (P.D.) from one direction to the other. This direction of moving for recruitment of new participants was linear, starting from one end of the slum to the other and was never reversed for any new enrolment. The adult member(s) who were present at the time of such visit were invited to participate. Attempt was made to include all those adult males and females aged 18 years or above who agreed to participate. Apparently healthy individuals, who were reportedly free from any acute illness and were self-satisfactorily under their normal day-to-day work-schedule at the time of measurements, were enrolled. Besides, any self-reported illness during the last one month and one year before the date of measurement was recorded. Those who suffered serious illness or underwent recent surgery and developed an infirmity due to that were not included. Each participant received an explanation about the objective of the research, informed consent was obtained verbally before collection of data and the participants put their signature or left thumb impression (if non-literate) on the data sheet. The participants were included without any possible sampling bias due to personal choice of the researchers. On each day of work, the field worker visited the slum at about 09.00 hours and would stay until about 17.00 hours. Most of the male workers were measured during the afternoon when they usually would come for lunch at home. The women were measured mostly during the morning and evening or late afternoon. It was left merely to the chance to get eligible participants in their households at the time of the study visit. Measurements were done either on the same day as the verbal introduction or on any other day as per the participant’s convenience by fixing a prior appointment. However, no household was visited twice for new enrolment of participants. Almost every participant was interviewed and measured at her/his respective household. In some cases, due to logistical problems, participants were taken to a convenient place such as a community centre for measurement. Overall response rate was nearly 80 %. Altogether, 1004 individuals (508 females) aged 18–84 years were included in the study from 578 households. Individuals aged ≥70 years (twelve males, thirteen females) and individuals who weighed more than 85 kg (four males, one female) were also excluded as extremes. After further exclusion of the data for missing values, the final sample size for the main analyses was 955 (488 females) belonging to predominantly Bengali-speaking Hindus. Most participants were engaged in jobs carrying low socio-economic rank, such as rickshaw puller, sweeper, day labourer, housekeeper, etc. The general hygienic condition around the habitat was noticeably poor. The sanitation, sewerage and household structures were the silent but definite indicators of poverty and underprivileged quality of life. Ethical guidelines of the Helsinki Declaration were strictly adhered to( Reference Goodyear, Krleza-Jeric and Lemmens 51 ).
Socio-economic status
Income, educational level and occupation were recorded to elucidate the socio-economic condition of the participants. Total monthly family income was recorded in Indian currency (Indian rupees; INR) and then was divided by the number of family members to get monthly per capita income (MPCI). Educational level was recorded as the standard of class for which an individual at least appeared in examination. The following educational categories were identified: non-literate, can sign only (including below the third standard), primary (from the third up to the seventh standard), secondary (from eighth to the eleventh standard), higher secondary (from twelfth up to appearing for undergraduate study) and graduate or above. The exact reported principal occupation of each individual was also recorded. For summarization in the present study, very similar varieties were grouped into one category. For instance, many types of wage labour were put into the single group of ‘labour’ in general.
Anthropometry and nutritional status
One of the authors (P.D.) performed anthropometric measurements following the standard methodology( Reference Lohman, Roche and Martorell 2 ). Height and MUAC were recorded to the nearest millimetre and weight to 500 g. BMI was computed as weight in kilograms divided by the square of height in metres. Nutritional status was determined using the WHO international guidelines( 1 ) as: CED (BMI<18·5 kg/m2), normal (BMI=18·5–24·9 kg/m2), overweight (BMI=25·0–29·9 kg/m2) and obese (BMI≥30·0 kg/m2); as well as with the Asia Pacific guidelines( 52 ) as: CED (BMI<18·5 kg/m2), normal (BMI=18·5–22·9 kg/m2), overweight (BMI=23·0–24·9 kg/m2) and obese (BMI≥25·0 kg/m2).
Statistical analyses
Descriptive statistics of mean, sd and 25th, 50th and 75th percentile values were calculated to describe the characteristics of the sample. Multiple linear regression analysis was undertaken to assess the associations between age, MUAC and BMI. Receiver-operating characteristic (ROC) curve analysis was performed to determine the best MUAC cut-off point to identify CED status most efficiently using two categories of BMI values, i.e. CED and non-CED. Sensitivity (SENS), specificity (SPEC), positive predictive value (PPV) and negative predictive value (NPV) were computed to identify these cut-off points in males and females, respectively. Three groups for each sex were created based on the ROC curve results: MUAC<23·0 cm, MUAC=23·0–24·9 cm and MUAC≥25·0 cm in males; and MUAC<22·0 cm, MUAC=22·0–23·9 cm and MUAC≥24·0 cm in females. Contingency χ 2 tests were used to study the relationships between these MUAC groups and CED categories. All statistical analyses were performed using the SPSS version 10 and MedCalc statistical software packages. Results were considered significant at P<0·05.
Results
Although anthropometric data were analysed for 955 adult slum dwellers (488 females), information on the socio-economic status (i.e. education, occupation and family income) were available for 999 participants (506 females). The distribution of the participants according to MPCI, educational level and occupation is shown in Table 1. The literacy rate among males and females was 77·1 and 52·0 %, respectively. Of those literate, 2·2 % of males and 0·8 % of females could only sign their names or read up to third standard, 25·6 % of males and 23·1 % of females had primary education and 32·0 % of males and 21·7 % of females had completed secondary education. Only 7·9 % of males and 2·2 % of females were a graduate or above. Regarding occupation, about 55 % of males were labourers, rickshaw pullers, construction workers, drivers of heavy vehicles and street hawkers. The most frequent were the labourers (29·0 %). Very small numbers had low-paid service jobs (5·9 %). More than half (53 %) of the females were homemakers only, taking care of their own families and households. Another 32·6 % were engaged as low-paid housemaids, cleaning the households and utensils of employers. The mean total monthly family income and MPCI were INR 7239·2 (sd 5070·9) and 1602·6 (sd 1179·0), respectively. The minimum and maximum MPCI were INR 186 and 10 615, respectively, and the 25th, 50th and 75th percentile values were INR 834, 1250 and 1750, respectively. Based on the quartile values, the MPCI was categorized into four groups. The highest percentages of males (33·7 %) and females (43·1 %) belonged to families with MPCI of INR 1000 or below. About 60 % of males and 66 % of females lived in families with MPCI below INR 1501.
Table 1 Socio-economic status of the adult slum dwellers from Midnapore town, West Bengal, India, April 2015–March 2017

MCPI, monthly per capita income; INR, Indian rupees.
In the case of males, age showed no significant linear effect on BMI (F=2·85, P=0·09) but a quadratic negative effect (F=3·62, P<0·05), indicating a small but significant decrease of BMI at a higher age. On the other hand, MUAC showed no such phenomenon of decrease at older age. However, in linear regression analysis, MUAC significantly predicted BMI independently of age (t=19·4, P<001). Partial correlation of MUAC with BMI was 0·71 (P<0·001) after allowing for height and age in males. In females, age had both positive linear (P<0·05) and negative quadratic (P<0·001) effects on BMI but only a quadratic effect (P<0·001) on MUAC. Linear regression showed that MUAC significantly predicted BMI independently of age (t=27·2, P<001) in females as in males. Partial correlation of MUAC with BMI was 0·79 (P<0·001) after controlling for age and height age in females (results not shown).
The descriptive statistics of the sample by mean, sd, minimum and maximum, and 25th, 50th and 75th percentile values are presented in Table 2. The distribution of participants into different nutritional categories by BMI according to WHO guidelines is presented in Table 3. As per both guidelines, the prevalence of CED was 21 and 25 % in males and females, respectively. The prevalence of overweight and obesity together, and more particularly the prevalence of obesity, was much higher if the Asia Pacific guidelines were followed.
Table 2 Descriptive statistics of age and anthropometric variables among the adult slum dwellers from Midnapore town, West Bengal, India, April 2015–March 2017

MUAC, mid-upper arm circumference.
Table 3 Nutritional status, as assessed by BMI, of the adult slum dwellers from Midnapore town, West Bengal, India, April 2015–March 2017

CED, chronic energy deficiency.
Mean values for BMI at different levels of MUAC are shown in Table 4. As expected, mean BMI increased significantly from the lowest MUAC level to the highest in both sexes (males: F=169·2, P<0·001; females: F=290·6, P<0·001). The prevalence of CED increased significantly with the decrease in MUAC values in males (χ 2=116·2, P<0·001) as well as in females (χ 2=202·2, P<0·001). The prevalence of CED was highest (males: 45·9 %, females: 60·0 %) in the lowest MUAC level (males: <23·0 cm; females: <22·0 cm) and lowest (males: 2·4 %; females: 1·2 %) in the highest MUAC level (males: ≥25·0 cm; females: ≥24·0 cm). Females with MUAC<22·0 cm had 128 times higher odds of being CED than females having MUAC≥24·0 cm. Similarly, males with MUAC<23·0 cm had thirty-four times higher odds of being CED than the males with MUAC≥25·0 cm.
Table 4 Mean BMI and prevalence of chronic energy deficiency (CED) according to mid-upper arm circumference (MUAC) category of the adult slum dwellers from Midnapore town, West Bengal, India, April 2015–March 2017
Ref., reference category.
Males: mean BMI increased significantly (F=169·2, P<0·001 for BMI) and CED decreased significantly (χ 2=116·2, P<0·001) from the lowest to the highest MUAC category.
Females: mean BMI increased significantly (F=290·6, P<0·001) and CED decreased significantly (χ 2=202·2, P<0·001) from the lowest to the highest MUAC category.
* Adjusted for age.
Table 5 presents the SENS, SPEC, PPV and NPV, along with their 95 % CI, derived from the analyses of ROC curves of MUAC v. CED status (CED and non-CED). In the case of males, the area under the ROC curve was estimated to be 0·85 (se 0·02; 95 % CI 0·82, 0·88) and the Youden index was 0·605. It was observed that MUAC of 22·7 cm performed as the best optimal cut-off point to distinguish between CED and non-CED individuals, with SENS, SPEC, PPV and NPV values of 85·71, 74·80, 47·5 and 95·2 %, respectively. The ROC curve is presented in Fig. 1. In the case of females, the area under the ROC curve was 0·93 (se 0·01; 95 % CI 0·90, 0·94) and the Youden index was 0·72. The best performing cut-off was 21·9 cm with corresponding SENS, SPEC, PPV and NPV of 91·67, 79·89, 59·8 and 96·7 %, respectively. The ROC curve is presented in Fig. 2.
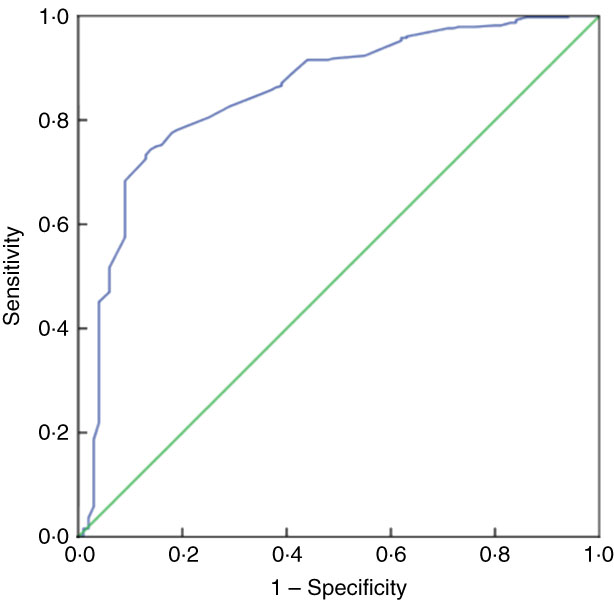
Fig. 1 (colour online) Receiver-operating characteristic curve of mid-upper arm circumference for detection of chronic energy deficiency status (determined using the WHO international guidelines(
1
) as BMI<18·5 kg/m2) in adult male (n 467) slum dwellers, Midnapore town, West Bengal, India, April 2015–March 2017. ![]() , plot of sensitivity v. (1 – specificity);
, plot of sensitivity v. (1 – specificity); ![]() , line of no discrimination
, line of no discrimination
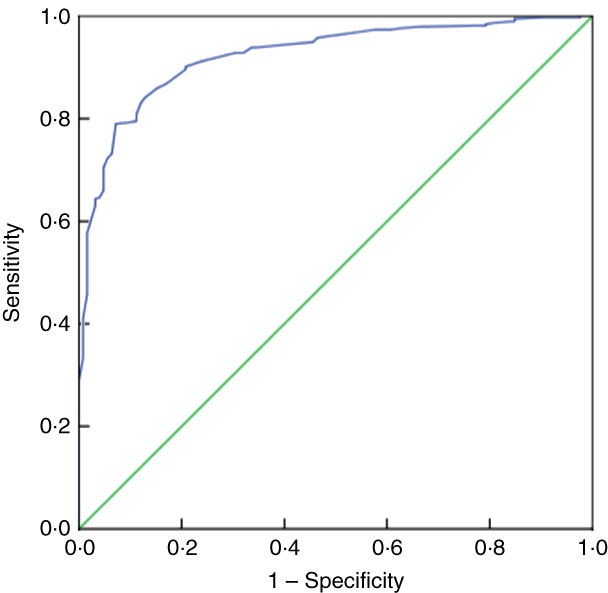
Fig. 2 (colour online) Receiver-operating characteristic curve of mid-upper arm circumference for detection of chronic energy deficiency status (determined using the WHO international guidelines(
1
) as BMI<18·5 kg/m2) in adult female (n 488) slum dwellers, Midnapore town, West Bengal, India, April 2015–March 2017. ![]() , plot of sensitivity v. (1 – specificity);
, plot of sensitivity v. (1 – specificity); ![]() , line of no discrimination
, line of no discrimination
Table 5 Sensitivity (SENS), specificity (SPEC), positive predictive value (PPV) and negative predictive value (NPV), along with 95 % CI, derived from analyses of receiver-operating characteristic curves of MUAC v. chronic energy deficiency status (determined using the WHO international guidelines( 1 ) as BMI<18·5 kg/m2), among the adult slum dwellers from Midnapore town, West Bengal, India, April 2015–March 2017

The best optimal MUAC cut-off point to distinguish between CED and non-CED individuals is highlighted in bold.
Discussion
MUAC has recently emerged as a useful tool for screening of undernutrition in adults( Reference Khadivzadeh 16 ). It correlates closely with BMI, is easier to measure and predicts poor outcome better( Reference Powell-Tuck and Hennessy 53 ), and was used to identify undernourishment in different ethnic groups( Reference Olukoya 49 , Reference Ferro-Luzzi and James 54 ). Although a universally applicable MUAC cut-off is yet to be established to screen undernutrition among adults, it is increasingly being used to assess nutritional status and determine eligibility for services in adults, especially among people with serious medical conditions like HIV and/or tuberculosis( Reference Bahwere, Deconinck and Banda 55 , Reference Tumilowicz 56 ). Many countries and public health programmes have established their own MUAC cut-offs, but there is limited evidence supporting these cut-offs to be optimal( Reference Tang, Chung and Dong 46 ).
The present study showed in both males and females that MUAC had a high correlation with BMI, even after controlling for age and height. MUAC of 22·7 cm in males and 21·9 cm in females were the most sensitive cut-off points to differentiate between CED and non-CED individuals. Using these cut-off points, it was observed that there was a significantly high prevalence of CED among the group of males with MUAC<23·0 cm and among the females with MUAC<22·0 cm. The same cut-off values, however, were also suggested in the pioneering study by James et al. ( Reference James, Mascie-Taylor and Norgan 4 ) and consequently recommended by the WHO to be used as the international standard to identify undernourished adult males and non-pregnant women, respectively( 1 ). Other studies which examined the association between low MUAC and low BMI (<18·5 kg/m2) among non-pregnant adults also found strong associations between these two measures, with statistically significant OR ranging from 13·9 to 28·8. All these studies used an MUAC cut-off of 23 cm( Reference Chakraborty, Bose and Bisai 25 , Reference Bisai and Bose 57 , Reference Gartner, Maire and Kameli 58 ). Moreover, Ferro-Luzzi and James( Reference Ferro-Luzzi and James 54 ) also suggested a cut-off of MUAC<22 cm for women and found a strong association with BMI<18·5 kg/m2, with a high OR of 21·2.
On the other hand, an MUAC of 24 cm was found suitable to identify CED in a study from southern India( Reference Rodrigues, Rao and Lena 59 ). Another study( Reference Chakraborty, Bose and Koziel 50 ) also showed that 24 cm, rather than 23 cm, was the best cut-off MUAC value to distinguish CED from non-CED among the Oraon tribal men in the eastern part of India. However, one of the limitations of that study was small sample size. A study( Reference Chakraborty, Bose and Bisai 25 ) among slum-dwelling men in India further claimed that 24 cm was the optimal MUAC for CED status (BMI<18·5 kg/m2). In view of these findings, it was thus proposed that an MUAC value of 24 cm could be utilized as the MUAC cut-off point for the determination of CED status, along with a higher frequency of morbidity, in these populations. Anatomically, the upper arm contains both subcutaneous fat and muscle. Thus, changes in MUAC can reflect a change in muscle mass and/or in subcutaneous fat, or both. It is also argued that in view of the relatively higher body fat content of South Asian people than of Whites at a similar level of BMI, a thicker layer of subcutaneous fat at a relatively lower BMI level (such as in CED) is possible in these populations( Reference Chakraborty, Bose and Bisai 25 , Reference Chakraborty, Bose and Koziel 50 ). Recently, a global study also proposed an MUAC cut-off of 24 cm for adult males and non-pregnant women( Reference Tang, Chung and Dong 46 ).
MUAC is a much simpler measure compared with BMI. Its use with appropriate population-specific cut-off points could have enormous public health implications, particularly with respect to primary health-care practices such as screening of CED and higher occurrence of morbidity at community level. The protocol for monitoring of the Integrated Management of Childhood Illness included MUAC because the WHO recommended an MUAC value of <11·5 cm as the screening value for acute malnutrition for children aged 6–60 months in community-based therapeutic feeding programmes( 60 ). However, the WHO did not include MUAC in its country-specific patient monitoring guidelines to support the Integrated Management of Adult Illness, partly due to non-availability of an appropriate universal MUAC cut-off. Lack of a single, universally accepted and widely applicable MUAC value for diagnosis of adult undernutrition impedes accurate estimations of the human and financial loss and health burden associated with adult undernourishment( Reference White, Guenter and Jensen 61 ). Establishment of standardized MUAC cut-offs for undernutrition among adults could immensely facilitate identification of appropriate beneficiaries having an increased health risk due to acute undernutrition. It could also facilitate the proper utilization of public health finances in a resource-constrained situation, as found in developing countries.
Conclusion
In conclusion, the present study recommends MUAC cut-offs of 23 cm and 22 cm to identify the undernourished status or CED as determined by BMI value of <18·5 kg/m2 in adult males and non-pregnant females, respectively. Although the current study in a way may seem to be attempting to weaken several previous scientific calls for the establishment of population-specific MUAC cut-offs rather than the same global values proposed by the WHO, it actually hints towards an urgent need to elucidate the appropriate MUAC cut-off and to assess its efficacy in identifying severe adult malnutrition with a very low BMI which may predict morbidity and infirmity. For this purpose, multicentre collaborative longitudinal studies will be of real importance and India could be the most appropriate place for them, owing to its huge ethnic diversity across highly varied ecological and sociocultural contexts.
Acknowledgements
Acknowledgements: The participants of the study are gratefully acknowledged. Financial support: This research received no specific grant from any funding agency in the public, commercial or not-for-profit sectors. Conflict of interest: None. Authorship: P.D. collected the data and wrote the methodology. A.K. organized the data for analysis. K.B. supervised the study and moderated the analysis and the draft manuscript. R.C. conceived the idea, designed the study, performed the analysis and wrote the final manuscript. Ethics of human subject participation: This study was conducted according to the guidelines laid down in the Declaration of Helsinki and all procedures involving human subjects were approved by Vidyasagar University PhD Committee in Anthropology as per the standard protocol. Verbal informed consent was obtained from all subjects. Verbal consent was witnessed and formally recorded.