Poor dietary intake has been identified as the leading risk factor of US disease burden( 1 ). An upstream contributor to this dietary behaviour is the local food environment( Reference Morland 2 ) and within this landscape, small and non-traditional food stores abound( Reference Block and Kouba 3 – Reference Zenk, Powell and Rimkus 5 ). Small and non-traditional food stores are comprised of retail outlets such as convenience stores, corner stores, dollar stores, pharmacies and gas stations, serving as some of the most frequented food venues as well as convenient sources for in-between supermarket visits( Reference Richardson, Boone-Heinonen and Popkin 4 , Reference Caspi, Lenk and Pelletier 6 – Reference Dannefer, Williams and Baronberg 10 ). Such stores are also known for offering an abundance of high-energy, low-nutrient foods that customers purchase( Reference Caspi, Lenk and Pelletier 6 , Reference Stern, Ng and Popkin 11 – Reference Kiszko, Cantor and Abrams 14 ). Consequently, there is a need to further understand the contributing role of small and non-traditional food stores in shaping US dietary health.
Over the past two decades, evidence has consistently identified disparities in the healthfulness of local food environments by race/ethnicity and socio-economic position( Reference Morland 2 , Reference Richardson, Boone-Heinonen and Popkin 4 , Reference Powell, Slater and Mirtcheva 15 – Reference Block, Scribner and DeSalvo 19 ). These disparities are increasingly recognized to be non-random and shaped by an unequal distribution of power and resources that follow social identity groups and economic entities with varying market and political influence( Reference Zenk, Thatcher and Reina 20 , Reference Rosenberg and Cohen 21 ). Disparities have primarily been identified at the community level of the local food environment, or the spatially related aspects of food sources within a neighbourhood (e.g. density of small and non-traditional food stores)( Reference Glanz, Sallis and Saelens 22 ). Disparities have also been identified at the consumer level (i.e. what is encountered within a store)( Reference Glanz, Sallis and Saelens 22 ), which involves features increasingly linked with health behaviours and outcomes (e.g. customer purchasing, weight status)( Reference Martin, Havens and Boyle 9 , Reference Ruff, Akhund and Adjoian 12 , Reference Caspi, Lenk and Pelletier 23 – Reference Gustafson, Lewis and Perkins 27 ). However, limited research has examined whether consumer-level disparities exist among small and non-traditional food stores. In addition, we are unaware of any prior investigations that examined whether inequalities exist across more structural store factors (e.g. refrigeration availability for produce, relationships with suppliers), which influence consumer-level experiences around product availability, prices and marketing. Examining whether differences in consumer-level features map onto differences in store resources and capabilities for healthful changes could help to better inform interventions( Reference Gittelsohn, Rowan and Gadhoke 8 , Reference Bodor, Ulmer and Dunaway 28 ) aimed at improving healthy food availability in these small and non-traditional venues( Reference Singleton, Li and Duran 29 – Reference Cavanaugh, Mallya and Brensinger 33 ).
In the current investigation, we examined consumer-level features and the resources and capabilities of small and non-traditional food stores across two social determinants that reflect unjust imbalances in power, means and capital. Specifically, we examined store features across: (i) the racial segregation of a store’s residential neighbourhood; and (ii) a store’s ownership status (i.e. corporate-, franchised- or independently owned). Racial residential segregation is a neighbourhood living condition that reflects a long and persistent history of institutional racism in the USA (i.e. the unequal allocation of resources, influence and opportunity based on race and favouring groups identified as White)( Reference Riley 34 , Reference Schulz, Williams and Israel 35 ). Institutional policies beginning in the 19th century forced the residential separation of races, which aimed to insulate White Americans from social interactions with anyone not considered White( Reference Williams and Collins 36 ). While a number of studies have previously examined consumer-level features of the local food environment by similar indicators of racism( Reference Baker, Schootman and Barnidge 37 – Reference Lewis, Sloane and Nascimento 41 ), few have examined such features specifically across small and non-traditional food stores( Reference Block and Kouba 3 , Reference Zenk, Powell and Rimkus 5 ). Furthermore, it remains unknown whether variation in these stores by racial segregation exists among consumer-level features beyond availability (e.g. marketing).
In addition, whether a store operates through a larger corporate infrastructure v. relatively independently is a marker of the ways modern capitalism intersects with the local food environment. Stores that are corporately owned and/or franchised can have access to notable resources and infrastructure( Reference Ang 42 , Reference Combs, Michael and Castrogiovanni 43 ), which may considerably influence what is experienced in the store by consumers as well as what resources a store has to support the stocking and/or promotion of certain healthful products. Comparatively, independently owned stores likely do not possess the financial resources of chain stores, but may have less bureaucratic structures which may increase their adaptability to consumer changes or other pressures( Reference Ang 42 – Reference Jennings and Beaver 44 ). However, the dearth of evidence examining differences in consumer-level features and store practices by different ownership models across the public health nutrition literature makes these assertions largely unsubstantiated.
To address the literature gaps described above, we examined differences in consumer-level characteristics among small and non-traditional food retailers across neighbourhood racial segregation and corporate status. Specifically, we examined differences in the availability, affordability and marketing characteristics experienced by customers within a store, as well as structural store resources and capabilities relevant to these consumer-level features.
Methods
Study design and population
Data were collected as part of the larger STORE (STaple Foods ORdinance Evaluation) study, a natural experiment evaluating a local ordinance which created minimum stocking requirements of healthy foods in food stores for the city of Minneapolis, MN, USA( 45 ). Briefly, the 2014 Staple Foods Ordinance requires grocery stores with a business licence issued by the city of Minneapolis to stock minimum quantities and varieties of products in ten staple food and beverage categories (e.g. fruits and vegetables, whole grains, low-fat dairy). Data for the current study were collected at baseline (July to November 2014), prior to the ordinance implementation, from stores in Minneapolis and an adjacent city, St. Paul, MN, USA, which served as the larger study’s comparison. The Institutional Review Board of the University of Minnesota approved the study.
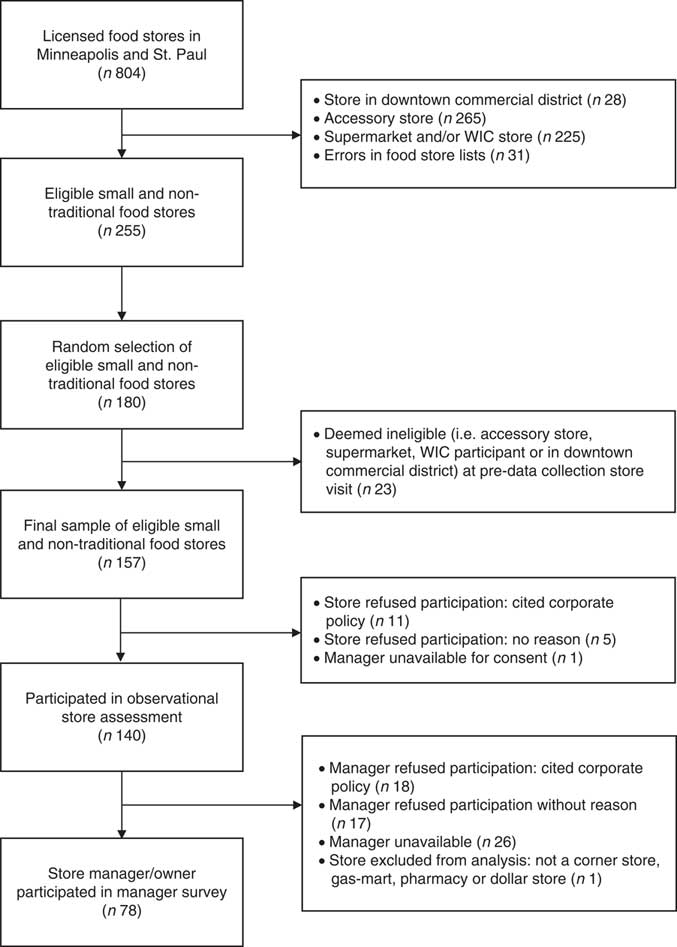
We randomly selected food stores from lists of licensed grocery retailers in both cities. The Minneapolis list was obtained from the Minneapolis Health Department and the St. Paul list was obtained from the Minnesota Department of Agriculture. Based on these lists and prior to the random selection of stores, those exempt from the Minneapolis policy as well as comparable stores in St. Paul were excluded from our sample, including: (i) stores in the core downtown commercial districts; and (ii) small accessory stores not expected to stock an array of staple foods (e.g. liquor stores, specialty shops and other small vendors such as produce stands). We also limited the study to stores most likely to be affected by the policy and therefore excluded stores that were likely to be already surpassing the new policy standards, including supermarkets and stores listed in the state-wide database as authorized retailers in the Special Supplemental Nutrition Program for Women, Infants, and Children (WIC). Finally, we excluded stores with invalid addresses. Of the 255 eligible stores, we randomly selected 180 for study participation (ninety in Minneapolis, ninety in St. Paul). After a pre-data collection store visit, an additional twenty-three stores were deemed ineligible due to the exclusion criteria listed above. Prior to data collection, stores received a mailed letter in advance describing the study, and 140 (of 157 remaining) retailers actively gave consent for study participation with 139 stores included in the present analysis (see Fig. 1).
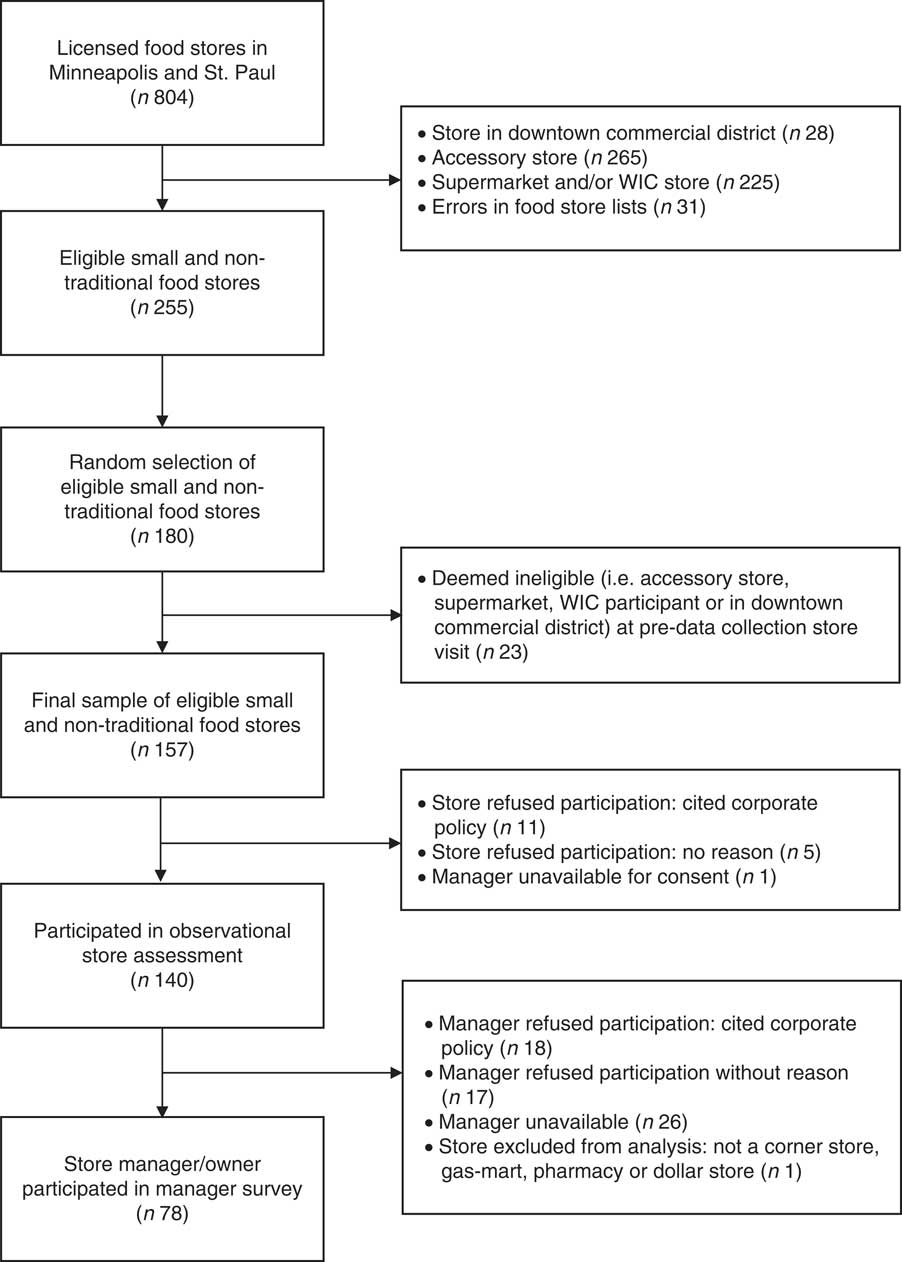
Fig. 1 Flow diagram of small and non-traditional food store and manager recruitment at baseline in July–November 2014 (WIC, Special Supplemental Nutrition Program for Women, Infants, and Children)
Data collection and measures
Data were collected at participating stores during in-person store visits using an observational store assessment and a manager survey. Teams of two data collectors conducted the store visits primarily on weekdays between 10.00 and 19.00 hours. After receiving verbal approval from the store manager or employee, data collectors completed the store assessment and asked store owners or managers (referred to as ‘managers’ from here forward) to also participate in an interviewer-administered manager survey. Items on the manager survey were informed from prior survey research with small food retailers( Reference Laska, Schmidt Sindberg and Ayala 46 , Reference Ayala, Laska and Zenk 47 ). New items developed by the research team were pilot tested with approximately three or four local retailers for face validity, which resulted in minor wording alterations prior to data collection. Of the participating stores at baseline, seventy-eight managers consented to participating in the manager survey (see Fig. 1).
Racial segregation
We operationalized racial segregation using the percentage of non-Hispanic White residents in each store’s census tract (median=60·7 %) with data from the 2009–2013 American Community Survey (ACS). This operationalization has limitations, as the degree of segregation and the effects these may have on health, well-being and opportunity for individuals and the neighbourhood vary considerably across different racial groups not socially identified as White. However, negotiating the sample size of our data set with our goals of examining racial segregation, we used the following categories: predominantly white (>70 % non-Hispanic White; n stores 46), racially mixed (30–70 % non-Hispanic White; n stores 67) and predominantly people of colour (POC; <30 % non-Hispanic White; n stores 26).
Corporate status
Store corporate status was determined primarily from the manager survey. Managers reported whether the store was independently owned, corporately owned or part of a franchise. We collapsed franchise and corporately owned stores into the same category to compare with independently owned retailers. For stores where ownership status was not available from the manager survey, two study team members (C.E.C. and M.N.L.) determined corporate v. independent status based on publicly available information about the store, such as name and the number of locations the store had. Stores that were part of well-known chains (e.g. Walgreens, Holiday Stations) were assigned corporate status; stores that had only one location were deemed independent.
Availability characteristics
Availability characteristics included store characteristics and manager perceptions related to the healthfulness of food and beverage products available for purchase, which were measured by observational store assessments or the manager surveys.
Fresh fruits and fresh vegetables offered
Fresh fruits and fresh vegetables offered were observed during the store assessment with an instrument adapted from the tool previously used in stores to evaluate changes in WIC packages( Reference Andreyeva, Luedicke and Middleton 48 ). The adapted instrument guided data collection on the availability, quality and varieties of sixty-nine food and beverage items (e.g. dairy, juice, fruit, vegetables, refined grains) and inter-rater reliability, which was evaluated during data collector training, was above 80 % for all items( Reference Laska, Caspi and Pelletier 31 , Reference Caspi, Pelletier and Harnack 49 , Reference Caspi, Pelletier and Harnack 50 ). For the present study, we used data relevant to assessing if stores offered any fresh fruit (yes v. no) and any fresh vegetables (yes v. no).
Shelf space ratio for healthy-to-unhealthy food
Shelf space ratio for healthy-to-unhealthy food assessed the shelf space of fresh fruits and vegetables (healthy) relative to the shelf space for non-alcoholic beverages with nutritive and non-nutritive sweeteners and salty snacks (unhealthy)( Reference Caspi, Lenk and Pelletier 23 ). The measure provides a general understanding of customers’ relative exposure to healthy and unhealthy foods; and selection of unhealthy categories was informed by prior research, which indicated small food retailers found salty snacks and sugary beverages as the most important unhealthy products in attracting customers to their stores( Reference Laska, Schmidt Sindberg and Ayala 46 ). Shelf space was measured during the store assessment, using a standard tape measure, in inches and rounded to the nearest foot. Unhealthy beverages included all non-alcoholic beverages except for unflavoured water, unsweetened milk and 100 % juice. Salty snacks included chips, popped and/or flavoured popcorn, salted meat snacks or similar processed salty foods, and excluded nuts, seeds, rice cakes or plain crackers. Inter-rater agreement for shelf space measures, which was conducted during baseline data collection, ranged from 72 % (salty snacks) to 89 % (vegetables); and those measured by the data collector completing the entire observational store assessment were used.
Refrigeration for fresh produce
Refrigeration for fresh produce was assessed with an item on the manager survey asking whether refrigeration or coolers for fresh fruits and vegetables is available and already occurring in their store (yes v. no).
Fresh fruit and fresh vegetables obtained via distributor/store delivery
Fresh fruit and fresh vegetables obtained via distributor/store delivery were assessed only among stores that were observed to carry these items; managers responded to the survey item, ‘Please let me know how you mostly obtain these products for your store: self-supply/cash and carry, a general distributor or direct store delivery’( Reference Ayala, Laska and Zenk 47 ). Self-supply included items that were independently purchased by a store employee from a warehouse, club store and/or larger supermarket, and general distributor or direct store delivery included items that were ordered and delivered directly to the store; responses were dichotomized to self-supply/cash and carry v. general distributer/direct delivery.
Perceived difficulty to obtain fresh and healthier food products from a distributor
Perceived difficulty to obtain fresh and healthier food products from a distributor was assessed with a three-item scale (Cronbach’s α=0·78) that captured general ability to work with a supplier of healthier foods (e.g. ‘How difficult would it be for you to work with a distributor or wholesaler to obtain (more) fresh produce to sell in your store?’). All managers rated the difficulty (from 1=‘extremely easy’ to 5=‘extremely difficult’) to work with a distributor or wholesaler to obtain (or to obtain more): (i) fresh produce; (ii) products high in whole grains; and (iii) canned fruit and vegetables. Scores were averaged across the three survey items.
Perceived difficulty to reduce unhealthy and increase healthy food shelf space
Perceived difficulty to reduce unhealthy and increase healthy food shelf space was also assessed with a three-item scale (Cronbach’s α=0·73). All managers again rated the difficulty (from 1=‘extremely easy’ to 5=‘extremely difficult’) for reducing the store’s shelf space for stocking chips/salty snacks and soda pop (two items) and increasing the amount of shelf space for healthier snacks and beverages (one item); scores were averaged across the three survey items.
Affordability characteristics
Affordability characteristics included store features and manager perceptions around the prices of healthful food and beverage products.
Prices for the three most common fresh fruits and fresh vegetables
Prices for the three most common fresh fruits and fresh vegetables offered across the study sample were recorded by data collectors on the adapted instrument for sixty-nine food and beverage items( Reference Andreyeva, Luedicke and Middleton 48 ); prices represent price per item.
Perceived difficulty to reduce pricing on healthier snacks
Perceived difficulty to reduce pricing on healthier snacks was reported by all managers with a single survey item, and response options ranged from 1=‘extremely easy’ to 5=‘extremely difficult’.
Marketing characteristics
Interior advertisements and impulse buys
Marketing characteristics involved factors related to the healthfulness of interior advertisements and impulse buys in stores and were measured using a modified tool( Reference Barnes, Pelletier and Erickson 51 ) originally developed by the CX3 retail scoring system( Reference Ghirardelli, Quinn and Sugerman 52 ). Inter-rater agreement, which was assessed during data collector training, ranged from 88 to 100 % for advertising and impulse buy characteristics.
Data collectors recorded whether there were any interior advertisements for ‘healthy’ items (e.g. fruits and vegetables, whole grains, beans, nuts and seeds) and ‘unhealthy’ items (e.g. sugar-sweetened beverages, sweet desserts, candy, chips and other salty snacks). Advertisements next to, below or on the floor standing at the checkout or hanging from the store’s ceiling were assessed. In the present study, we measured if stores had any healthy advertisements (yes v. no) and any unhealthy interior advertisements (yes v. no).
Impulse buys included the placement of ‘healthy’ (e.g. fresh fruits) and ‘unhealthy’ (e.g. soda, chips) items within reach of the cash register to promote unplanned purchasing at checkout. We report whether stores had any healthy impulse buys (yes v. no) and any unhealthy impulse buys (yes v. no).
Other descriptive store characteristics
Other descriptive characteristics of stores and their neighbourhoods included store type (i.e. gas-mart, dollar store, pharmacy or corner store/small grocer), whether they accepted Supplemental Nutrition Assistance Program (SNAP) benefits, the median household income in a store’s census tract as well as the percentage of households in a store’s census tract that fell at or below 130 % of the poverty line (i.e. current income eligibility for SNAP benefits based on 2009–2013 ACS data).
Statistical analysis
For descriptive purposes, we assessed how store characteristics (store type, SNAP status) and neighbourhood characteristics (percentage of families at or below 130 % of the federal poverty level and median household income) varied by both racial segregation and corporate status, as well as assessed how corporate status varied by racial segregation. Given that only seventy-eight managers participated, we also examined whether differences in store characteristics (i.e. SNAP participation, corporate/franchise v. independent) and characteristics of a store’s neighbourhood (i.e. percentage of non-Hispanic White in census tract, located in low-income and low-access census tract) occurred by manager participation and did not identify any significant differences. We then computed a series of regression models (logistic for binary outcomes, linear for continuous outcomes) for each of the availability, affordability and marketing measures (dependent variables) with corporate status and racial segregation treated as independent variables. For each dependent variable, we first computed a model with each independent variable separately, followed by a model with both independent variables (corporate status and racial segregation) together in one model. Since estimates were similar, we present the means and proportions only from the models that included both corporate status and racial segregation. All analyses were conducted using the statistical software package SAS/STAT version 9·4. Significance was assessed at P≤0·05.
Results
Descriptive characteristics
Table 1 presents descriptive characteristics of small and non-traditional food stores in the sample. Approximately one-fifth of stores were located in predominantly POC neighbourhoods, one-third located in predominantly White neighbourhoods, and half located in racially mixed neighbourhoods. Approximately half of stores were corporate- or franchise-owned, and corporate/franchise-owned stores made up a greater proportion of the stores in the predominantly White neighbourhoods compared with stores in predominantly POC neighbourhoods (58·7 and 34·6 %, respectively). Poverty status also varied across racial segregation, as the percentage of families at or below 130 % of the poverty line was three times greater in predominantly POC compared with predominantly White communities (60·3 v. 19·3 %, respectively). Store type was also notably different across racial segregation categories, with dollar stores making up a larger proportion of stores in predominantly POC neighbourhoods and pharmacies a larger proportion in predominantly White neighbourhoods. In addition, the majority of gas-marts, dollar stores and pharmacies were corporate/franchise-owned; whereas all corner stores/small grocers were independently owned.
Table 1 Characteristics, by racial segregation and corporate status, of surveyed stores (n 139) in Minneapolis and St. Paul, MN, USA, July–November 2014

POC, people of colour; SNAP, Supplemental Nutrition Assistance Program.
Availability
Table 2 presents the means and prevalences of availability characteristics across racial segregation categories and ownership status. Adjusting for corporate status, offering fresh fruits was the only characteristic that differed significantly by racial segregation. Stores in predominantly White communities were more likely to carry fresh fruits (75·9 %) than stores in predominantly POC communities (50·9 %).
Table 2 Adjusted* prevalence and means of availability characteristics, by racial segregation and corporate status, of surveyed stores (n 139) in Minneapolis and St. Paul, MN, USA, July–November 2014
POC, people of colour.
Unlike superscript letters distinguish significant differences (P≤0·05) among racial segregation categories (a,b) and among corporate status categories (d,e). Categories sharing the same superscript letter were not significantly different.
* Models are mutually adjusted for racial segregation and corporate status.
† Sample size varies based on data source: either manager self-report survey data (dagger) or observational store data (no dagger).
‡ Results are from a linear model because logistic model would not converge.
§ Unhealthy food=soda pop, chips and salty snacks; healthy food=pretzels, low-fat chips and water.
In contrast, several significant differences were observed by corporate status, while adjusting for the effects of racial segregation (Table 2). In comparison to independently owned stores, corporate/franchise-owned stores were less likely to offer fresh fruits and fresh vegetables and had a lower healthy-to-unhealthy food shelf space ratio. When corporate stores offered fresh fruits and vegetables, they were more likely to report receiving these products via direct store delivery while independent stores relied more on self-supply. In addition, managers of corporate/franchise-owned stores perceived a greater difficulty in modifying shelf space to increase space for healthy foods and decrease space for unhealthy products.
Affordability
As presented in Table 3, no significant differences in the prices of fresh fruits and vegetables were observed across racial segregation categories. Few significant differences in prices were observed by corporate status and when they occurred (i.e. for bananas and lettuce), mean pricing was lower in independently owned stores compared with corporate/franchise-owned stores. Additionally, managers of independently owned stores perceived significantly less difficulty in reducing the price on healthier products than managers of corporate/franchise-owned stores.
Table 3 Adjusted* means of affordability characteristics, by racial segregation and corporate status, of surveyed stores (n 139) in Minneapolis and St. Paul, MN, USA, July–November 2014

POC, people of colour.
Unlike superscript letters distinguish significant differences (P≤0·05) among corporate status categories (d,e). There were no significant differences among racial segregation categories.
* Models are mutually adjusted for racial segregation and corporate status.
† Sample size varies based on data source: either manager self-report survey data (dagger) or observational store data (no dagger); sample size for observational data also varies based on availability of produce in stores.
Marketing
Table 4 presents the prevalence of marketing characteristics by racial segregation and corporate status. Although a nearly universal feature of stores overall, unhealthy impulse buy availability (i.e. unhealthy products within reach of the cash register) was significantly more common among stores in predominantly White v. predominantly POC communities (98·8 and 86·7 %, respectively). Unhealthy impulse buys were also significantly more common among corporate/franchise-owned stores compared with independently owned stores (98·8 and 85·4 %, respectively), as were interior advertisements of unhealthy food and beverage products (corporate/franchise-owned=74·3 % and independently owned=51·0 %).
Table 4 Adjusted* prevalence of marketing characteristics, by racial segregation and corporate status, of surveyed stores (n 139) in Minneapolis and St. Paul, MN, USA, July–November 2014

POC, people of colour.
Unlike superscript letters distinguish significant differences (P≤0·05) among racial segregation categories (a,b) and among corporate status categories (d,e). Categories sharing same superscript letter were not significantly different.
* Models are mutually adjusted for racial segregation and corporate status.
† Results are from a linear model because the logistic model would not converge.
Discussion
The present study aimed to examine differences in the consumer-level features and structural store resources and capabilities related to availability, affordability and marketing among small and non-traditional food stores across racial residential segregation and corporate status. Findings revealed few significant differences across racial residential segregation, which indicated that relative to stores in predominantly POC communities those in predominantly White communities had more availability of fresh fruits as well as more promotion of unhealthy impulse buys. In contrast, numerous differences in consumer-level characteristics and store resources and capabilities were identified by corporate status, suggesting that independent v. corporate- and franchise-owned stores had more healthful consumer-level features overall and were more capable of making healthful store changes; however, independent stores simultaneously possessed a more limited infrastructure for offering healthful foods and beverages (e.g. direct delivery of fresh produce).
Prior evidence has identified inequalities in consumer-level features by residential segregation and other indicators of racism across a variety of food venues (i.e. supermarkets, convenience stores)( Reference Block and Kouba 3 , Reference Zenk, Powell and Rimkus 5 , Reference Baker, Schootman and Barnidge 37 – Reference Lewis, Sloane and Nascimento 41 ). As a result, we anticipated observing similar disparities among small and non-traditional food stores, although we identified significant differences for only two store-level characteristics. Specifically, we identified that stores in predominantly White v. POC communities were significantly more likely to offer fresh fruits as well as have unhealthy impulse buys. Using a relative count of healthier to unhealthier food and beverage products in a nationwide study, Zenk et al. identified similar differences in the availability of healthy foods among limited-service stores( Reference Zenk, Powell and Rimkus 5 ). They identified less healthy food availability to be a characteristic of non-Hispanic Black, Hispanic and non-Hispanic Other communities relative to non-Hispanic White communities( Reference Zenk, Powell and Rimkus 5 ), potentially compounding racial/ethnic disparities well documented at the community level of the food environment (e.g. fewer supermarkets among communities of colour than White communities). In addition, we identified unhealthy impulse buys to be significantly more common among stores in predominantly White neighbourhoods, which may indicate an intentional action by stores in POC communities to be healthier. On the other hand, this difference may represent an inequality in the opportunities that small stores in POC communities have for gaining access to cooperative marketing agreements where product manufacturers pay retailers for product placement at checkouts( Reference Almy and Wootan 53 ).
Given the considerable evidence documenting disparities across racial/ethnic communities at both the community( Reference Powell, Slater and Mirtcheva 15 , Reference Zenk, Schulz and Israel 17 , Reference Morland, Wing and Diez Roux 18 ) and consumer levels( Reference Block and Kouba 3 , Reference Zenk, Powell and Rimkus 5 , Reference Baker, Schootman and Barnidge 37 – Reference Lewis, Sloane and Nascimento 41 ), several explanations should be considered to clarify the limited number of significant differences we observed. First, it may be possible that inequities in the food environment by racial segregation are more a feature at the community level rather than the consumer level (i.e. type of food venue v. within-store availability), as we observed unhealthy impulse buys (prevalence=87–98 %) and a low healthy-to-unhealthy food shelf space ratio (range=0·02–0·05) to both be nearly universal store features across residential segregation categories. It may also be possible that, if consumer-level differences exist, these may occur more among grocery stores and supermarkets( Reference Franco, Diez Roux and Glass 54 ) than small and non-traditional food retailers. In addition, due to the progressive ubiquity of unhealthy food venues, recent evidence suggests some narrowing in unhealthy food environment disparities over the past 40 years (e.g. proximity to fast-food restaurants)( Reference James, Seward and O’Malley 55 ), begging the question whether parallel trends are also occurring inside small and non-traditional stores. Lastly, prior research has estimated that the difference by residential segregation in the healthfulness of foods available in small stores varied depending on the racial/ethnic make-up of the community (i.e. the difference between non-Hispanic White and non-Hispanic Black communities was twice as large as the estimated difference between non-Hispanic White and non-Hispanic Other)( Reference Zenk, Powell and Rimkus 5 ). Thus, it is possible that by collapsing stores from all communities of colour to accommodate the limited sample size in our study we attenuated our ability to detect these meaningful racial/ethnic differences.
In contrast, we identified many significant differences by corporate status, suggesting that, compared with independently owned stores, corporate- and franchise-owned stores: (i) offered fewer healthful products, particularly relative to unhealthy products; (ii) where significant differences in fresh produce prices existed by corporate status, corporate stores charged more; and (iii) corporate stores’ marketing features were more likely to encourage unhealthy product purchases. At the same time, corporate stores had more resources and infrastructure to support more healthful consumer purchases (e.g. fresh produce is almost universally received via direct store delivery v. self-supply), despite appearing to support and promote the opposite.
We also observed that managers of corporate- v. independently owned stores perceived that it would be more difficult to change store practices to encourage more healthful products (e.g. reduce pricing on healthy options, reduce shelf space for unhealthy and increase it for healthy products). Rather than reflecting an individually held characteristic of managers, this finding may reflect characteristics of the system of power and decision making among corporate v. independent stores, which is likely to be more complex in those corporately owned (i.e. several decision makers must agree to changes rather than a single owner). As such, managers of corporate stores may be evaluating a store’s capability for healthful change in terms of their constrained autonomy as a manager in a corporate system or in terms of the values and willingness they perceive of the corporation. Either way, these findings should likely not be interpreted as store disempowerment, given that corporate stores possessed more advantageous resources and infrastructure for supporting healthier products, which places them in a more viable position for making healthful changes. Conversely, for independently owned stores, these findings indicate that they may instead need additional support to structurally facilitate similar healthful change.
The ownership, or corporate, status of stores is a largely unexamined feature in food environment research, with previous studies often grouping by store type (i.e. supermarkets, grocery stores, limited-service stores) rather than considering if differences exist among chain and independent lines. While store type, even among small and non-traditional stores, is an important construct and may be a key contributor to the differences by corporate status we observed, it may be important to go beyond simply focusing on the store type and services offered (e.g. gas, pharmacy) and examining what, if any, differences exist among positions of power, means and influence. Despite the unique contributions of our study to the literature, our operationalization of corporate status is a fairly blunt measure; differences in resources, capabilities and infrastructure may exist across different corporations and/or different franchise models, and future research that aims to understand more about these nuances could help to identify strategies that might even translate to independently owned stores (e.g. developing a food cooperative across a group of small stores).
Future research on all food venues may also benefit from examining consumer and resource characteristics across both store type (e.g. grocery stores, supermarkets, gas station) and ownership status (e.g. corporate or chain v. independent). In addition, our study is the first we are aware of that examined the consumer-level food environment by ownership status alongside the racial residential segregation of a store’s neighbourhood. As these things appear to vary together (i.e. corporate stores make up a greater proportion of small and non-traditional food stores in predominantly White v. predominantly POC neighbourhoods), future investigations with adequately powered sample sizes may benefit from examining the potential additive and/or multiplicative effects (i.e. interactions) between these determinants on what is offered, priced and marketed among food stores.
Strengths and limitations
In the interpretation of study findings, strengths and limitations must also be considered. Strengths of the present study include the random sampling frame for small and non-traditional food stores; examining consumer-level features across a variety of domains, including availability, affordability and marketing, via observational data; and mutually adjusting for the independent effects of residential racial segregation and corporate status. Limitations of our study include the small sample size for each racial segregation category, which may have limited our ability to detect small to medium effect sizes as well as to make more nuanced comparisons among stores in communities of different dominant racial/ethnic groups (e.g. non-Hispanic Black dominant, non-Hispanic Asian dominant, Hispanic dominant). Sample size was also a limitation for certain consumer-level outcomes, such as method of stocking for fresh produce and pricing of vegetables, in which the sample size was limited to only those stores offering the product (e.g. only twenty-five stores of the entire sample offered onions and fifteen stores offered lettuce). In addition, just over half of store managers participated in the self-report manager survey at baseline. The healthy-to-unhealthy food shelf space ratio also has limitations, as unhealthy products were limited to two categories and healthy products to fresh produce; restricting the measure to these categories was required to obtain a feasible relative measure as well as limit its intrusiveness on the store (i.e. data collectors used a tape measure while customers shopped). Finally, the cross-sectional analysis prevents determining the temporality of the identified associations, and findings can only be generalized to small and non-traditional stores that are not WIC eligible.
Conclusions
In summary, findings from the present study extend the evidence base for local food environment disparities by examining consumer-level and upstream, structural differences across the racial residential segregation of a store’s neighbourhood and the ownership, or corporate, status of a store. The study focused on identifying differences among small and non-traditional food stores, as they remain a relevant contributor to the dietary behaviour of the US urban population. Findings presented here justify the need for additional investigations into food environment inequities across less-examined social determinants, such as corporate status. Findings also suggest that policies and interventions aimed at improving the healthfulness of the consumer-level food environment may need to consider the unique challenges and differences in resources and capabilities across multiple social determinants to enable successful implementation.
Acknowledgements
Acknowledgements: The authors would like to acknowledge Kristen Klingler and Nora Gordon at the Minneapolis Health Department for their continuous partnership on this work and their remarkable expertise on local small food stores. They would also like to acknowledge the extensive efforts of those who assisted with data acquisition and management, including Stacey Moe, Pamela Carr-Manthe, Jennifer Pelletier and Bill Baker. Finally, they thank the store managers who generously participated in this study. Financial support: Research reported in this publication was supported by the National Institute of Diabetes and Digestive and Kidney Diseases of the National Institutes of Health under Award Number R01DK104348 (Principal Investigator: M.N.L.); and the Health Promotion and Disease Prevention Research Center supported by Cooperative Agreement Number 5U48DP005022 from the Centers for Disease Control and Prevention (Principal Investigator: M.N.L.). Further support was provided to M.R.W. as a postdoctoral fellow by the National Institute of Diabetes and Digestive and Kidney Diseases of the National Institutes of Health under Award Number T32DK083250 (Principal Investigator: R. Jeffery). The content is solely the responsibility of the authors and does not necessarily represent the official views of the National Institutes of Health or Centers for Disease Control and Prevention. Funding agencies had no role in the design, analysis or writing of this article. Conflict of interest: None. Authorship: M.R.W. was responsible for formulating research questions, leading results interpretation and manuscript writing. K.M.L. was responsible for performing data analysis, contributed to writing/revision of the manuscript, and supported carrying out the study from which these data originated. C.E.C. contributed to formulation of the research questions, assisted in interpreting results, made contributions to revising the manuscript, and supported carrying out the study from which these data originated. D.J.E. guided and provided feedback on the analysis, assisted in interpreting results, and contributed to manuscript writing and revisions. L.H. assisted with interpretation of the results and made contributions to revising the manuscript for important intellectual content. M.N.L. was responsible for leading the overall study from which these data originated, including conception/design, funding acquisition and implementation; and gave feedback on analyses/interpretation of results and writing/revision of the manuscript. Ethics of human subject participation: This study was conducted according to the guidelines laid down in the Declaration of Helsinki and all procedures involving human subjects were approved by the University of Minnesota. Verbal informed consent was obtained from all participants. Verbal consent was witnessed and formally recorded.