


1 INTRODUCTION
Black holes at the centres of galaxies reach masses of over 10 billion times that of our Sun. Surprisingly, we have found such massive black holes already in the early Universe, just 800 million years after the Big Bang (Wu et al. Reference Wu2015). How they grew to such mass so early after the Big Bang is a profound puzzle for physics. They must have grown at super-Eddington rates for a long period of time, or they originate from massive seed black holes that formed during the dark early ages by direct collapse (Bromm & Loeb Reference Bromm and Loeb2003; Pacucci, Volonteri, & Ferrara Reference Pacucci, Volonteri and Ferrara2015).
Currently, we can only discover such super-massive black holes in the distant early universe while they grow rapidly and accrete vast amounts of matter. This makes them appear as very luminous quasi-stellar objects (QSOs, Schmidt Reference Schmidt1963) when we have a clear view of the accretion disk around the black hole, and as type-2 QSOs and infrared-luminous galaxies when that view is blocked by dust (e.g. Seymour et al. Reference Seymour2007; Lacy et al. Reference Lacy2013); at present, we can only measure the masses of their black holes when we have a clear view.
Finding the most luminous, optically bright, QSOs is important for several reasons: (i) they point us to the most massive black holes that pose the greatest challenge to any physical growth scenario; (ii) they ionise large volumes of neutral gas around them and contribute to cosmic reionisation (Fan, Carilli, & Keating Reference Fan, Carilli and Keating2006a; Wu et al. Reference Wu2015); (iii) they reveal the metal enrichment in the early universe by shining like beacons through the gas content of high-redshift galaxies along the line-of-sight that are otherwise hard to observe (Ryan-Weber et al. Reference Ryan-Weber2009; Simcoe et al. Reference Simcoe2011); and (iv) they will eventually enable the most sensitive direct observations of the expansion of the Universe (Liske et al. Reference Liske2008).
Among optically luminous QSOs at high redshift, the most impressive objects are J0306+1853 at z = 5.36, which is powered by a black hole of 10 billion solar masses (Wang et al. Reference Wang2015), and J0100+2802 at z = 6.3 with a black hole of 12 billion M⊙ (Wu et al. Reference Wu2015); both of them radiate at their Eddington limit. Tsai et al. (Reference Tsai2015) claim the bolometrically most luminous object in the Universe is the ELIRG WISE J224607.57-052635.0 at z = 4.593 with logL bol/L ⊙ = 14.54 but disagree with Wu et al. (Reference Wu2015) on the bolometric correction.
Here, we report a newly identified high-redshift QSO with the highest unlensed UV-optical luminosity known at present. Throughout the paper, 2MASS and WISE magnitudes are used in the Vega system, while optical magnitudes are in the AB system (Oke & Gunn Reference Oke and Gunn1983). We adopt a standard flat ΛCDM cosmology with parameters H 0 = 70 km s−1 Mpc−1, ΩM = 0.3, and  $\Omega _\Lambda = 0.7$.
2 Data
2.1. Selection and photometry
The discovery of SMSS J215728.21−360215.1 (hereafter, J2157−3602) was helped by the Data Release 2 from GAIA (Gaia Collaboration et al. 2018) and its unprecedented precision on proper motion measurements. Prior to GAIA DR2, ultra-luminous QSOs were discovered only serendipitously, because QSO candidate lists were inflated by staggering contamination from cool stars. Even though QSO colours differ from star colours to some degree, the scatter in star colours leads to overlapping loci in colour space. And at bright levels, where the luminosity function of high-z QSOs plummets towards zero space density, stars vastly outnumber real QSOs. Thus, spectroscopic follow-up was often biased against the brightest and potentially most exciting candidates as they were by far the least likely to be QSOs.
However, the main contaminants of the search box for high-z QSOs are nearby Galactic stars of low mass and temperature, which can now be identified very reliably from the proper motions in the GAIA database. Hence, immediately after the release of GAIA DR2 on 2018 April 25, we searched for red objects using B p − R p in the GAIA database that are consistent with having no significant proper motion. Candidates were then cross-matched against SkyMapper DR1 (Wolf et al. Reference Wolf2018), the 2 Micron All Sky Survey (2MASS, Skrutskie et al. Reference Skrutskie2006) and the Wide-field Infrared Survey Explorer (WISE, Wright et al. Reference Wright2010), and further selected to have optical-infrared colours appropriate for high-z QSOs (details will be published by Wolf et al., in preparation).
J2157−3602 appears in GAIA DR2 as a single isolated source; the nearest neighbour detected by GAIA is ~42 arcsec away, while the resolution achieved by GAIA reaches up to ~0.1 arcsecFootnote 1. GAIA is complete to magnitude R p ≈ 19, while our object is ~2 mag brighter; this suggests that the brightness of the object is not boosted by strong gravitational lensing. We find the same conclusion after searching infrared images from the VISTA Hemisphere Survey (VHS, McMahon et al. Reference McMahon2013) for signs of an extended source that could signify either multiple images or the presence of a lensing galaxy. In all three bands, YJK s, the source is fully consistent with a point source, where the PSF FWHM is 1.04, 0.94, and 0.91 arcsec, respectively (see also Figure 1). We checked the Abell, Corwin, & Olowin (Reference Abell, Corwin and Olowin1989) catalogue of galaxy clusters in a 2° radius around the QSO and found no entry that could have weakly lensed it.
Figure 1. Images of J2157−3602 from the VISTA Hemispheric Survey (VHS) in YJK s-bands. The QSO appears as an isolated, single point source just like it does in the GAIA R p-band, so its brightness is unlikely to be boosted by strong gravitational lensing.
J2157−3602 is clearly detected by SkyMapper in the far-red bands with i = 17.37 and z = 17.11, but not in any of the bluer bands, which are only complete to 18 mag in DR1. It was detected by VST-ATLAS (Shanks et al. Reference Shanks2015) with g ≈ 21, r = 18.68, i = 17.32, and z = 16.93. Most photometry for high-z QSOs is from the SDSS survey (see, e.g., Wang et al. Reference Wang2016), and while VST filters are very similar to the SDSS, the SkyMapper passbands are different. The optical colour is consistent with the 4.7 < z < 5.4 QSO selection criteria used by Wang et al. (Reference Wang2016), but it is outside of the optical selection box used by Richards et al. (Reference Richards2002).
It was also clearly detected in 2MASS and WISE, reaching magnitude 7.42 in the 22 μ-band W4. The WISE position is consistent with the GAIA position within 0.05 arcsec. The nearest neighbouring source in the WISE catalogue is 26 arcsec away and is 4 mag fainter in W1 and 1 mag fainter in W4. With a colour of W1−W2 = 0.51 ± 0.03, the QSO was at the edge of the selection box used by Wang et al. (Reference Wang2016). Their selection of W1−W2>0.5 was motivated by suppressing contamination from stars, but with GAIA, it is feasible to push the selection limits further into the stellar locus.
In Figure 2, we show the light curve of the object in the orange filter of the Asteroid Terrestrial-impact Last Alert System (ATLAS, Tonry et al. Reference Tonry2018) covering three observing seasons from 2015 October to 2017 December. The mean error and scatter is ~0.1 mag and little variability is detected above that, but some variation can be seen after binning the data into 5-d intervals.

Figure 2. Light curve of J2157−3602 from the Asteroid Terrestrial-impact Last Alert System (ATLAS) project covering three seasons from 2015 October to 2017 December, after binning magnitudes into 5-d intervals to reduce noise. There is no sign of strong variability, but slow variations at a ±0.1 mag level can be seen.
J2157−3602 is not detected in any large radio survey: neither by the NRAO-VLA Sky Survey (NVSS, Condon et al. Reference Condon1998), which has a flux limit of 2.5 mJy at 1.4 GHz, nor by the Sydney University Molonglo Southern Survey (SUMSS, Bock, Large, & Sadler Reference Bock, Large and Sadler1999) with a limit of 5 mJy at 843 MHz. We use the radio-to-optical ratio R = f ν, 6cm/fν, B as defined by Kellermann et al. (Reference Kellermann, Sramek, Schmidt, Shaffer and Green1989) to label the object as radio-loud (R > 10) or radio-quiet (R < 1); in that work, the ratio is based on the flux density at 6 cm and 440 nm wavelength for a sample with an average redshift of ~0.5, but for our object, these bands are redshifted to ~23 cm, which is approximately the NVSS wavelength, and 1710 nm. We find a ratio of R < 2.0 and thus assume that the brightness is not significantly increased by the presence of a jet with relativistic boosting. Photometric and additional properties of the object are listed in Table 1.
Table 1. Properties of QSO SMSS J215728.21−360215.1.

2.2. Spectroscopy
We took a spectrum of this object during the full-moon night of 2018 April 29 18:09 UT, using the ANU 2.3-m telescope at Siding Spring Observatory in Australia with the Wide Field Spectrograph (WiFeS, Dopita et al. Reference Dopita2010). We took two exposures of 600 s with the WiFeS R3000 grating that covers the wavelength range from 5 300 to 9 800 Å with a resolution of R = 3000. The data were reduced using the Python-based pipeline PyWiFeS (Childress et al. Reference Childress, Vogt, Nielsen and Sharp2014). The flux density was calibrated using the standard stars HD 55496 and HD 111786 observed on the same night.
The spectrum is shown in Figure 3 and shows only weak emission lines but a clear Lyman-α forest. The object is thus classified as a Weak-emission-line QSO (WLQ, see Diamond-Stanic et al. Reference Diamond-Stanic2009). Hints of emission lines are seen for Lyman-α and NV as well as CIV, and based on these, we determine the redshift to z = 4.75. Using Ned Wright’s online cosmology calculatorFootnote 2, we find a luminosity distance of D L = 43.91 Gpc. Deep broad absorption lines (BALs) are observed on the blue side of the Ly-α and CIV line. For WLQs, a precise redshift determination is hampered by the poorly defined centre of the broad emission lines. An alternative redshift of z = 4.64 is obtained by assuming that the red edge of the CIV BAL is at the systemic velocity of the QSO.
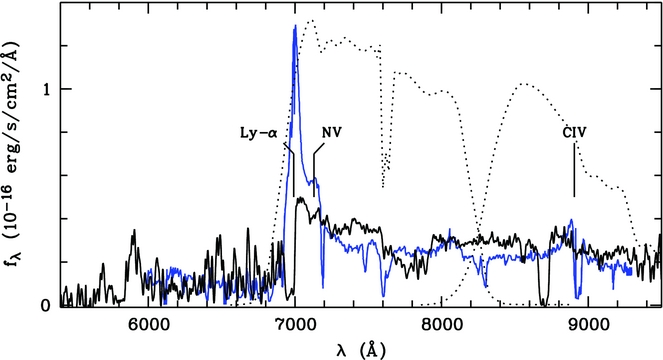
Figure 3. Spectrum of J2157−3602 (thick line) compared to PMN J1451 (thin line). Strong Ly-α emission makes PMN J1451 brighter in VST i-band (dashed), while it is fainter in the continuum and z-band. Both spectra are calibrated from photometry.
WLQs are mostly found at high redshift, their fraction among the overall QSO population rises steeply between z = 3 and z = 4. The physical explanation for WLQs in not clear, but they are predominantly radio-quiet so their continuum is typically not boosted by radiation from relativistic jets (Diamond-Stanic et al. Reference Diamond-Stanic2009).
3 LUMINOSITY VS. OTHER QSOS
The brightest known UV-bright QSO at z > 4.5 in the compilation by Wang et al. (Reference Wang2016) is J145147.05−151220.20 at z = 4.763. Previously labelled PMN J1451−1512, it was identified as a radio-loud QSO by Hook et al. (Reference Hook, McMahon, Shaver and Snellen2002) with a 1.4-GHz flux density of 28.5 ± 1.0 mJy in NVSS. The object is not contained in the SDSS footprint, but in the SDSS-like filters of VST-ATLAS, it has i = 17.22 and z = 17.14. It is not listed in the SkyMapper DR1 ‘master’ table as all its data have warning flags due to proximity to a bright star (the V~7.8 mag HD 131046, 100 arcsec away); however, visual inspection reveals that the images are clean and we retrieve i = 17.23 ± 0.05 and z = 17.19 ± 0.1 from the ‘fs_photometry’ table that contains all detections.
So, PMN J1451−1512 is brighter by ~0.1 mag than our new object in both the i-band and in the GAIA R p-band, but ~0.1 mag fainter in the z-band. This is related to the lack of strong emission lines and the presence of broad absorption bands in our object. PMN J1451−1512 has strong Ly-α emission with ~40 nm equivalent width (see Figure 3), which boosts its i-magnitude by ~0.3 mag, while in the continuum between the Ly-α and CIV lines, our object is 0.2 mag brighter than PMN J1451−1512.
Our object is consistently brighter than PMN J1451−1512 by 0.5 ± 0.05 mag across the whole infrared range from 1.2 μ (J-band) to 22 μ (W4), suggesting a nearly identical spectral slope across the rest-frame range from 200 nm to 4 μ, and thus will have a larger bolometric energy output (see Figure 4). On the blue side of 200 nm rest frame, the continuum appears redder than typical for QSOs, which might have the same origin as the broad absorptions, but we leave the discussion of this point until we obtain a detailed high-S/N spectrum.

Figure 4. Photometry of J2157−3602 (asterisk) at z = 4.75 compared to known QSOs and ELIRGs (grey dots, from Pâris et al. Reference Pâris2017; Wang et al. Reference Wang2016; Tsai et al. Reference Tsai2015); we highlight PMN J1451−1512 (triangle), the most luminous IR-bright AGN from Lacy et al. (Reference Lacy2013) at z = 4.27 and from Tsai et al. (Reference Tsai2015) at z = 4.59 (open symbols), and the UV-bright QSOs from Wang et al. (Reference Wang2015) at z = 5.36 and Wu et al. (Reference Wu2015) at z = 6.3 (filled symbols). Magnitudes in i- and z-bands are from SDSS and SDSS-like VST.
We estimate continuum luminosities at rest frame 145 and 300 nm from broadband photometry in z- and HK-bands, respectively, because our early spectrum is unfortunately too noisy and its calibration too uncertain to derive it from that; due to the weak emission and BALs, we assume this to be an appropriate estimate. We find M 145, AB = −29.30 and M 300, AB = −30.12. We translate this into monochromatic luminosities of νL ν, 145 = 4.71 × 1047 ergs s−1 and νL ν, 300 = 4.75 × 1047 ergs s−1. Using bolometric corrections of 3.8 and 5.6 as estimated in Richards et al. (Reference Richards2006), we find two values for the bolometric luminosity of L bol = 1.8 × 1041 W and 2.66 × 1041 W. We adopt the latter value as all wavelengths above 200-nm rest frame support it, it corresponds to L bol/L ⊙ = 6.95 × 10¹⁴ and an absolute bolometric magnitude M bol = −32.36.
Thus, our new object would be more luminous than QSO J0100+2802 and ELIRG J2246−0526, although bolometric corrections remain uncertain. However, as Figure 4 shows, the monochromatic luminosity of ELIRG J2246−0526 exceeds that of J2157–3602 at restframe 4 μ (W4-band) and most probably longwards of that. We note that the lensed QSO APM 08279+5255 at z = 3.9 has a magnified luminosity exceeding that of our object, but a lower intrinsic luminosity (Ibata et al. Reference Ibata, Lewis, Irwin, Lehár and Totten1999).
Lacking a clearly rendered CIV line, we cannot get a reliable estimate of the black-hole mass at the moment. For the two most luminous z > 5 QSOs, black-hole masses were estimated from their Mg ii lines: J0306+1853 at z = 5.36 is powered by a black hole of 10 billion solar masses (Wang et al. Reference Wang2015) and J0100+2802 at z = 6.3 has a black hole of 12 billion solar masses (Wu et al. Reference Wu2015). Both of these objects appear to radiate at the Eddington limit, and if J2157−3602 does the same, then we expect its black hole to have 20 billion solar masses.
4 SUMMARY
ESA’s GAIA mission, with its unprecedented precision of proper motion measurements, has allowed us to overcome the main obstacle for the discovery of ultra-luminous QSOs in the early universe, which is the staggering contamination of candidate lists by cool stars in our own Galaxy. By combining data from GAIA, SkyMapper, and WISE, we identified SMSS J215728.21−360215.1 as the brightest z ~ 5 QSO known at this point, it has a magnitude of z VST = 16.93 and H 2MASS = 14.84. With a redshift of z = 4.75, this translates into an absolute magnitude of M 300, AB = −30.12 and a bolometric luminosity of 6.95 × 10¹⁴ solar luminosities.
It is not detected in the radio surveys NVSS and SUMSS and thus not likely to be boosted in optical brightness by a relativistic jet. It appears as a single isolated point source in all images and catalogues we considered, most notably the GAIA DR2 database and infrared images from the VHS, and thus not likely to be strongly gravitationally lensed. The derived luminosity is likely intrinsic, making J2157−3602 the QSO with the highest unlensed UV-optical luminosity discovered so far. Our current estimate for the mass of its black hole is 20 billion solar masses, assuming it accretes at the Eddington limit.
While objects of this luminosity are exceedingly rare in the Universe, they are particularly valuable as bright background and reference sources in order to study the properties of intervening matter along the line-of-sight, and for directly probing the expansion of our Universe with new instruments in the coming decades.
Finding high-redshift QSOs is even more efficient when the follow-up of candidates is embedded in a large spectroscopic survey. Later this year, the hemispheric Taipan survey will commence at Siding Spring Observatory and take spectra of more than a million galaxies (da Cunha et al. Reference da Cunha2017). A programme that piggybacks on Taipan aims to go after the 104 best candidates and will confirm a complete sample of supermassive black holes with luminous accretion in the early Universe at 4 < z < 7.
ACKNOWLEDGEMENTS
This research was conducted by the Australian Research Council Centre of Excellence for All-sky Astrophysics (CAASTRO), through project number CE110001020. It has made use of data from the European Space Agency (ESA) mission GAIA (https://www.cosmos.esa.int/gaia), processed by the GAIA Data Processing and Analysis Consortium (DPAC, https://www.cosmos.esa.int/web/gaia/dpac/consortium). Funding for the DPAC has been provided by national institutions, in particular, the institutions participating in the GAIA Multilateral Agreement. The national facility capability for SkyMapper has been funded through ARC LIEF grant LE130100104 from the Australian Research Council, awarded to the University of Sydney, the Australian National University, Swinburne University of Technology, the University of Queensland, the University of Western Australia, the University of Melbourne, Curtin University of Technology, Monash University, and the Australian Astronomical Observatory. SkyMapper is owned and operated by The Australian National University’s Research School of Astronomy and Astrophysics. The survey data were processed and provided by the SkyMapper Team at ANU. The SkyMapper node of the All-Sky Virtual Observatory (ASVO) is hosted at the National Computational Infrastructure (NCI). Development and support the SkyMapper node of the ASVO has been funded in part by Astronomy Australia Limited (AAL) and the Australian Government through the Commonwealth’s Education Investment Fund (EIF) and National Collaborative Research Infrastructure Strategy (NCRIS), particularly the National eResearch Collaboration Tools and Resources (NeCTAR) and the Australian National Data Service Projects (ANDS). This work uses data products from the WISE, which is a joint project of the University of California, Los Angeles, and the Jet Propulsion Laboratory/California Institute of Technology, funded by the National Aeronautics and Space Administration. It uses data products from the 2MASS, which is a joint project of the University of Massachusetts and the Infrared Processing and Analysis Center/California Institute of Technology, funded by the National Aeronautics and Space Administration and the National Science Foundation. This paper uses data from the VISTA Hemisphere Survey ESO programme ID: 179.A-2010 (PI. McMahon). Support for this work was provided by NASA grant NN12AR55G. We thank an anonymous referee for a very fast response and helpful comments improving this publication.


