


INTRODUCTION
Precipitation in western North America falls most heavily along a coastal region extending from northern California to southern Alaska, but coastal mountain ranges and waves in the westerlies limit the inland propagation of this moisture (Rutz et al., Reference Rutz, Steenburgh and Ralph2015). The greatest amount of inland precipitation falls in the northern Rocky Mountains between Idaho and Alberta (Fig. 1; Kalnay et al., Reference Kalnay, Kanamitsu, Kistler, Collins, Deaven, Gandin and Iredell1996), where wet, temperate conditions support a greater diversity of tree populations (Gavin, Reference Gavin2009), a larger network of mountain glaciers (Krimmel, Reference Krimmel2002), and higher river runoff than in drier mountain chains to the south and east (Livneh et al., Reference Livneh, Rosenberg, Lin, Nijssen, Mishra, Andreadis, Maurer and Lettenmaier2013). However, the wet climate of these inland areas may have been susceptible to change during the Holocene (Hermann et al., Reference Hermann, Oster and Ibarra2018), especially when considering present-day effects of interannual variability.

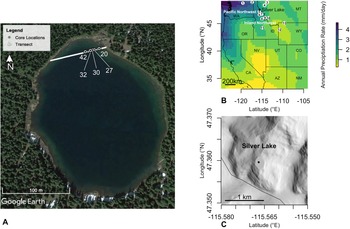
Figure 1. Location maps of study area. (A) Photo of Silver Lake, showing where five cores were taken in a transect at the north end of Silver Lake where there is a small outlet stream (Google Earth Pro, 2021). Cores 20, 27, 30, 32, and 42 were labeled to indicate distance from lake shore in meters. (B) Map of the western United States showing annual precipitation rate in mm/day. Note that average precipitation rate from 1981–2010 in the Bitterroot Mountains of the Northern Rocky Mountains where Silver Lake is located was about 2.5 mm per day (Kalnay et al., Reference Kalnay, Kanamitsu, Kistler, Collins, Deaven, Gandin and Iredell1996). Locations of other published hydroclimate proxy records along the northern Rocky Mountains are: 1) Castor Lake, 2) Lime Lake, 3) Hidden Lake, 4) Foy Lake, 5) Dismal Lake, 6) Rocky Ridge Lake, 7) Horseshoe Lake, 8) Burnt Knob Lake, 9) Baker Lake, 10) Pintlar Lake, 11) Lower Decker Lake, 12) Delta Lake, 13) Beartooth Ice Patch. (C) Shaded elevation map of Silver Lake (USGS, 2017), a small cirque lake in a small watershed on the Idaho–Montana border, plotted using the R package raster (Hijmans et al., Reference Hijmans, van Etten, Sumner, Cheng, Baston, Bevan, Bivand, Busetto, Canty, Fasoli and Forrest2022).
Historically, snowpack in the Inland Northwest of the USA (eastern Washington and Oregon, Idaho, and Montana) depends on the strength of the Aleutian Low and associated high-pressure ridging downstream over western North America (Cayan, Reference Cayan1996; Pederson et al., Reference Pederson, Gray, Ault, Marsh, Fagre, Bunn, Woodhouse and Graumlich2011a). Periods of anomalously low pressure in the North Pacific near the Aleutian Islands and anomalously high pressure ridging over western North America coincide with decreased winter precipitation in the Pacific Northwest and northern Rocky Mountains (Cayan, Reference Cayan1996; Pederson et al., Reference Pederson, Gray, Ault, Marsh, Fagre, Bunn, Woodhouse and Graumlich2011a), including in northwestern Montana (Schoenemann et al., Reference Schoenemann, Martin, Pederson and McWethy2020). During the past 800 years, tree-ring-based snowpack reconstructions reveal a north–south anti-phasing of snowpack anomalies in the Rocky Mountains, implicating decadal-scale latitudinal shifts of winter storm tracks thought to be determined by these pressure systems (Pederson et al., Reference Pederson, Gray, Woodhouse, Betancourt, Fagre, Littell, Watson, Luckman and Graumlich2011b). North Pacific sea-surface temperatures (SSTs) control the modes of atmospheric circulation and the strength and latitudinal position of winter storm tracks (Pederson et al., Reference Pederson, Gray, Woodhouse, Betancourt, Fagre, Littell, Watson, Luckman and Graumlich2011b). Additionally, a warm North Pacific can increase atmospheric water vapor and thus influence the delivery of moisture to North America during atmospheric river events. These events can change in intensity, frequency, and/or location, and contribute ~35% of the annual precipitation in the inland mountains of western Montana (Gershunov et al., Reference Gershunov, Shulgina, Ralph, Lavers and Rutz2017).
Evidence for large changes in the hydroclimatological regime in the Inland Northwest consists of late Holocene forest changes, including the expansion of disjunct populations of western hemlock (Tsuga heterophylla) and mountain hemlock (T. mertensiana) in the interior mountains from Idaho to northern British Columbia (Gavin, Reference Gavin2009; Herring et al., Reference Herring, Gavin, Dobrowski, Fernandez and Hu2017); evidence of glacier expansion (Menounos et al., Reference Menounos, Osborn, Clague and Luckman2009; Larsen et al., Reference Larsen, Crump and Blumm2020; Chellman et al., Reference Chellman, Pederson, Lee, McWethy, Puseman, Stone, Brown and McConnell2021); lake formation (Schweger and Hickman, Reference Schweger and Hickman1989; Liefert and Shuman, Reference Liefert and Shuman2020); and lake-level changes (Stone and Fritz, Reference Stone and Fritz2006; Shuman et al., Reference Shuman, Henderson, Colman, Stone, Fritz, Stevens, Power and Whitlock2009; Galloway et al., Reference Galloway, Lenny and Cumming2011). Most proxy records in the northern Rocky Mountains indicate a mid- to late Holocene increase in moisture (Hermann et al., Reference Hermann, Oster and Ibarra2018; Liefert and Shuman, Reference Liefert and Shuman2020), continuing an increase in annual moisture driven by long-term changes in insolation and greenhouse gas concentrations during the Holocene (Bartlein et al., Reference Bartlein, Anderson, Anderson, Edwards, Mock, Thompson, Webb, Webb III and Whitlock1998; Kutzbach et al., Reference Kutzbach, Gallimore, Harrison, Behling, Selin and Laarif1998; Diffenbaugh et al., Reference Diffenbaugh, Ashfaq, Shuman, Williams and Bartlein2006; Routson et al., Reference Routson, McKay, Kaufman, Erb, Goosse, Shuman, Rodysill and Ault2019). However, northern Washington and British Columbia appear to have experienced declining moisture (Galloway et al., Reference Galloway, Lenny and Cumming2011; Steinman et al., Reference Steinman, Nelson, Abbott, Stansell, Finkenbinder and Finney2019), calling in to question the ubiquity of broader regional trends in moisture at sites in the Inland Northwest.
Here, we evaluate how the hydroclimate of the Inland Northwest has varied over the past 7600 years in response to late Holocene warming in the northeastern Pacific (Barron et al., Reference Barron, Heusser, Herbert and Lyle2003), the strengthening of the Aleutian Low (Barron and Anderson, Reference Barron and Anderson2011), possible decreases in upper-level ridging off the coast of the Pacific Northwest (Hermann et al., Reference Hermann, Oster and Ibarra2018), potential reductions in atmospheric river frequency in the Pacific Northwest (Skinner et al., Reference Skinner, Lora, Payne and Poulsen2020), and the increasing equator-to-pole temperature gradient (Routson et al., Reference Routson, McKay, Kaufman, Erb, Goosse, Shuman, Rodysill and Ault2019). We focus on the water-level history of Silver Lake, Montana in the northern Bitterroot Mountains along the Montana–Idaho border to examine the hydrologic history of high elevations in Idaho and northwest Montana that are most affected at present by inland penetration of atmospheric rivers (Rutz et al., Reference Rutz, Steenburgh and Ralph2014). The site lies 130 km southwest of Foy Lake, which has had a previous lake-level reconstruction produced (Shuman et al., Reference Shuman, Henderson, Colman, Stone, Fritz, Stevens, Power and Whitlock2009), and is situated near the locations of several paleoecological studies (Whitlock and Bartlein, Reference Whitlock and Bartlein1993; Brunelle et al., Reference Brunelle, Whitlock, Bartlein and Kipfmueller2005, Reference Brunelle, Rehfeldt, Bentz and Munson2008; Stone and Fritz, Reference Stone and Fritz2006; Power et al., Reference Power, Whitlock, Bartlein and Stevens2006, Reference Power, Whitlock and Bartlein2011; Whitlock et al., Reference Whitlock, Marlon, Briles, Brunelle, Long and Bartlein2008; Herring and Gavin, Reference Herring and Gavin2015; Herring et al., Reference Herring, Gavin, Dobrowski, Fernandez and Hu2017). To reconstruct hydroclimatic changes at Silver Lake during the Holocene, we conducted geophysical surveys, and collected sediment cores across a transect encompassing a range of water depths to identify past changes in shoreline position. The lake-level reconstruction adds to the spatial coverage of paleohydrology records from the Inland Northwest, allowing us to evaluate potential Holocene climate forcings on the Inland Northwest hydroclimate.
STUDY SITE
Silver Lake (47.3596°N, 115.565912°W, 1623 m asl 5.26 ha area) occupies a basin along the ridgeline of the Montana–Idaho border in the northern Bitterroot Mountains southwest of Lookout Pass (Fig. 1). The lake lies in a Late Pleistocene cirque and is dammed by a glacial moraine (Locke, Reference Locke1990). Silver Lake has a maximum depth of 18.8 m, an ~100-ha watershed with no significant input streams, and a seasonal outlet stream on the north side of the cirque. Within the lake, a bathymetric shelf located at the mouth of the outflow stream creates a shallow bay that we targeted for our analyses. The high topographic location of the lake limits regional groundwater input. Silver Lake lies on the Proterozoic-aged Wallace Formation, which is dolomitic siltite and quartzite capped by black argillite, and locally is intersected by a diorite and gabbro dike (Lonn and McFaddan, Reference Lonn and McFaddan1999). Glacial tills cover the Wallace Formation meta-sediments, and are vegetated by subalpine forest, including subalpine fir (Abies lasiocarpa), Engelmann spruce (Picea engelmannii), lodgepole pine (Pinus contorta), and mountain hemlock.
The Silver Lake watershed has a winter-dominated precipitation regime with >180 mm of precipitation per month from November through January based on the 1981–2010 climate normals (Fig. 2; PRISM Climate Group, 2021). The watershed receives only ~ 60 mm of precipitation per month in the driest months of July and August. The winter precipitation regime at Silver Lake contrasts with low-elevation areas to the east, such as Foy Lake, which receives less precipitation, ranging from a low of 20 mm in February to a high of 60 mm in June (Fig. 2). The present climate of Silver Lake places it within the greater Pacific Northwest region, which received over 2.5 mm of precipitation per day on average from 1981 to 2010 (Fig. 1; Kalnay et al., Reference Kalnay, Kanamitsu, Kistler, Collins, Deaven, Gandin and Iredell1996).

Figure 2. Graphs comparing PRISM 800-m resolution, 30-year precipitation (upper) and temperature (lower) normals (1981–2010) for Silver Lake and Foy Lake (PRISM Climate Group, 2021).
Silver Lake lies directly within the region with the greatest frequency of interior-penetrating atmospheric river events (Rutz et al., Reference Rutz, Steenburgh and Ralph2015), and marks the easternmost latitude experiencing a surplus of January moisture, characteristic of the Pacific Northwest, as indicated by high values of actual evaporation/potential evaporation (AE/PE; Shinker and Bartlein, Reference Shinker and Bartlein2010). Around Silver Lake, AE/PE values are ~0.8 from October–May, and drop to ~0.4 in July and August, indicating late summer evaporative stress (Shinker and Bartlein, Reference Shinker and Bartlein2010).
METHODS
Fieldwork
We used a Geophysical Survey Systems, Inc. SIR-3000 ground-penetrating radar (GPR) with 400-MHz antennae in 2017 to evaluate the location of paleoshorelines that appear as reflectors beneath the lake sediment surface. Based on the GPR surveys, we selected a coring transect perpendicular to shoreline to capture a continuous stratigraphic sequence of paleoshoreline changes as demonstrated in previous studies (Shuman, Reference Shuman2003; Newby et al., Reference Newby, Shuman, Donnelly, Karnauskas and Marsicek2014; Shuman et al., Reference Shuman, Pribyl and Buettner2015). A transect of sediment cores was collected at Silver Lake between 20 m to 42 m from shore in water depths ranging from 2.3 m to 3.3 m. The cores were taken in the shallow bay near the lake outlet and labeled to indicate lateral distance from the shore. The cores were targeted to capture paleoshoreline deposits and erosional features associated with reflectors in the GPR images (Digerfeldt, Reference Digerfeldt and Berglund1986; Harrison and Digerfeldt, Reference Harrison and Digerfeldt1993; Pribyl and Shuman, Reference Pribyl and Shuman2014). Cores were recovered by hand with a 7-cm-diameter piston corer using polycarbonate tubing lowered from a raft along the transect.
Core analyses
At the University of Wyoming, we logged the cores using a Geotek, Ltd. Multi-Sensor Core Logger in our lab to obtain gamma-attenuation bulk density and magnetic susceptibility, then subsampled the cores at 1-cm contiguous intervals to measure sand and organic content. Sand and organic content can differentiate sediments that accumulated in the high-energy depositional environments of shallow shoreline areas from deep-water organic muds that accumulated offshore in still water below the thermocline (Digerfeldt, Reference Digerfeldt and Berglund1986; Rowan et al., Reference Rowan, Kalff and Rasmussen1992; Harrison and Digerfeldt, Reference Harrison and Digerfeldt1993). We wet-sieved the samples using 63-μm mesh to measure sand content, and performed loss-on-ignition analyses using standard techniques to estimate sediment organic content (Shuman, Reference Shuman2003).
To determine the timing of facies changes at Silver Lake, we obtained radiocarbon dates on sedimentary charcoal and plant macrofossils (conifer needles) from the cores. We picked charcoal and macrofossils for radiocarbon analyses from core intervals that bracketed sand layers (inferred to be paleoshoreline deposits) after wet-sieving 1-cm-thick subsamples using a 125-μm mesh. Because the materials were picked from organic-rich profundal mud intervals, they were not significantly affected by lake mixing or sediment reworking. Samples were analyzed at the Keck Carbon AMS Laboratory at the University of California, Irvine. We calibrated the radiocarbon ages to calendar years using IntCal20 (Reimer et al., Reference Reimer, Austin, Bard, Bayliss, Blackwell, Bronk Ramsey and Butzin2020) with the R Package Bchron (Parnell, Reference Parnell, McJames, Wundervald, Murphy, Maia, Shoari Nejad and Goh2021). The ages are presented as calibrated years before AD 1950 (hereafter, cal yr BP). In addition to radiocarbon dates, we used visual inspection and magnetic susceptibility measurements to identify tephra layers within the cores. From our samples, we separated tephras by hand that were then analyzed by an electron microprobe at the Peter Hooper GeoAnalytical Laboratory School at Washington State University. The glass shards from the samples were analyzed to identify % SiO2, Al2O3, Fe2O3, TiO2, Na2O, K2O, MgO, CaO, and Cl. The accepted age of identified tephras was assigned to our samples. Bchron was then used to develop age–depth models for each core based on the combination of radiocarbon and tephra ages.
Lake-level reconstruction
We reconstructed the lake-level history at Silver Lake using a decision-tree approach in R to iteratively classify every 1-cm sample from all four cores as littoral, sublittoral, or profundal based on the percentage of sand in each core. Reconstructing multiple iterations of lake-level change using varying facies definitions provides uncertainty estimates around the reconstruction. Samples were classified as shallow littoral sediments when sand content exceeded 15–40%, at 5% intervals. Samples were denoted as representing deep-water conditions when sand content fell below 5–15%, at 1% intervals. Core classification was conducted iteratively based on all possible combinations of the two thresholds. For each iteration, we used the resulting classification of each sample in each core, the age-depth models, and the depth of each sample below the modern water level to reconstruct the elevation of the littoral-profundal boundary through time; the final reconstruction represents the median and 95% distribution of the different iterations (Pribyl and Shuman, Reference Pribyl and Shuman2014; Shuman and Serravezza, Reference Shuman and Serravezza2017).
RESULTS
GPR surveys
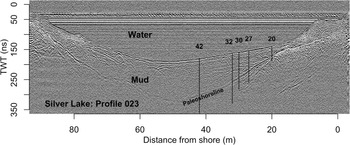
GPR surveys at Silver Lake revealed stratified lacustrine sediments draped across the shallow outlet bay (Fig. 3). Within 10 m of the modern shoreline, the sediment sequence contained a chaotic set of reflectors indicative of piles of woody debris that have accumulated along the lake margin. Farther than 10 m from the shoreline, the sediments were more uniform but one major reflector pair truncated the dipping beds and created a near-shore unconformity consistent with low water (Fig. 3). As illustrated in Figure 3, the reflector pair appeared as two parallel white reflectors extending out from shore, which became faint in the deepest areas. The stratified reflectors at the top of the lake-sediment sequence lapped (intercepted at different points) on to the unconformity between 20 and 30 m from shore (Fig. 3).

Figure 3. A ground-penetrating radar (GPR) profile from Silver Lake showing the near-shore truncation of sediment layers consistent with past low-water episodes. Vertical scale shows the two-way travel time (TWT) of the radar signal in nanoseconds (ns). Vertical bars show locations of cores 20, 27, 30, 32, and 42 that labeled indicating distance from the lake shore in meters. Sedimentological analyses were performed on cores 42, 32, 30, and 27. A reflective layer below the sediment–water interface indicates a paleoshoreline that interrupts both underlying and upper, onlapping sediment units.
Stratigraphy
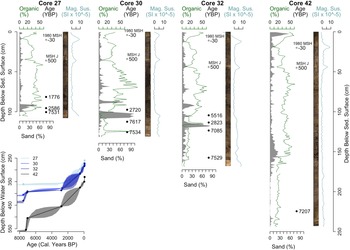
Cores were collected 42 m, 32 m, 30 m, 27 m, and 20 m from shore to intersect the major reflector and unconformity in the GPR profile (Fig. 3). The cores were collected in 233 cm, 260 cm, 280 cm, 273 cm, and 330 cm of water, respectively (Table 1). Core 20 was not analyzed in detail because radiocarbon dating indicated it only captured the most recent high-water phase of the lake's history (see below). The remaining cores contained a sequence of organic-rich silts, which included several major units (Fig. 4). All cores deeper than core 27 contained basal silts that were ~20–90 cm thick with <20% organic matter; the thickest basal unit was found in core 42, which was the deepest core. Above the basal silts, a sand-rich layer marked the transition to organic-rich muds, which often contained layers of woody debris. A second sand layer was also evident in cores 30 and 32, which likely correlates stratigraphically with the one sand layer at the base of core 27. The muds above the sands varied in organic content, but typically contained ~40% organic matter, except in the debris intervals that reached >60% organic matter, for example, as recorded by peaks in loss-on-ignition in the middle of cores 30 and 32. Two tephra layers, notable as peaks in magnetic susceptibility but also evident upon visually examining all cores, punctuated the uppermost silts in all the cores (Fig. 4). The uppermost silts also are characterized as having a reduced organic content.

Figure 4. Stratigraphic, sedimentological, chemical, and age data for cores 27, 30, 32, and 42 from Silver Lake include evidence of a low-water phase recorded by high sand content (% inorganic >63 μm shaded in gray), low loss-on-ignition at 550°C (as a measure of sediment organic content, green lines), and changes in magnetic susceptibility (blue lines). Digital photo images show the visual stratigraphy and the age-depth relationships in the cores, including mid-Holocene phases of limited accumulation consistent with shallow water based on calibrated radiocarbon ages (black circles) and tephra ages (gray circles) that are also plotted on bottom left graph, where the shading represents the 95% confidence intervals. MSH is Mount St. Helens.
Table 1. Depths and ages from cores 20, 27, 30, 33, and 42 from Silver Lake. Radiocarbon ages are calibrated in IntCal20 (Reimer et al., Reference Reimer, Austin, Bard, Bayliss, Blackwell, Bronk Ramsey and Butzin2020) with the R Package Bchron (Parnell, Reference Parnell, McJames, Wundervald, Murphy, Maia, Shoari Nejad and Goh2021).

*Cal. 05 refers to the 5% confidence interval of the age model.
*Cal. median refers to the median calibrated year before AD 1950 (cal yr BP), which was used to plot the data.
*Cal. 95 refers to the 95% confidence interval of the age model.
The prominent sand layer marked a shift in sediment composition just below 100-cm depth from low to high organic content and high to low magnetic susceptibility in cores 30 and 32. There was also a slight increase in sand content in core 42 at 150-cm depth. Sand content reached >80% in cores 30 and 32, where it was visibly apparent, but only 20% in core 42 (Fig. 4). The second layer of visible sand at 88-cm depth in core 30 and 92-cm depth in core 32 may correspond to the sand layer near the bottom of core 27 that reached 50% sand content. The second sand layer did not extend to core 42, which is consistent with the reflector in the GPR data near core locations 32–27 that truncated the underlying stratigraphy as it merged with the lower paleoshoreline reflector at ~ 27–25 m from shore, and disappeared about 35 m from shore (Fig. 3).
Radiocarbon stratigraphy
Ten radiocarbon dates from macrofossils and charcoal resulted in ages younger than 8000 cal yr BP after calibration (Table 1, Fig. 4). Samples taken near the base of the cores dated consistently to 7210–7530 cal yr BP (median ages), except for the basal sample from core 20 that dated to 2350 cal yr BP (Table 1). Samples below the major sand layer in cores 30 and 32 have median ages of 7620 and 7090 cal yr BP, although the former appears out of stratigraphic order. Samples above the sand layer, 10 cm and 15 cm stratigraphically higher in cores 30 and 32, respectively, date to median ages of 2820 and 2720 cal yr BP. Consequently, the accumulation of mud on top of the sand layer in cores 32 and 30 and near the bottom of cores 27 and 20 appeared to follow a time-transgressive sequence from deep to shallow cores at 2820, 2720, 2590, and 2350 cal yr BP (median ages). Ages from core 27 constrained the age of the second sand layer as between 2590 and 1780 cal yr BP.
The net sedimentation rates associated with the sand layers in cores 32 and 30 were also exceptionally low: 2.3–5.8 cm/kyr (Fig. 4). After ca. 2300 cal yr BP, all cores accumulated at rates of 25.4–51.5 cm/kyr, which is consistent with the high rates of accumulation below the sand layers of 28.4–76.5 cm/kyr (Fig. 4).
Two radiocarbon ages, one in core 30 and one in core 32, were not in stratigraphic order and thus not included in the age-depth model. The radiocarbon age from the bottom of core 27 (median age: 7530 cal yr BP) also was not included because it represented a period of near-zero sediment accumulation before ca. 2700 cal yr BP.
Additional age constraints were provided in every core through the identification of the two ash layers of known age (Fig. 4; Table 2). Based on its geochemical composition, the most recent tephra was identified as being from the AD 1980 Mount St. Helens eruption, and the tephra below was identified as being from the Mount St. Helens J eruption at ca. 500 cal yr BP (Table 2). The basal radiocarbon dates from the cores are about the age of the Mazama Ash, although we did not conduct a chemical analysis of the basal sediment. Deep-water cores from the center of Silver Lake, not discussed here, penetrate the Mazama Ash to produce a longer record (unpublished data).
Table 2. Glass composition of tephra layers in weight % oxides normalized to 100%, and probable ages of volcanic eruptions. MSH: Mount St. Helens.

Evidence of low-water phases
Qualitative interpretation of the sediment core stratigraphies indicated substantial water-level changes in the past. The combined lines of evidence from continuous GPR reflectors blanketing the lake, sand layers that were traceable across the transect of near-shore cores, and congruent radiocarbon dates confirming low sedimentation rates associated with the sands, indicate a series of water-level changes at Silver Lake. First, a phase of high water (7600–7000 cal yr BP) initiated the accumulation of the basal silts in cores 42, 32, and 30 (Fig. 4). Second, truncated GPR reflectors, sand layers, and low net sedimentation rates between ~7000 and 2800 cal yr BP indicate a major, mid-Holocene low-water phase. The time-transgressive deposition of organic-rich mud above the sand layer in cores 32, 30, and 27 is consistent with the shoreward onlap of GPR reflectors, and indicates a progressive rise in water level from ca. 2800–2300 cal yr BP. This water-level rise initiated accumulation in cores 27 and 20 after ca. 2500 cal yr BP. The second sand layer present in cores 30 and 32 may indicate an additional low-water phase sometime between ca. 2300–1800 cal yr BP; however, additional radiocarbon dates are needed to verify the timing of this second low-water phase. Finally, after 1800 cal yr BP, the lake likely remained sufficiently high to overflow at least seasonally, as occurs at present.
Quantitative water-level reconstruction
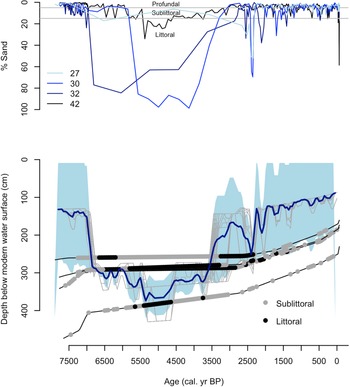
The iterations of lake-level reconstructions with varying thresholds resulted in an ensemble of quantified lake-level histories that are consistent with the qualitative interpretation (Fig. 5). The reconstructed elevation of past water levels indicated changes as great as 300 cm during the past 7600 years. From the beginning of our core record to 7000 cal yr BP, the reconstructed lake level was likely near the modern lake level. The lake then experienced a persistent low phase about 300 cm below the modern lake level from 7000 to 2800 cal yr BP before rising ~200 cm after ca. 2750 cal yr BP. The second sand layer in cores 27, 30, and 32 may indicate another multi-meter fluctuation at ca. 2300 cal yr BP, but the duration of this low phase is only constrained by two radiocarbon dates. After 1800 cal yr BP, the lake level slowly increased to its modern elevation, which is higher than all previous reconstructed water levels, and consistent with the onset of deposition in cores 27 and 20. Because the lake overflows at its current level, it was not possible to determine whether any periods represented wetter conditions than at present.

Figure 5. Graphs of % sand and depth below modern water surface versus age for four cores from Silver Lake. Top graph: % sand from cores 27, 30, 32, and 42 plotted versus time with thresholds of % sand used for classifying sediment samples as representing littoral, sublittoral, and profundal environments indicated. Bottom graph: Age-depth relationships: sand data constrain the reconstructed position of the ‘sediment limit’ (sand–mud boundary) through time based on the elevation of littoral and sublittoral sediments below the modern lake surface (colored circles). The ensemble mean estimate of the sediment limit position, which represents the changing position of the shoreline, is shown as a blue line with light blue shading indicating the range of uncertainty; individual reconstructions in each ensemble shown in gray.
DISCUSSION
Comparisons to regional paleoclimate
Paleovegetation records from sites near Silver Lake support the inference of a transition from a dry Mid-Holocene to a wet late Holocene. Mesophilic conifers, such as mountain hemlock and western larch (Larix occidentalis), expanded and increased in abundance in the northern Bitterroot Mountains over the late Holocene (Herring et al., Reference Herring, Gavin, Dobrowski, Fernandez and Hu2017). Mountain hemlock appeared 1000 km south of Silver Lake at Horseshoe Lake and Rocky Ridge Lake by 4100 and 1600 cal yr BP, respectively, and was present just 30 km south of Silver Lake at Dismal Lake by 800 cal yr BP (Herring et al., Reference Herring, Gavin, Dobrowski, Fernandez and Hu2017). Before 3300 cal yr BP, Mid-Holocene macrofossils document a drier, less diverse forest than found today at Dismal Lake, dominated by Grand fir (Abies grandis) and Douglas fir (Pseudotsuga menziesii) (Herring et al., Reference Herring, Gavin, Dobrowski, Fernandez and Hu2017). Likewise, in the southern Bitterroot and adjacent Clearwater ranges, the development of a modern forest composition by 3000 cal yr BP and an increase in arboreal pollen at Burnt Knob, Baker, and Pintlar lakes from the mid- to late Holocene suggests higher moisture in the Late Holocene compared to the mid-Holocene (Brunelle et al., Reference Brunelle, Whitlock, Bartlein and Kipfmueller2005). Farther south at Lower Decker Lake in the Sawtooth Range of central Idaho, pollen evidence of closed-canopy Douglas fir forest was also used to infer the driest period of the Holocene from 5500 to 3380 cal yr BP (Whitlock et al., Reference Whitlock, Briles, Fernandez and Gage2011).
Our lake-level reconstruction is also consistent with the history of Foy Lake, Montana, which has been extensively studied on annual to millennial timescales in the Holocene (Stone and Fritz, Reference Stone and Fritz2004, Reference Stone and Fritz2006; Stevens et al., Reference Stevens, Stone, Campbell and Fritz2006; Power et al., Reference Power, Whitlock, Bartlein and Stevens2006, Reference Power, Whitlock and Bartlein2011; Shuman et al., Reference Shuman, Henderson, Colman, Stone, Fritz, Stevens, Power and Whitlock2009; Bracht-Flyr and Fritz, Reference Bracht-Flyr and Fritz2012; Schoenemann et al., Reference Schoenemann, Martin, Pederson and McWethy2020). Near-shore cores at Foy Lake indicate reduced near-shore sand deposition during a brief high-water phase at ca. 7600 cal yr BP, and a prolonged mid-Holocene low stand represented by high sand deposition (Shuman et al., Reference Shuman, Henderson, Colman, Stone, Fritz, Stevens, Power and Whitlock2009). Sand deposition in deep areas of the lake is thus recorded at both lakes from ca. 7000–2800 cal yr BP. At Foy Lake, the onset of varve formation over the shallow water sands after ca. 2500 cal yr BP supports the inferred late Holocene increase in effective moisture (Shuman et al., Reference Shuman, Henderson, Colman, Stone, Fritz, Stevens, Power and Whitlock2009), consistent with the expansion of Silver Lake as marked by the basal age of 2346–2416 cal yr BP in core 20 (Table 1). A benthic diatom record from Foy Lake exhibited a sharp decline in benthic diatom abundance at ca. 2000 YPB, which indicated a deepening of Foy Lake in response to wetter conditions in the late Holocene (Figure 6C; Stone and Fritz, Reference Stone and Fritz2006). The gradual decrease in xeric (Pinus contorta, Pinus ponderosa, Pseudotsuga, Larix, Artemisia, Poaceae, Chenopodiaceae, Cupressaceae) relative to mesic (Abies, Picea, Tsuga heterophylla) pollen taxa measured in a core from the center of Foy Lake from 6000 to 2600 cal yr BP also indicated increasing moisture in the Late Holocene (Fig. 6C; Power et al., Reference Power, Whitlock, Bartlein and Stevens2006, Reference Power, Whitlock and Bartlein2011).

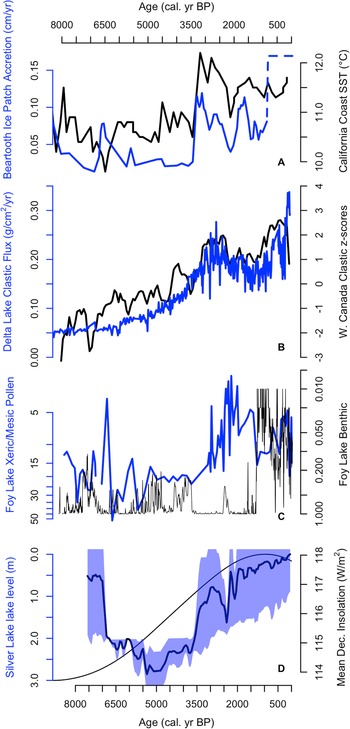
Figure 6. Plots showing different climate proxies versus age (cal yr BP): (A) Beartooth Ice Patch accretion rates from northern Wyoming showing increasing winter precipitation from mid- to late Holocene (blue line; Chellman et al., Reference Chellman, Pederson, Lee, McWethy, Puseman, Stone, Brown and McConnell2021) and an alkenone-based sea surface temperature (SST) reconstruction from off the coast of northern California showing increasing temperatures from the mid- to late Holocene (black line; Barron et al. Reference Barron, Heusser, Herbert and Lyle2003). (B) Average z-scores of the clastic content in lake sediment cores from Western Canada indicating glacial advances from mid- to late Holocene (black line; Menounos et al., Reference Menounos, Osborn, Clague and Luckman2009) and flux of clastic material into Delta Lake in the Teton Range in Wyoming, which is also used as a proxy for glacial advance (blue line; Larsen et al., Reference Larsen, Crump and Blumm2020). (C) Plotted on inverted log scales are the ratio of xeric (Pinus contorta, Pinus ponderosa, Pseudotsuga, Larix, Artemisia, Poaceae, Chenopodiaceae, Cupressaceae) to mesic (Abies, Picea, Tsuga heterophylla) pollen taxa measured in a core from the middle of Foy Lake (blue line; Power et al., Reference Power, Whitlock, Bartlein and Stevens2006, Reference Power, Whitlock and Bartlein2011), and % benthic diatoms from Foy Lake (black line; Stone and Fritz, Reference Stone and Fritz2006), indicating increasing moisture from mid- to late Holocene. (D) Our lake-level reconstruction from Silver Lake (blue line) shows a highstand from 7600 to 7000 cal yr BP, then a persistent lowstand from 7000 to 2800 cal yr BP, followed by a gradual increase to the modern highstand. Back line shows mean December insolation latitude of Silver Lake (47°N).
An aragonite:calcite record from Jones Lake, located in west-central Montana, also reflects a wet late Holocene with modern, high-moisture conditions established at ca. 1400 cal yr BP (Shapley et al., Reference Shapley, Ito and Donovan2009). Diatom assemblages from elsewhere in Montana suggest similar hydroclimate histories. At Hidden Lake in northwest Montana, the diatom record indicates similar to modern lake levels before 7610 cal yr BP, lower than modern lake levels from 6180 and 4130 cal yr BP, and modern lake levels after 1400 cal yr BP (Stone et al., Reference Stone, Saros and Spanbauer2019). Diatom data from Upper Kintla, Beauty, and Emerald lakes elsewhere in the Bitterroot Mountains reveal changes in lake stratification, which can be dependent on the strength of the Aleutian Low, with increased lake mixing when the Aleutian Low weakens and shifts westward (Stone et al., Reference Stone, Saros and Pederson2016). Stone et al. (Reference Stone, Saros and Pederson2016) inferred decreased storm frequencies across the Pacific Northwest between 4500 and 3300 cal yr BP, increased frequencies between 3200 and 1400 cal yr BP, then a decline from 1300 cal yr BP to present. More work is needed to assess the relationship between the strength of the Aleutian Low and changes in precipitation and the net effective moisture of the region, but changes in the tracks, frequency, or water-vapor content of storms originating from the Pacific Ocean were likely significant influences (Skinner et al., Reference Skinner, Lora, Payne and Poulsen2020).
Other hydroclimatic reconstructions provide support for broad-scale increases in precipitation from the Mid- to Late Holocene across the Inland Northwest and adjacent regions. Lake-level records spanning the Rocky Mountains from Colorado to Canada reveal increasing water levels over the past 8000 years (Shuman et al., Reference Shuman, Henderson, Colman, Stone, Fritz, Stevens, Power and Whitlock2009; Shuman and Serravezza, Reference Shuman and Serravezza2017; Liefert and Shuman, Reference Liefert and Shuman2020). Evidence of glacial advances from Wyoming to Canada also indicate increased precipitation and cooler conditions in the past 3000 years relative to earlier in the Holocene (Fig. 6; Menounos et al., Reference Menounos, Osborn, Clague and Luckman2009; Larsen et al., Reference Larsen, Crump and Blumm2020; Chellman et al., Reference Chellman, Pederson, Lee, McWethy, Puseman, Stone, Brown and McConnell2021). For example, increasing rates of ice accumulation at the Beartooth Ice Patch in northwestern Wyoming reflect an increase in precipitation and decrease in temperature after ca. 4000 cal yr BP (Fig. 6A; Chellman et al., Reference Chellman, Pederson, Lee, McWethy, Puseman, Stone, Brown and McConnell2021). In northwestern Wyoming, increasing input of clastic sediment into Delta Lake indicates expansion of adjacent glaciers starting at ca. 6300 cal yr BP and continuing until 2800 cal yr BP (Fig. 6B; Larsen et al., Reference Larsen, Crump and Blumm2020). A principal component analysis performed on loss-on-ignition data from Green, lower Joffre, Diamond, and Red Barrel lakes in western Canada was also used to infer glacial advances since 8500 cal yr BP (Fig. 6B; Menounos et al., Reference Menounos, Osborn, Clague and Luckman2009).
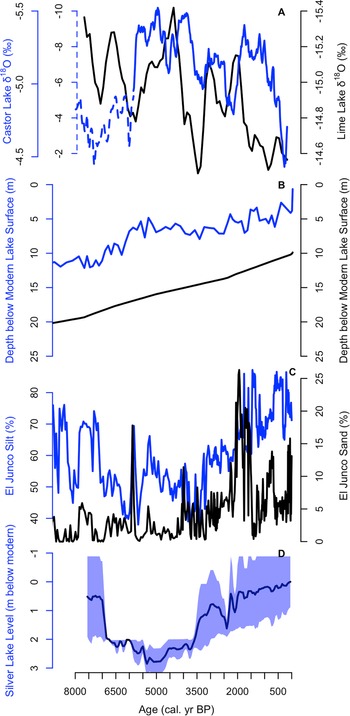
However, other data indicate opposite trends in northern Washington and southern British Columbia. At Castor and Lime lakes in northeast Washington, carbonate δ18O exhibits long-term increases from the Mid- to Late Holocene, consistent with either reduced winter precipitation or increased evaporation since ca. 5000 cal yr BP (Fig. 7A; Nelson et al., Reference Nelson, Abbott, Steinman, Polissar, Stansell, Ortiz, Rosenmeier, Finney and Riedel2011; Steinman et al., Reference Steinman, Pompeani, Abbott, Ortiz, Stansell, Finkenbinder, Mihindukulasooriya and Hillman2016, Reference Steinman, Nelson, Abbott, Stansell, Finkenbinder and Finney2019; Routson et al., Reference Routson, Kaufman, McKay, Erb, Arcusa, Brown and Kirby2021). The Lime and Castor lakes δ18O records differ from one another at centennial scales, and the variations must record different dynamics than those indicated by the Silver Lake sedimentary record. For example, Steinman et al. (Reference Steinman, Nelson, Abbott, Stansell, Finkenbinder and Finney2019) found high δ18O values and inferred a 300-yr-long dry interval at Castor Lake in north-central Washington at ca. 7290 cal yr BP, after the eruption of Mt. Mazama, when the water levels at Silver, Foy, and Hidden lakes appear higher than during the Mid-Holocene (Fig. 7A; Shuman et al., Reference Shuman, Henderson, Colman, Stone, Fritz, Stevens, Power and Whitlock2009; Stone et al., Reference Stone, Saros and Spanbauer2019). Anderson et al. (Reference Anderson, Berkelhammer, Barron, Steinman, Finney and Abbott2016) characterized Castor Lake as indicating potential evaporation, and Lime Lake as capturing the isotopic composition of precipitation received by the lake. Therefore, both δ18O records could differ from the sedimentary evidence of lake-level changes dependent on net effective moisture. Furthermore, a δ18O record from Jellybean Lake in Yukon Territory highlights potential effects from changes in atmospheric circulation processes during the Holocene (Anderson et al., Reference Anderson, Berkelhammer, Barron, Steinman, Finney and Abbott2016) that may also have affected the isotopic records at Castor and Lime lakes, and could amplify the differences in hydroclimate interpretations among records.

Figure 7. Plots showing different climate proxies versus age (cal yr BP): (A) δ18O records from Castor Lake in north-central Washington (solid black line; Steinman et al., Reference Steinman, Nelson, Abbott, Stansell, Finkenbinder and Finney2019; Nelson et al., Reference Nelson, Abbott, Steinman, Polissar, Stansell, Ortiz, Rosenmeier, Finney and Riedel2011; dashed line is extended data from Routson et al., Reference Routson, Kaufman, McKay, Erb, Arcusa, Brown and Kirby2021) and Lime Lake in northeast Washington (blue line; Steinman et al., Reference Steinman, Pompeani, Abbott, Ortiz, Stansell, Finkenbinder, Mihindukulasooriya and Hillman2016) plotted as 400-yr moving averages, indicating decreasing winter precipitation or increasing evaporation from mid- to late Holocene. (B) Diatom-based lake-level reconstruction from Felker Lake in British Columbia plotted (blue line) after adjusting to account for the changing elevation of the sediment–water interface (black line; Galloway et al., Reference Galloway, Lenny and Cumming2011). (C) Black line shows % silt; blue line shows % sand from El Junco Lake in the Galápagos, indicating increasing El Niño–Southern Oscillation frequency from mid- to late Holocene (Conroy et al., Reference Conroy, Overpeck, Cole, Shanahan and Steinitz-Kannan2008). (D) Silver Lake lake-level reconstruction with the line showing the median reconstructed lake level and the blue envelope representing the range of uncertainty (this study).
The wetter mid-Holocene inferred at Castor and Lime lakes is consistent with the interpretation of a diatom-based water-depth reconstruction from Felker Lake in British Columbia (Galloway et al., Reference Galloway, Lenny and Cumming2011). Galloway et al. (Reference Galloway, Lenny and Cumming2011) inferred that the diatom-based water depths in the Mid-Holocene (6500–5000 cal yr BP) were greater than at present at Felker Lake. However, they did not consider that sediment infilling reduced the depth of Felker Lake by 9.5 m since the time of the Mazama Ash eruption. We adjusted the inferred water depth at Felker Lake by adding the elevation of the sediment-water interface to produce a record of the water-surface elevation comparable with our Silver Lake reconstruction. This revised reconstruction for Felker Lake indicates that the water-surface elevation of the lake was >4 m lower during the mid-Holocene than at present after accounting for the lower than modern sediment elevation at that time (Fig. 7B). A subsequent rise in the water levels of Felker Lake would be consistent with the histories of Silver and Foy lakes, and records of glacial advance and pollen-based paleoclimatic inferences from nearby sites in British Columbia (Menounos et al., Reference Menounos, Osborn, Clague and Luckman2009; Gavin et al., Reference Gavin, Henderson, Westover, Fritz, Walker, Leng and Hu2011), although the Felker Lake diatom record supports an earlier increase in water levels at ca. 6000 cal yr BP. Consistent with the overall rise in effective moisture in the revised Felker Lake reconstruction, Gavin et al. (Reference Gavin, Henderson, Westover, Fritz, Walker, Leng and Hu2011) interpreted decreases in birch (Betula) coupled with increases in western hemlock (T. heterophylla) from the Mid- to Late Holocene at Eleanor Lake in British Columbia as indicative of increasing winter precipitation, suggesting a widespread shift to cooler, wetter conditions.
Climatic controls on the regional hydroclimatic changes
Overall, the long-term increases in precipitation in the Inland Northwest inferred from lake levels, glacial advances, ice-patch accretion, and paleobotanical records likely reflect orbitally forced changes in insolation. For example, Routson et al. (Reference Routson, McKay, Kaufman, Erb, Goosse, Shuman, Rodysill and Ault2019) pointed to the insolation-driven decrease in the latitudinal temperature gradient between the equator and the Arctic to explain decreased precipitation in midlatitudes, including the Inland Northwest, during the Mid-Holocene. As Arctic summer insolation peaked at about 10 ka, followed by peak summer warmth at about 7 kyr, a reduced temperature gradient weakened midlatitude westerly wind flow and cyclones, resulting in decreased midlatitude precipitation, including that associated with the flow of Pacific moisture into the Inland Northwest (Routson et al., Reference Routson, McKay, Kaufman, Erb, Goosse, Shuman, Rodysill and Ault2019). Regionally, some climate models respond to mid-Holocene forcing by producing anticyclonic wind anomalies and upper-level ridging that reduce winter water-vapor transport from the central Pacific (Hermann et al., Reference Hermann, Oster and Ibarra2018). Increasing winter insolation throughout the Holocene may have favored atmospheric circulation and water vapor trends consistent with increased winter precipitation while declining summer insolation may have directly reduced evaporation, leading to the inferred hydrological change in the Inland Northwest (Whitlock et al., Reference Whitlock, Briles, Fernandez and Gage2011; Liefert and Shuman, Reference Liefert and Shuman2020).
Changes in atmospheric river events may have occurred within this synoptic framework of strengthening midlatitude westerly wind flow from the mid-Holocene to late Holocene, allowing atmospheric river events to either increase in frequency or intensity in western Montana from the mid- to late Holocene. Atmospheric river events, defined as long (>2000 km) and narrow (<1000 km) regions with an integrated water vapor content >20 mm play an important role in the present-day precipitation regime of western North America (Rutz et al., Reference Rutz, Steenburgh and Ralph2015). The greatest number of interior-penetrating atmospheric river events currently follows a trajectory from Oregon through Idaho into northwest Montana (Rutz et al., Reference Rutz, Steenburgh and Ralph2015). Along the Montana–Idaho border, ~35% of annual precipitation is related to atmospheric rivers (Gershunov et al., Reference Gershunov, Shulgina, Ralph, Lavers and Rutz2017), which would make the regional hydroclimate and the water-level histories of lakes potentially sensitive to changes in the frequency or intensity of these meteorological-scale events (Lora et al., Reference Lora, Mitchell, Risi and Tripati2017; Skinner et al., Reference Skinner, Lora, Payne and Poulsen2020). The frequency of such events and the amount of winter precipitation that they bring depend upon SST variations and the attendant pressure systems in the Pacific Ocean (Cayan, Reference Cayan1996; Dettinger et al., Reference Dettinger, Cayan, Diaz and Meko1998; Gershunov et al., Reference Gershunov, Shulgina, Ralph, Lavers and Rutz2017; Kim et al., Reference Kim, Zhou and Alexander2019). Diatom-inferred changes in storm frequencies may indicate changes in such events during the late-Holocene (Stone et al., Reference Stone, Saros and Pederson2016).
The modern hydrologic significance of atmospheric river events for western Montana may have been established during late Holocene (Rutz et al., Reference Rutz, Steenburgh and Ralph2014, Reference Rutz, Steenburgh and Ralph2015; Corringham et al., Reference Corringham, Ralph, Gershunov, Cayan and Talbot2019), but simulations from Community Earth System Model version 1.2 (CESM1.2) by Skinner et al. (Reference Skinner, Lora, Payne and Poulsen2020) indicated decreasing, not increasing, atmospheric river precipitation from the mid- to late Holocene in the Pacific Northwest. The CESM1.2 produces a drier mid-Holocene relative to pre-Industrial conditions in most of the United States, and a simulated northward shift in the location of the majority of atmospheric rivers in the Mid-Holocene that reduced precipitation in the region centered around 50°N (Skinner et al., Reference Skinner, Lora, Payne and Poulsen2020). The decreasing atmospheric river activity from the mid- to late Holocene in the Pacific Northwest, particularly in winter (Skinner et al., Reference Skinner, Lora, Payne and Poulsen2020), could explain why the records from Lime Lake and Castor Lake in northern Washington show a wet Mid-Holocene relative to the late Holocene, in contrast to the hydrologic changes at the more southerly Silver Lake location (Steinman et al., Reference Steinman, Pompeani, Abbott, Ortiz, Stansell, Finkenbinder, Mihindukulasooriya and Hillman2016, Reference Steinman, Nelson, Abbott, Stansell, Finkenbinder and Finney2019). However, the simulations are not consistent with the corrected sediment accumulation lake-level record from Felker Lake (Fig. 7B) or the paleobotanical record from British Columbia (Gavin et al., Reference Gavin, Henderson, Westover, Fritz, Walker, Leng and Hu2011), both of which indicate broad-scale increases in precipitation from the Mid- to Late Holocene.
An apparent correlation between an alkenone-based SST record from coastal California and the Silver Lake lake-level reconstruction (Fig. 6) is sufficiently strong (R=−0.62 based on interpolating both series to common 100-yr time steps; Supplementary Figure S1) to warrant further examination into the relationship between North Pacific SSTs and Inland Northwest precipitation. The alkenone-based SST reconstruction (Barron et al., Reference Barron, Heusser, Herbert and Lyle2003) shows similar trends and patterns to the lake-level reconstruction from Silver Lake (Fig. 6A) and ice-patch accumulation and glacial-advance records in northwest Wyoming (Fig. 6; Larsen et al., Reference Larsen, Crump and Blumm2020; Chellman et al., Reference Chellman, Pederson, Lee, McWethy, Puseman, Stone, Brown and McConnell2021). Some climate simulations favor anticyclonic wind anomalies over the California margin in the mid-Holocene, which may have favored upwelling, low SSTs, and reduced inland moisture transport as compared to present-day conditions in a manner that could explain the relationship (Hermann et al., Reference Hermann, Oster and Ibarra2018). Likewise, in the historical record (AD 1948 to 2017), increased North Pacific SSTs have coincided with increased vapor transport to western North America (Gershunov et al., Reference Gershunov, Shulgina, Ralph, Lavers and Rutz2017) and North American Regional Reanalysis data (Kalnay et al., Reference Kalnay, Kanamitsu, Kistler, Collins, Deaven, Gandin and Iredell1996) indicate that annual precipitation declines over the western United States during years with low SSTs off the coast of California. If higher SSTs in the northeastern Pacific are responsible for more winter precipitation in the interior Northwest, however, it would conflict with evidence of decreased snowpack in the northern Rockies coinciding with high SSTs in the northeastern Pacific Ocean and the associated strengthening of the Aleutian Low that has occurred in the last 30 years (Pederson et al., Reference Pederson, Gray, Ault, Marsh, Fagre, Bunn, Woodhouse and Graumlich2011a).
The increase in Silver Lake water level during the late Holocene may also indicate a possible change in the frequency or strength of El Niño events, but historic precipitation north of the American Southwest is not significantly correlated with El Niño–Southern Oscillation indices (Shinker and Bartlein, Reference Shinker and Bartlein2009; McAfee and Wise, Reference McAfee and Wise2016; Heyer et al., Reference Heyer, Brewer and Shinker2017). Although the frequency and intensity of El Niño is inferred to have increased from the Mid- to Late Holocene (Fig. 7C; Moy et al., Reference Moy, Seltzer, Rodbell and Anderson2002; Conroy et al., Reference Conroy, Overpeck, Cole, Shanahan and Steinitz-Kannan2008), any direct relationship with the Silver Lake record (Fig. 7D), with or without attendant atmospheric river dynamics, is unclear.
Regardless of the cause, the rise in lake levels, such as seen in records from Silver, Foy, and Hidden lakes, may indicate an eastward expansion of the high precipitation regimes typical of the Pacific Northwest into northwest Montana (Fig. 1B). However, the uncertainty in definitively attributing the Mid- to Late-Holocene increase in precipitation in the Inland Northwest to a proximate cause requires further investigation of the Holocene relationships among different regions and among different types of proxy records, such as those generated from stable isotopes, pollen, tree rings, and lake levels.
CONCLUSIONS
Our lake-level reconstruction from Silver Lake indicates an increasing moisture trend in northwestern Montana over the past 7600 years. The lake-level record includes evidence of multi-century hydrologic fluctuations, such as a phase of high water from 7600–7000 cal yr BP. Sand layers and an associated sedimentary unconformity across the lake's shallow bay document the major feature of the record, which is a substantial reduction in water levels from 7000–2800 cal yr BP, consistent with other regional records such as Foy Lake (Shuman et al., Reference Shuman, Henderson, Colman, Stone, Fritz, Stevens, Power and Whitlock2009). The rise in water levels after ca. 2800 cal yr BP may be attributed to various factors such as a decreasing latitudinal temperature gradient, and effects on atmospheric circulation, including the frequency or intensity or atmospheric river vapor transport. Regardless of the causes, the substantial hydrologic change seen in the record at Silver Lake likely had important ecological and environmental consequences.
Acknowledgments
Reviews by D. Miller and C. Whitlock were greatly appreciated. Thank you to I. Stefanescu and K. Bartowitz for field assistance. We also want to thank K. McLauchlan, T. Hudiburg, and the entire Big Burns team for site selection and feedback throughout the process of this research.
Financial Support
MCP was supported by the Colorado Scientific Society, the Department of Geology and Geophysics at the University of Wyoming, and NSF (DEB-1655189), which was awarded to BNS to support the Big Burns Project. PEH and KDW were also supported by the NSF-funded Big Burns Project via grant DEB-1655121.


 Open access