


Introduction
Europe has 132.2 million heads of sheep, making up approximately 11% of the world sheep population (FAO, 2017). Sheep farming is present in a wide range of environments and ecosystems, giving rise to very different production systems and feeding models which in turn are adapted to each area. In general, the meat sheep sector in Europe has two well-defined stages; an initial phase producing weaned lambs, and another providing fattened lambs. In general, the first phase is based on natural pastures and forage crops (Ripoll-Bosch et al., Reference Ripoll-Bosch, Joy and Bernués2014).
The meat sheep production units (SPU) in the Mediterranean Basin are well adapted to the ecosystems, they protect the biodiversity and the landscape associated with them, and provide quality products (Bernués et al., Reference Bernués, Rodríguez-Ortega, Ripoll-Bosch and Alfnes2014, Reference Bernués, Rodríguez-Ortega, Martín-Collado, Casasús, Olaizola, Alcalde Aldea, Panea Doblado, Pérez Pérez, Bodas Rodríguez, Saura Armelles and Ramos Antón2018). For these reasons they should be maintained. This type of livestock farming is a tool to enhance the environmental management of the landscape and as such is worthy of economic appraisal, for instance, payments could be made to farmers for their contribution to wildfire prevention (Ruiz-Mirazo et al., Reference Ruiz-Mirazo, Robles and González-Rebollar2011; Mena et al., Reference Mena, Ruiz-Mirazo, Ruiz and Castel2016). Furthermore, given the importance of seeking economic and ecological solutions for rural development in these territories (Correal et al., Reference Correal, Robledo, Ríos, Rivera, Lloveras, González-Rodríguez, Vázquez-Yáñez, Piñeiro, Santamaría, Olea and Poblaciones2006), extensive farming could provide an incentive not to leave the area. Abandonment of rural areas is a common problem throughout the whole of Europe (European Union, 2017).
According to the livestock census, the Segureña is reported to be the most numerous autochthonous sheep breed in Spain. There are an estimated 1.2 million Segureña sheep in southeastern Spain, even though only 124,106 heads of Segureña are officially recorded in the flock register (MAPA, 2019). Animals are fed on natural pastures and crop residues (basically cereal stubble and horticulture crop residues) and graze in fruit orchards (almonds, and to a lesser extent, olives). Sometimes transhumance is practised, especially at higher altitudes, where animals are moved to different areas according to the time of the year (Correal et al., Reference Correal, Erena, Ríos, Robledo, Vicente, Rigueiro-Rodríguez, McAdam and Mosquera-Losada2009; Navarro-Rios et al., Reference Navarro-Rios, Marín-Bernal, Martí and Fernández2011; Vidal-González et al., Reference Vidal-González, Barba, Perea, Angón, Puntas and Rouco2016). The lambs are weaned between 1.5 and 2 months, with about 15 kg of weight (Marín-Bernal and Navarro-Ríos, Reference Marín-Bernal and Navarro-Ríos2014). After, they are fattened until 80 days old (Lupi et al., Reference Lupi, Nogales, León, Barba and Delgado2015).
There are different quality marks in the European Union that can be used for lamb. The Protected Geographic Indication (PGI) is linked to the production of a food in a specific area. Segureña lamb is one of the six lamb PGIs in Spain. Also in Spain, the Ministry of Agriculture, Fisheries and Food authorizes the use of an official label to protect and promote products that originate from autochthonous breeds. This Marca Raza Autóctona logo can be used to promote consumption of Segureña lamb.
Another mark, associated in this case with sustainable production, is the Organic Production label, used in accordance with EU Regulations (European Commission, 2007, 2008, 2018) establishing the conditions for this production model. Organic production has increased considerably in recent years and provides another option to diversify sheep farming. The number of organically farmed meat sheep in Europe has risen from 4,425,820 to 4,948,311 heads between 2011 and 2017 (EUROSTAT, 2019).
Conversion from conventional farming to the organic model requires operational changes for the SPUs. These changes are mainly focused on animal feeding, health management and welfare, although if the agroecological principles are considered in the widest sense, other aspects such as marketing or increased feed self-sufficiency should also be taken into consideration.
Therefore, the objective of this study is to make an appraisal of how Segureña weaned lambs, fed on natural pastures and crop residues, can be farmed organically in accordance with current legislation and agroecological principles.
Materials and methods
Study area and choice of SPU
The study area is situated between 38°05′–37°46′ latitude N and 2°44′ and 2°26′ longitude W, in the region of Andalusia (Spain), covering 1814.28 km2 and at a mean altitude of 958 m.
The climate in the area is predominantly semi-arid continental mediterranean or Csa, according to the Köppen classification (Kottek et al., Reference Kottek, Grieser, Beck, Rudolf and Rubel2006). The mean annual temperature in Andalusia in the period 1971–2000 is estimated at 16.1 °C. The mean annual precipitation in the same period is 567 mm (Junta de Andalucía, 2019).
In the study area, the main economic activities linked to the primary sector are agricultural; horticulture field crops, cereals, almonds, and livestock farming, mainly raising Segureña meat sheep. The National Association of Segureña Sheep Breeders (ANCOS) provided their technical services to select the SPUs. Of the 226 members of the Association, 46 farms producing weaned lambs were chosen. All farms practised grazing.
Classification of the SPUs with multivariate analysis
The SPUs were classified based on technical data according to surface area, feeding, reproduction, facilities, marketing and the social characteristics of the farmer. The data were obtained through face-to-face interviews with the 46 farmers. The questionnaire provided 18 variables, 7 of which were qualitative with 2 options and 11 were quantitative. The qualitative variables were expressed as percentages. The variables with their different options are shown in Tables 1–4.
Table 1. Principal component analysis

a The eigenvalue in bold correspond to the variables assigned to each PC.
b *p < 0.05; **p < 0.01; ***p < 0.001;.
Ns: no significant difference.
Table 2. Farm size variables and altitude (mean and standard error) for the whole study sample and each group of farms or SPUs (cluster)
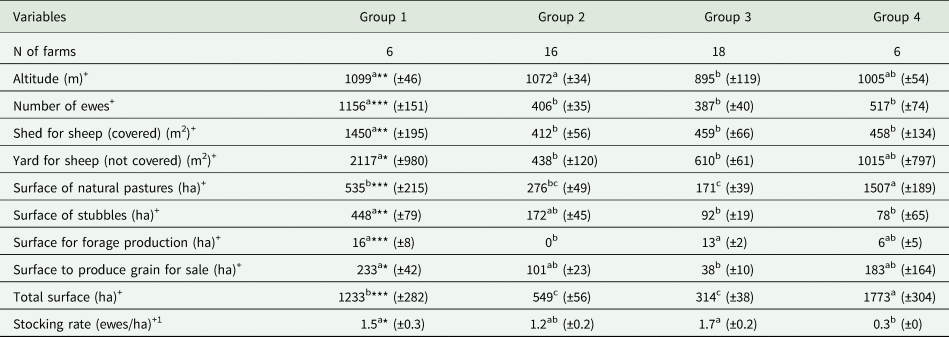
+ Values with different letters (a, b, c) in the same row indicate significant difference (*P < 0.05; **P < 0.01; ***P < 0.001).
1 The land surface to produce grain for sale was not included.
Table 3. Farmer' age, farm management and commercialization variables (mean and standard error) for the whole study sample and each group of farms

+ Values with different letters (a, b) in the same row indicate significant difference (*P < 0.05; ***P < 0.001).
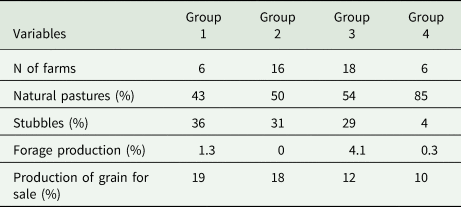
Table 4. Percentages of the different land uses
A two-step multivariate analysis was conducted to classify the farms: a principal component analysis (PCA) and a cluster analysis (CA) (Hair et al., Reference Hair, Anderson, Tathaam and Black1998). The purpose of the PCA was to reduce the number of variables and thus the dimensions of the problem (Lesschen et al., Reference Lesschen, Verburg and Staal2005; Ruiz et al., Reference Ruiz, Castel, Mena, Camúñez-Ruiz and González-Redondo2008). The method used for PCA was the optimal scaling analysis which is used when the variables analyzed are both qualitative and quantitative variables (Madry et al., Reference Madry, Mena, Roszkowska-Madra, Gozdowski, Hryniewski and Castel2013). Before the multivariate analysis the number of variables was reduced excluding those with a low variability coefficient (<50%) and therefore little discriminatory capacity (Hair et al., Reference Hair, Anderson, Tathaam and Black1998), as were those which correlated with others considered by the authors to be more important for defining the production system (Lesschen et al., Reference Lesschen, Verburg and Staal2005). During the process of reducing variables, ten of the 18 variables used in the study were discarded. Therefore, eight variables were used to perform the discriminant analysis which was started checking the appropriate number of PCs. In order the PCs to be sufficiently representative of the set of variables, the eigenvalues were required to be greater than 1 (Ruiz et al., Reference Ruiz, Castel, Mena, Camúñez-Ruiz and González-Redondo2008). After the PCA, the farms were classified by a k-means CA according to the PCs obtained (Hair et al., Reference Hair, Anderson, Tathaam and Black1998; Lesschen et al., Reference Lesschen, Verburg and Staal2005; Castel et al., Reference Castel, Mena, Ruiz, Camúñez-Ruiz and Sánchez-Rodríguez2011). The authors were very well acquainted with this livestock system and considered that the k-means CA was more suitable than the hierarchical analysis (Madry et al., Reference Madry, Mena, Roszkowska-Madra, Gozdowski, Hryniewski and Castel2013). Once the different clusters were obtained, they were described and compared using one-way analysis of variance (ANOVA) for each of the original quantitative variables. This process facilitated confirmation of the multivariate analysis (Madry et al., Reference Madry, Mena, Roszkowska-Madra, Gozdowski, Hryniewski and Castel2013). For each qualitative variable (binary), a Chi-square test was performed. A Student' t-test was done to determine the direction of the dependency relationships with the clusters and to obtain the standard errors.
In relation to the post hoc analysis, for the quantitative variables the least significant difference, Bonferroni and Tukey tests were performed when variances were homogeneous. If they were not homogeneous the Tanhane and Games−Howell T2 tests were performed. All statistical analyses were carried out with the IBM SPSS Statistics 20 statistical package (IBM, 2012).
Appraisal to determine to what degree the SPUs approached the organic production model
In order to determine to what degree the SPUs approached the organic standard of production, the methodology developed by Mena et al. (Reference Mena, Nahed, Ruiz, Sánchez-Muñoz, Ruiz-Rojas and Castel2012) for the conversion of dairy goat mountain production systems was used. This methodology included 60 variables grouped into nine items (Table 5). The questionnaire included the aspects considered in the European legislation concerning requirements for organic livestock farming (European Commission, 2007, 2008, 2018). It also included other agroecological aspects of the system that would facilitate the conversion to organic. Each of the nine items had a different weight when calculating the final index, called Organic Conversion Index (OCI). This gave a global value of approximation to an optimized agrocecological livestock farming model. The Index was based on the multicriteria approach for weighting and aggregating multidimensional information (Falconi and Burbano, Reference Falconi and Burbano2004; Munda, Reference Munda2004).
Table 5. Principles linking, indicators: number of variables (NV) or issues integrating each one, and weighting coefficient (WC) used for calculating the OCI (adapted from Mena et al., Reference Mena, Nahed, Ruiz, Sánchez-Muñoz, Ruiz-Rojas and Castel2012).
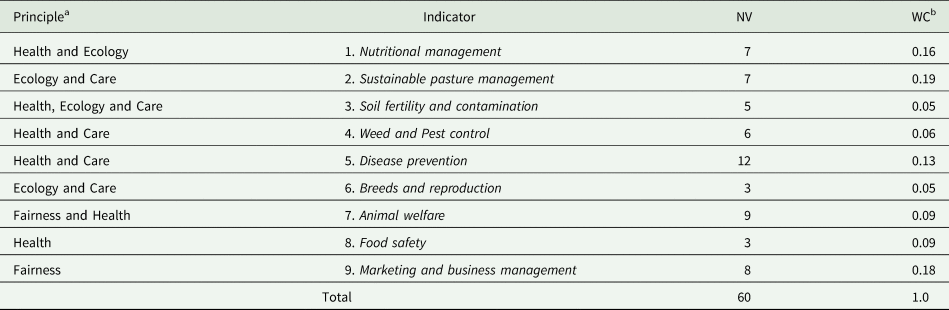
a Principles of organic agriculture (IFOAM 2018).
b Variables and weighting coefficient adopted after validation of second panel of experts. Indicators 4 and 5 were merged into the indicator named Weed and pest control; therefore, the proposed method has only 9 indicators.
Before interviewing farmers, the methodology that was initially designed for dairy goat farming was adapted to meat sheep farming. In order to make this adaptation, seven experts were asked to define the variables making up each indicator. Of the seven experts consulted, four of them were researchers from Spanish research centers and universities who have knowledge of organic livestock and three of them technicians with agricultural training (university degree or master's degree) who are directly related to the organic sector. As a result of this revision process, four questions on milk production were eliminated and eight questions were modified to adapt to sheep farming (two from the Nutritional management indicator, one from Sustainable pasture management, one from Disease prevention, one from Breeds and reproduction, one from Animal welfare and one from Marketing and business management). Five new variables were added (one to Nutritional management, one to Sustainable pasture management, one to Weed and pest control and two to Disease prevention).
The OCI of each farm was calculated as the sum of its weighted indicator values:

where j = 1, 2, 3, …, 9 indicators; k = 1, 2, 3, …, 46 farms; WCj = weighting coefficient assigned to each indicator (Table 5); Ij(k)5 is the value of indicator j for farm k.
The weighting coefficient or specific weight assigned to each indicator (between 0 and 1) was defined as a function of: (i) its importance according to the principles of organic livestock farming and agroecology and (ii) the difficulty in fulfilling the requirements of the European standards on organic production. The weighting coefficients were based on the coefficients established by Mena et al. (Reference Mena, Nahed, Ruiz, Sánchez-Muñoz, Ruiz-Rojas and Castel2012) (Table 5), and adapted to meat sheep production. The same seven experts were also involved in defining the variables to be included in each indicator. In this sense, Sustainable pasture management, Marketing and business management and Nutritional management were the three indicators assigned the greatest weights because of their agroecological importance and because of the difficulty sheep farmers in the Mediterranean Basin had in reaching those goals. In contrast, Soil fertility and contamination, Weed and pest control, Breeds and reproduction, Animal welfare and Food safety were assigned smaller weights as, in general, the initial situation of the systems for which the method was proposed was closer to the organic model of production (Table 5).
The global OCI for all case-study farms was the average of their values:

where k = 1, 2, 3, …, 46 farms; OCI(k) is the OCI of each farm.
The results were compared according to the clusters obtained. The values of the variables and the indicators were also compared, and the OCI was compared with the OCI in similar studies. Finally, some strategies were presented to increase the values of the indicators and the OCI, in the clusters and in the whole sample.
Results and discussion
Characterization of sheep production systems
The multivariate analysis provided three principal components (PCs) made up of eight variables, accounting for 69.2% of the variability found between the farms. The weight (eigenvectors) of each of the three PCs and the proportion of explained variance for each PC are shown in Table 1. The PC1 was named Farm Size and included Total Land Area, Public Land and Number of Livestock Units (LU); the PC2 was named Productive Orientation and included Production Purpose and Predominant Animal Species; and the PC3 was named Feeding Management and included Hay Supplementation and Transhumance. The weight (eigenvectors) of each of the three PCs is shown in Table 1.
Following the CA, based on the three principle components, the farms were divided into four groups. The characteristics of these groups were:
Cluster 1—C1 (6 SPUs): The farms belonging to C1 had large flocks and bigger facilities. The natural areas grazed accounted for less than a half of the available land, and pasture was supplemented with stubble. The stocking rate was high and animals received hay supplement in all cases. In almost all farms in C1 mating took place in autumn as well as in spring and summer and lambs were sold through cooperatives in almost two thirds of cases.
Cluster 2—C2 (16 SPUs): C2 was made up of farms with medium-sized flocks. The natural pastures accounted for half of the available land and animals were supplemented with stubble. The stocking rate was medium to high, and animals were supplemented with hay in less than half of the cases. In a third of the farms in C2, mating took place in the autumn, as well as in spring and summer. Two thirds of the farmers sold their lambs through the cooperative.
Cluster 3—C3. (18 SPUs): The farms in C3 had medium-sized flocks, and little available land. More than half of this land was made up of natural pastures, and was supplemented with stubble and forage crops. The stocking rate was high, and animals received hay supplements in all cases. In C3, mating took place in the autumn, as well as in spring and summer, in only a quarter of the farms. Lambs were sold through the cooperatives in less than half of cases.
Cluster 4—C4. (6 SPUs): Farms had medium-sized flocks, but more available land, mainly natural pastures that accounted for 85% of the land and little use was made of stubble. The stocking rate was low and animals received hay supplements in only a third of the cases. Mating did not take place in the autumn. Lambs were sold through the cooperative in only a third of cases.
Tables 2–4 present technical information for the four clusters.
The farms in this study are extensive, with medium-sized or large flocks and large areas of natural pastures where cereals are also grown. Mixed sheep-cereal farming is traditional in marginal areas of the Mediterranean Basin and has contributed to sustainable rural development and nature conservation. In this system, sheep graze both stubble and fallow, in addition to natural pastures (Correal et al., Reference Correal, Robledo, Ríos, Rivera, Lloveras, González-Rodríguez, Vázquez-Yáñez, Piñeiro, Santamaría, Olea and Poblaciones2006). Use of cereal stubble is particularly important in many farms in C1, C2 and C3. The stocking rate in all farms is medium to low, as in C3, with the highest value, but does not reach 0.3 LU/ha, which is similar to other Spanish sheep farms (Bernués et al., Reference Bernués, Riedel, Asensio, Blanco, Sanz, Revilla and Casasús2005; García-Trujillo and Salcedo, Reference García-Trujillo and Salcedo2006; Ruiz et al., Reference Ruiz, Lara, Mena and Moreno2016). Regarding hay production, in C3 there is the highest proportion of area dedicated to forage production (4.1%). In C3 forage production is easier because the pastures are at a lower altitude (less than 900 m), where more of the land has gentle slopes that are more appropriate for crops. There is also less rainfall (making it easier to dry the forage). In C4 the stocking rate is very low and therefore livestock graze natural pastures more than in any other group. It would also be favorable for them to produce more forage to feed livestock when the climate does not permit pasture production.
The mating seasons are more widely distributed throughout the year in C1 and C2, therefore lamb production is better distributed than in C3 and C4. This benefits the cooperative selling the lambs, because farmers can concentrate lamb sales at times when prices are higher (Christmas and summer season) (MAPA, 2018).
Conversion of the Segureña breed sheep production systems to the organic model
Table 6 shows average levels of proximity to the organic model through the nine indicators, as well as the OCI of the SPUs for all groups, and each of the four groups of farms. Except for the Breeds and reproduction indicator, farms in different groups do not significantly differ (P > 0.05) in any of the remaining eight indicators, or in the OCI. The indicators Nutritional management, Animal welfare and Food safety comply well with the organic production regulations (83, 70 and 70%, respectively). The indicators Marketing and business management, Weed and pest control, Breeds and reproduction, and Sustainable pasture management approach organic standards favorably (from 61 to 63%). However, the indicators Disease prevention and Soil fertility and contamination are further from the organic production model (50 and 56%, respectively).
Table 6. Organic Conversion Indicators and OCI (%) (mean and standard error) for the whole sample and each group of farms (cluster)

1 Values with different letters (a, b) in the same row indicate significant difference (P < 0.05).
The OCI value obtained in this research (65%) was higher than in other studies conducted among ruminant farmers (Table 7).
Table 7. Organic conversion indicators and OCI values (%) for the current study and results of various authors
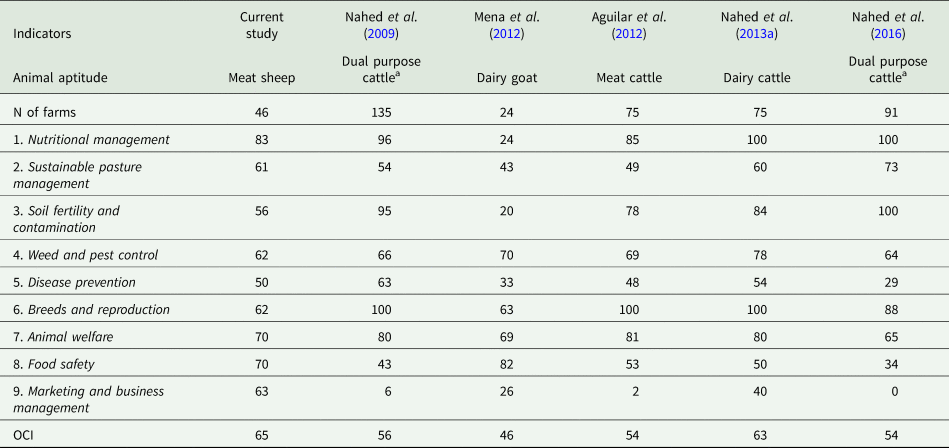
a Meat and milk production.
The sheep farmers in this study present a higher OCI than that obtained for dairy, meat, or dual-purpose livestock. In general, when the animals are dairy-purpose, it is more difficult for the farms to adapt to organic production, mostly because of greater feed requirements that make the production costs much higher (Willer and Schaack, Reference Willer, Schaack, Willer and Lernoud2015). It is for this reason that the OCI reported for dairy goat production in Spain was only 46% (Mena et al., Reference Mena, Nahed, Ruiz, Sánchez-Muñoz, Ruiz-Rojas and Castel2012). In the same research, the indicators related to feeding (Nutritional management and Sustainable pasture management) had lower values than in this study, as well as the indicators Soil fertility and contamination, Disease prevention, and Marketing and business management. The only indicator with a higher value than in this study was Food safety.
For the studies conducted in Chiapas (Mexico) with meat-purpose or dual-purpose ruminants (Nahed et al., Reference Nahed, Calderón, Aguilar, Sánchez-Muñoz, Ruiz-Rojas, Mena, Castel, Ruiz, Jiménez-F, López-Méndez, Sánchez-Moreno and Salvatierra2009, Reference Nahed, Grande, Aguilar and Sánchez2016; Aguilar et al., Reference Aguilar, Nahed, Parra, García and Ferguson2012), the OCI values were lower than in the current study (around 55%), but the climatic and productive conditions which are very different from those considered here should be taken into account. For Nutritional management, Soil fertility and contamination and Breeds and reproduction, higher values were observed than in this study, whereas Food safety and moreover, Marketing and business management, had lower values.
The OCI value of this study (65%) was similar to the one observed in Chiapas, México (63%), with dairy cow farms (Nahed-Toral et al., Reference Nahed-Toral, Sanchez-Muñoz, Mena, Ruiz-Rojas, Aguilar-Jimenez, Castel, Ruiz, Orantes-Zebadua, Manzur-Cruz and Cruz-Lopez2013a), whereas the indicators Soil fertility and contamination, and Breeds and reproduction, also had a lower value in this study. The indicator Weed and pest control was similar, whilst the indicators Food safety and Marketing and business management were lower than the Chiapas study (Table 7).
The dairy farms in Chiapas were closer to the organic production model, as shown by the higher values for the indicator Marketing and business management. This is because the producers are organized in Rural Producers'Associations. They sell milk to the Chiapas dairy processing company and to artisanal cheesemakers; therefore there is a high demand for milk for cheese production. The values present variation and change in comparison to other studies conducted in Tecpatán, Chiapas. This can be explained by the fact that the study reported by Nahed et al. (Reference Nahed, Grande, Aguilar and Sánchez2016), focused on three study areas with an altitudinal gradient (150−1800 m a.s.l.), associated with a different climate (from humid tropical to semi-arid warm), a different management strategy and a different production objective. Escribano (Reference Escribano2016) also obtained values for the Global Conversion Index in the beef cattle farms in Spanish rangelands (43%), although his methodology varied in comparison to the studies quoted, as it considered some indicators linked to human activity (Human well-being and Rural world opportunities and Human capability in implementing sustainable agricultural practices). In any case, the indicators regarding feed management, self-sufficiency and agrifood chain relationships, have lower values in the beef cattle farms than the meat sheep farms in Spanish rangelands.
Tables 8–12 present the proximity to the organic production model for each of the variables included in the nine indicators, which explain the main strengths and weaknesses of these systems for conversion to the organic production model. Table 13 shows the discriminating variables linked to the Organic Conversion Indicators. The rest of the variables are not discriminating.
Table 8. Variables included in Indicators 1–2 (items of obligatory compliance according to EC 889/2008 are in italics)
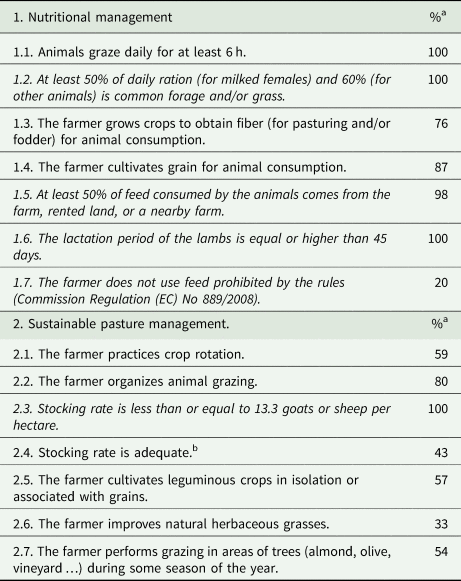
a The value reached for each variable corresponds to the percentage of farms with an affirmative response for that variable.
b Stocking rate is adequate if it is within the limits considered optimal for the type of ecosystem and animal studied [0.1–2.4 small ruminant units/ha, Robles et al. (Reference Robles, Ruiz-Mirazo, Ramos, González-Rebollar, Rigueiro-Rodríguez, McAdam and Mosquera-Losada2009)], and signs of overgrazing are not observed.
Table 9. Variables included in Indicators 3–4 (items of obligatory compliance according to EC 889/2008 are in italics)
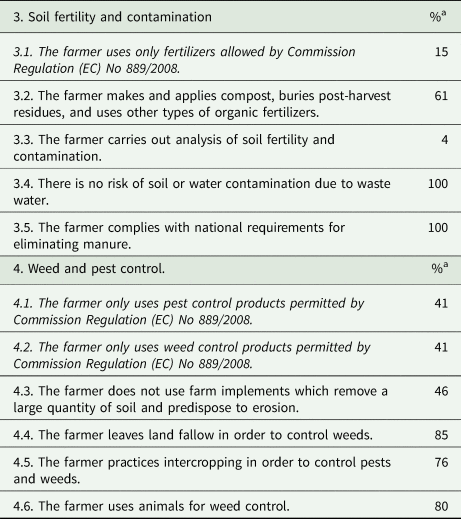
a The value reached for each variable corresponds to the percentage of farms with an affirmative response for that variable.
Table 10. Variables included in Indicators 5–6 (items of obligatory compliance according to EC 889/2008 are in italics)
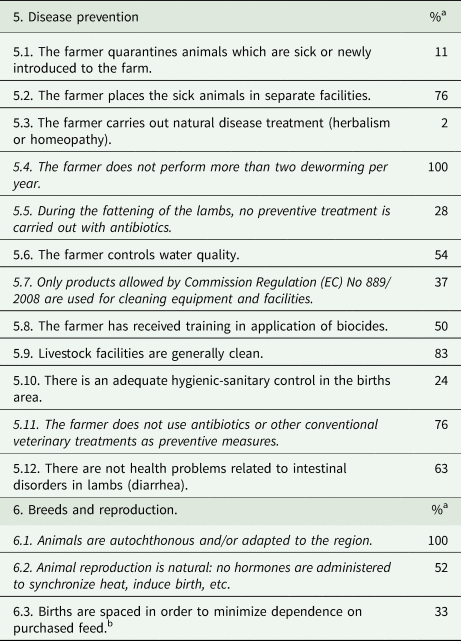
a The value reached for each variable corresponds to the percentage of farms with an affirmative response for that variable.
b The seasons with the greatest nutritional needs should coincide with those of greater grass production.
Table 11. Variables included in Indicator 7 (items of obligatory compliance according to EC 889/2008 are in italics)

a The value reached for each variable corresponds to the percentage of farms with an affirmative response for that variable.
b For small ruminants the value is 1.35 m2.
Table 12. Variables included in indicators 8–9 (items of obligatory compliance according to EC 889/2008 are in italics)
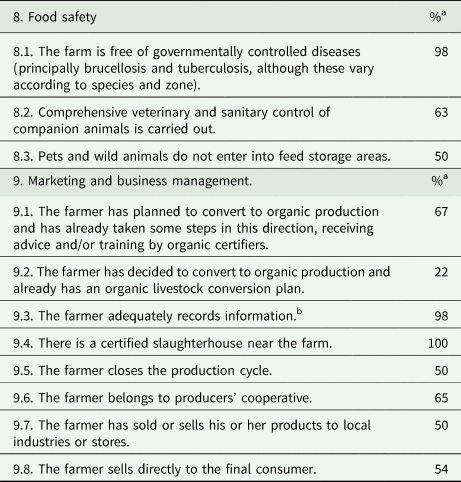
a The value achieved for each variable corresponds to the percentage of farms with an affirmative response for that variable.
b The farmer has up to date records of veterinary treatments, feed management, and purchases and sales.
Table 13. Discriminating variables linked to the Organic Conversion Indicators (%) (mean and standard error) for the whole sample and each cluster (items of obligatory compliance according to EC 889/2008 are in italics)

+ Values with different letters (a, b) in the same row indicate significant difference (*P < 0.05; **P < 0.01).
++ No hormones are administered to synchronize heat, induce birth, etc.
The high value of the first indicator, Nutritional management (Table 8), shows that the farms in the four groups comply adequately with the organic regulations. This is because all variables in this indicator have high values except for: The farmer only uses feed permitted by the European regulations, which has a low value (20%). However, it is high in C4 (67%) (Table 13).
For the second indicator, Sustainable pasture management, the farms reach a medium level of proximity to organic production (61%) as in general they fulfill the requirements of crop rotation and do not surpass the maximum stocking rate established by the European regulations for organic production. This maximum stocking rate, set at 13.3 sheep per hectare, is determined by the maximum limit of nitrogen contamination. However, the limiting factor in this type of Mediterranean ecosystem is the carrying capacity of pastures, which is defined as the maximum stocking rate applicable under conservative management (Holechek et al., Reference Holechek, Pieper and Herbel1989). This carrying capacity varies with the type of pastures which, according to Robles et al. (Reference Robles, Ruiz-Mirazo, Ramos, González-Rebollar, Rigueiro-Rodríguez, McAdam and Mosquera-Losada2009), in southeastern Spain range from esparto-grass (Stipa tenacissima L.) to dry steppes and mountain forests with undergrowth. These authors establish a carrying capacity for small ruminant livestock that fluctuates between 0.1 animals/ha for the tall shrublands or the esparto–grass steppes and 2.4 animals/ha for medium leguminous shrublands. Considering these values, the stocking rate is adequate in 43% of cases and only in C4 is it optimum in all cases (Tables 8 and 13). Likewise, the values for the variable The farmer improves natural herbaceous grasses tend to be low (33% on average) except for C1 (67%).
In relation to the third indicator, Soil fertility and contamination farms had a medium level of approximation to the organic production model (56% on average) (Table 6). The most important strengths of the farms in the four groups are: the farmers’ compliance with national requirements to eliminate manure; the absence of risk of soil or water contamination from wastewater; and to a lesser extent, the fact that the farmer makes and applies compost; buries post-harvest residues; and uses other types of organic fertilizers. The main variables that have lower values in this indicator are farmers’ low use of fertilizers permitted by the EU Regulations and, more importantly, the minimal level of analyses carried out on soil fertility and contamination (Table 9).
The fourth indicator, Weed and pest control, had on average a medium approximation to the organic production model (62%) (Table 6). Three variables (The farmer leaves land fallow in order to control pests and weeds, The farmer practices intercropping in order to control pests and weeds and The farmer uses animals for weed control) had very good approximations to the organic production model (>76.0%), while three other variables (The farmer only uses pest control products permitted by Commission Regulation, The farmer only uses weed control products permitted by Commission Regulation, and The farmer does not use farm implements which remove a large quantity of soil and predispose to erosion) had a low approximation to the organic model, below 50% (Table 9).
For the fifth indicator, Disease prevention, the approximation to the organic model was the lowest (45–56%) (Table 6). This is due principally to the farmer not carrying out natural treatments of diseases, such as herbalism or homeopathy, and the low percentage of farms in which the farmer quarantines sick animals or new arrivals. Farmers must also avoid preventive treatments with antibiotics, and set up adequate hygienic-sanitary control in the maternity area. The practices that best meet the organic standard are; The farmer does not deworm more than twice a year, Livestock facilities are generally clean, The farmer places sick animals in separate facilities and The farmer does not use antibiotics or other conventional veterinary treatments as preventive measures (Table 10). The variable Only permitted products are used for cleaning equipment and facilities that had a medium−low value (37%), presents significant differences between groups. In C4 this value is 100% (Table 13).
The sixth indicator, Breeds and reproduction, had on average a medium approximation to the organic production model (62%) (Table 6). It was the only indicator with significant differences between the four groups of farms. C3 and C4 had the highest values (72 and 78% respectively) and C1 had the lowest value (39%) (Table 6). The variable The animal reproduction is natural had significative differences between groups; 83% for C4 and only 17% for C1 (Table 13). All farms complied 100% with the variable the animals are autochthonous and/or adapted to the region, which means that the farms mainly raise Segureña sheep (Table 10). This is the basis of organic livestock production, which promotes adaptation of the animals to specific regional conditions and development of resistance to illnesses and predominant parasites (CEU, 2007; Rozzi et al., Reference Rozzi, Miglior and Hand2007; IFOAM, 2018).
For the seventh indicator, Animal welfare, the average value was closer (72.0%) to organic standards (Table 6). This is because farms complied with a high percentage of variables, except for those related to the stabling area and for injuries sustained by animals (Table 11). For the eighth indicator, Food safety, the average value was also close to the organic model (70%) (Table 6). This is mainly because 98% of the farms are free from government- controlled diseases, mainly brucellosis and tuberculosis (Table 12). There were significative differences between C1 and C2 (83 and 25% respectively) concerning the variable No presence of pets and wild animals (Table 13).
Finally, the ninth indicator, Marketing and business management, had on average a medium approximation (63%) to organic production (Table 6). Only two variables (There is a certified slaughterhouse near the farm and the Farmer adequately records information) had a very high value (around 100%) (Table 12). In one of the variables associated with this indicator (The farmer belongs to a producers’ cooperative), there are significant differences between the groups (100% for C1 and only 44% for C3, which include larger and smaller farms, respectively) (Table 13). In any case, some of the farmers belonging to the cooperative sell a rather small part of their production directly to consumers, although this activity is not allowed.
Taking into account that in C4 there are the more extensive farms and in C1 the less, the following can be said by way of synthesis: the high stocking rate of the lesser extensive farms (C1) makes feeding more dependent on external resources than in the more extensive (C4); at the same time, the mating is more distributed throughout the year, the reproduction is less natural and higher proportion of farmers belong to the cooperative. In C2 and C3 (with medium stocking rate), the farms are less extensive than C4 but more than C1. In C3 hay is supplied on all farms; in C2 there is a higher proportion of farmers belonging to the cooperative.
Strategies to improve the degree of proximity of meat sheep farms to the organic model
Although animal feeding is based on grazing in all farms, some aspects of feeding management can be improved in order to facilitate conversion to organic production. The farmers, especially in C1, C2 and C3 should persevere in not using banned feed (such as animal dung, commercial feed, and chemical additives) (CEU, 2007; Müller-Lindenlauf et al., Reference Müller-Lindenlauf, Deittert and Kopke2010; IFOAM, 2018). Also, for the same groups, farmers should decrease the flocks’ stocking rate in line with the carrying capacity. Likewise, in order to achieve more sustainable pasture management, it is necessary for the farmer to improve natural herbaceous grasses (especially in C2, C3 and C4), and cultivate leguminous crops in monoculture or in association with grains and allow animals to graze among trees. Moreover, diversified grasslands offer greater soil protection, favour biodiversity, and provide environmental services such as carbon capture, reduction in CH4 and nitrous oxide emissions, and mitigation of global warming (Pimentel et al., Reference Pimentel, Hepperly, Hanson, Douds and Seidel2005; Müller-Lindenlauf et al., Reference Müller-Lindenlauf, Deittert and Kopke2010). The stocking rate should also be appropriate (especially in C1, C2 and C3).
In order to face the fluctuation of animal requirements and the availability of natural pastures throughout the year, farmers must increase forage production, especially in C1, C2 and C4. The creation of fodder banks or hedges with forage shrubs can also support biodiversity (Correal et al., Reference Correal, Robledo, Ríos, Rivera, Lloveras, González-Rodríguez, Vázquez-Yáñez, Piñeiro, Santamaría, Olea and Poblaciones2006). Likewise, in order to increase pasture availability all year round, one recommendation would be to increase the proportion of flocks practising transhumance, as this used to be a traditional activity in many areas of the Mediterranean Basin (Daugstad et al., Reference Daugstad, Fernández Mier and Peña-Chocarro2014). As reported by Correal et al. (Reference Correal, Erena, Ríos, Robledo, Vicente, Rigueiro-Rodríguez, McAdam and Mosquera-Losada2009), traditionally livestock grazed across a gradient of mountain-valley pastures according to seasonal variations of cold−warm and wet−dry regimes in the Segureña production area. This included river valleys in spring and autumn and high-altitude pastures during the summer. Currently, in C4, transhumance is practised by 33% of farmers and in lower proportions in other groups, being 0% in C3. If farmers wish their animals to graze permanently or for long periods, some infrastructures could be set up, for instance fences, watering points and shelters, thus reducing labor costs and demand for shepherds (Correal et al., Reference Correal, Erena, Ríos, Robledo, Vicente, Rigueiro-Rodríguez, McAdam and Mosquera-Losada2009). In Tecpatán, Chiapas, dual-purpose livestock farming is integrated in arable and forestry production in energy flows and movement of material, fertilizing crops with manure, feeding livestock with crop residues and organizing animals in grazing units with a gradient of trees that range from extensive grasslands (without trees) to grasslands with hedges, and to open woodland, with shrubs and/or secondary vegetation, that are used alternately during the annual cycle. With this system, the animals’ diet is varied, and in general good nutritional quality is maintained throughout the year. This form of livestock management, with little input from external sources, has a lower environmental cost and tends to be sustainable by comparison to conventional management systems with a high use of inputs from external sources (Nahed-Toral et al., Reference Nahed-Toral, Valdivieso-Pérez, Aguilar-Jiménez, Cámara-Córdova and Grande-Cano2013b; Valdivieso et al., Reference Valdivieso, Nahed, Piñeiro, Guevara, Jiménez and Grande2019).
In order to improve Soil fertility and contamination that does not surpass 60% proximity to the organic production model in any group, farms which currently use chemical fertilizers should substitute them for organic fertilization practices and manure management systems (Laguë et al., Reference Laguë, Landry and Roberge2005; Pimentel et al., Reference Pimentel, Hepperly, Hanson, Douds and Seidel2005).
Effective organic weed control consists of maintaining weed species populations that grow spontaneously in grasslands and in crops at acceptable levels; this prevents excessive multiplication without complete eradication (Menalled et al., Reference Menalled, Gross and Hammond2001) and should be considered, especially in C4. For disease prevention in all groups chemical medication (such as antibiotics and anti-parasite medicines) should be substituted whenever possible by natural methods such as homeopathy and herbalism (CEU, 2007; IFOAM, 2018). Moreover, farmers should improve on the simplest measures relating to animal hygiene and husbandry. Especially with regard to anti parasite, since with respect to antibiotics the situation in Spain has improved a lot in recent years as a result of the application of the national plan against antibiotic resistance (updated for the period 2019–2021). Likewise, C4 was the one group where farmers used authorized products only, for cleaning equipment and facilities.
To improve the indicator Breeds and reproduction, farmers, especially those in C1, should improve natural reproduction, without the use of hormones to synchronize heat or to induce lambing, and space out lambing periods to minimize dependence on purchased feed.
Although the indicators Animal welfare and Food safety have acceptable values in their approximation to the organic model, these values can be improved. For instance, with regard to Animal welfare, in organic livestock farming, animals should be provided with optimal conditions for developing their reproductive and productive functions and for satisfying their biological needs (von Borell and Sorensen, Reference Von Borell and Sorensen2004). The low value of the variable 7.7 is due to the fact that the lamb tails are normally cut (this is easily solvable because many farmers have already realized that it is not essential). Two other variables have low values 7.1 (Covered area) and 7.2. (Outside space); these values can be increased by taking advantage of EU aids for modernization of agricultural farms. As for Food safety, Non-presence of pets and wild animals should be ensured, especialy in C2.
To improve the indicator Marketing and business management, farmers should convert to organic production and have a conversion plan for livestock production, in addition to selling their products to local industries and stores, or to final consumers. In all groups, where possible, efforts should be made to undertake the fattening part of the process, so as to control the whole production cycle, and if possible, do this in association with a cooperative. This association can help implement the organic production model. The organic certification complements the aspects already considered in the other brands related to the Segureña cooperative, specifically offering food that is free of synthetic chemicals. Membership of a cooperative should be encouraged, especially in C4 and C3. This is particularly beneficial to farmers in C3.
The strategies presented in this work to achieve greater efficiency in the conversion of farms into organic are associated with various training activities that have been carried out in Andalusia through associations and cooperatives. Currently, the authors are designing a computer application for the conversion, based on the results of this and other similar studies related to native Spanish breeds of goats, sheep and cattle. This is part of the project CHALLENGES OF THE ANDALUSIAN LIVESTOCK SYSTEMS AND THEIR PRODUCTS (RESGAP) - PR.TRA.TRA2019.008 and its main objective is to discover the aspects in which more action must be taken to have a successful conversion.
Conclusions
Extensive Mediterranean sheep farming is a livestock production model closely linked to the territory. It helps maintain the ecosystem and anchors the rural population to the areas where this type of farming takes place. Extensive production systems normally take advantage of cereal stubble and other crop residues.
The production systems of this study is relatively close to the organic production model. Although there are significant differences between clusters for some variables, there is no difference in the global indicator, which ranges between 63 and 70%. The advantages between different variables are compensated, which are similar to what happens in other studies that have been analyzed in this paper.
In the most extensive farms, the less stocking rate and the natural animal reproduction are favorable for the conversion. But on the other hand, the mating is less distributed throughout the year and there is a lower proportion of farmers belonging to the cooperative.
As food self-sufficiency is a key aspect in the organic production model, farmers should try to increase forage production or find a way to obtain it easily and economically. Other recommendations are: to reduce the amount of synthetic chemicals used and aim to complete the plant–soil–animal cycle up to slaughter, seeking moreover greater marketing autonomy and achieving closer contact with the final consumer.
Farmers should work together to strengthen organic production. At the same time government policy both in Spain and other parts of Europe should persevere to find more ways to support the progress of this type of production, in an effort to address limitations and overcome the lack of alternative markets. Incentives paid to farmers are justified considering that organic production is a low polluter and plays an essential role in the integrated management of natural resources.
Acknowledgements
To the farmers and technical experts of the National Association of Segureña Sheep Breeders (ANCOS). We would like to thank them for their collaboration in data gathering as well as their input and funding of the project to set up the experimental program for lifelong learning and participatory ‘organic farming’ (PP.TRA.TRA201300.4).


 Open access