


Diabetes and depression are highly prevalent conditions and often co-occur. Compared with the general population, individuals diagnosed with diabetes have a higher risk of developing depressive symptoms (odds ratio = 1.38).Reference Lin and von Korff1 Both conditions are associated with a considerable disease burdenReference Schram, Baan and Pouwer2, Reference Snoek, Bremmer and Hermanns3 and substantial healthcare costs.Reference Smit, Cuijpers, Oostenbrink, Batelaan, de Graaf and Beekman4, Reference Simon, Katon, Lin, Ludman, von Korff and Ciechanowski5 In a systematic literature review, eight cost-of-illness studies showed a significant difference between the healthcare costs of individuals with diabetes and comorbid depression and those with diabetes without depression.Reference Lehnert, Konnopka, Riedel-Heller and König6 Comorbid depression increased the diabetes-related costs by between 35 and 300%.Reference Lehnert, Konnopka, Riedel-Heller and König6 Another study in the USA showed that diabetes and comorbid depression led to increased presenteeism and absenteeism. Individuals with comorbid minor depression had a 1.7-fold increased risk and those with comorbid major depression had a 2.8-fold increased risk of missing more than 5 workdays in the past month compared with individuals who only had diabetes.Reference Von Korff, Katon, Lin, Simon, Ciechanowski and Ludman7
Interventions to reduce depression in diabetes mellitus
A Cochrane review on individuals with diabetes and comorbid depression showed that psychological and pharmacological interventions can be an effective approach to reduce depressive symptoms.Reference Baumeister, Hutter and Bengel8 The effect of these interventions on diabetes-related outcomes, such as glycaemic control and diabetes management, are mixed.Reference Baumeister, Hutter and Bengel8, Reference Kok, Williams and Zhao9 Evidence concerning the cost-effectiveness of depression treatment in individuals with diabetes mellitus is marginal.Reference Jeeva, Dickens, Coventry, Bundy and Davies10
Web-based interventions are a promising additional treatment option for individuals with depression. A meta-analysis shows that they are successful in reducing symptoms of depression,Reference Richards and Richardson11 even in individuals with diabetes.Reference Nobis, Lehr, Ebert, Baumeister, Snoek and Riper12–Reference van Bastelaar, Pouwer, Cuijpers, Riper and Snoek14 Web-based interventions are often assumed to offer several advantages, such as reaching individuals who were untreated for many yearsReference Nobis, Lehr, Ebert, Baumeister, Snoek and Riper12 and being cost-effective compared with face-to-face therapies.Reference Andersson and Titov15 However, there have been few trials that have evaluated the cost-effectiveness of web-based interventions for depression, and their results showed that they do have the potential to be cost-effective.Reference Hollinghurst, Peters, Kaur, Wiles, Lewis and Kessler16–Reference Geraedts, van Dongen, Kleiboer, Wiezer, van Mechelen and Cuijpers20 To the best of our knowledge, no study has examined the cost-effectiveness of a web-based intervention for the subpopulation of individuals with diabetes and comorbid depression.
In previous analyses, we demonstrated that the web-based intervention GET.ON Mood Enhancer Diabetes (GET.ON M.E.D.) was effective in reducing symptoms of depression over 2 and 6 months among individuals with types 1 and 2 diabetes mellitus and comorbid depression.Reference Nobis, Lehr, Ebert, Baumeister, Snoek and Riper12, Reference Ebert, Nobis, Lehr, Baumeister, Riper, Auerbach, Snoek and Berking13 This study evaluates, from a societal perspective, the cost-effectiveness and cost utility of this web-based intervention for symptoms of depression in people with diabetes compared with an active control group receiving psychoeducation.
Method
Design and participants
The study's design was described in detail elsewhere.Reference Nobis, Lehr, Ebert, Berking, Heber and Baumeister21 In brief, this study was designed as a health economic evaluation alongside a randomised controlled trial that was conducted with two parallel groups that were measured at baseline and at 2 and 6 months post-baseline. The aim was to include costs and savings associated with improvement in depression. We did not include costs and savings due to changes in diabetes control. In total, 260 individuals with diabetes and symptoms of comorbid depression were randomly allocated to either the intervention or to an unguided web-based psychoeducation session for depression. Block randomisation was performed using an automated, web-based program (randomisation.eu) and a 1:1 ratio. Participants were included in the study if they were 18 years or older, had been diagnosed with type 1 or type 2 diabetes mellitus for a minimum of 3 months and had clinically relevant depressive symptoms, as measured with a Center for Epidemiological Studies Depression Scale (CES-D) score ≥23.Reference Hautzinger, Bailer, Hofmeister and Keller22, Reference Radloff23 The exclusion criteria were risk of suicide, currently receiving psychotherapy or being on a waiting list for such treatment. The study was approved by the Ethics Committee of the Philipps University of Marburg, Germany. The trial was registered in the Deutsches Register Klinischer Studien, the German clinical trial registry, under registration number DRKS00004748.
Interventions
The GET.ON M.E.D. intervention consisted of six minimally guided online sessions, two optional sessions (addressing overweight and healthy sleep) and an optional booster session after 4 weeks. The primary aim of this intervention was to reduce symptoms of depression. The intervention was based on cognitive–behavioural therapy (CBT) (systematic behavioural activationReference Cuijpers, van Straten and Warmerdam24 and problem solvingReference Cuijpers, van Straten and Warmerdam25) and included homework assignments and an online mood diary. Each session contained diabetes-specific themes. Participants were supported by a coach who provided personalised written feedback (approximately 350 words) within 48 h after receiving the homework. The communication between the participants and the coaches took place in an asynchronous way via the internal messaging function on the GET.ON M.E.D. platform. Each coach was supervised by an experienced clinical psychologist. The individuals in the control group received a self-help, web-based, psychoeducation session26 on the same platform. It informed participants about the nature of and evidence-based treatments for depression. The session focused only on symptoms of depression, not diabetes-related issues. All participants had full access to treatment as usual (e.g. psychotherapist and general practitioner).
Outcome measures
The clinical outcome for the cost-effectiveness analysis was the number of participants who were classified as having a favourable treatment response in terms of depressive symptom severity, according to the CES-DReference Hautzinger, Bailer, Hofmeister and Keller22 and the Reliable Change Index (RCI)Reference Jacobson and Truax27 after 6 months (see Statistical analysis). The internal consistency of the CES-D is high (Cronbach's α = 0.87–0.92 in various German samples),Reference Hautzinger, Bailer, Hofmeister and Keller22 and this study had a Cronbach's α of 0.91.
Quality-adjusted life-years (QALYs)Reference Drummond, Sculpher, Torrance, O'Brien and Stoddart28 were used as the primary outcome of the cost-utility analysis. To compute QALYs, we used the EQ-5D-3L29 and the well-validated British standardised value set.Reference Dolan30 Responders completed the EQ-5D-3L at baseline and after 2 and 6 months. This questionnaire consists of five items including mobility, self-care, usual activities, pain/discomfort and anxiety/depression, each of which is rated as causing ‘no problems,’ ‘some problems’ or ‘extreme problems’.29
Measuring resource use
At baseline and 6 months after randomisation, we assessed the direct and indirect costs that were incurred 3 months before the assessments. The economic evaluation was performed from a societal perspective, which includes direct medical costs, direct non-medical costs and indirect costs. The costs were calculated in Euros (€) for the reference year 2013. We used the ‘Trimbos Institute and Institute of Medical Technology Questionnaire for Costs Associated with Psychiatric Illness’ (Tic-P)Reference Hakkaart-van Roijen31 cost questionnaire, adapted for the German healthcare system. The participants were instructed to report all of their healthcare use and productivity losses. We followed the guidelines from Krauth and colleaguesReference Krauth, Hessel, Hansmeier, Wasem, Seitz and Schweikert32 and from Bock and colleaguesReference Bock, Brettschneider, Seidl, Bowles, Holle and Greiner33 regarding the use and calculation of standardised unit costs in the German healthcare system. To assess the presenteeism and absenteeism costs, we adhered to the recommendations from the Dutch Tic-P manual.Reference Hakkaart-van Roijen31 Moreover, we followed the recommendations of the Consolidated Health Economic Evaluation Reporting Standard.Reference Husereau, Drummond, Petrou, Stavros, Carswell and Moher34
Intervention costs
The manufacturer of GET.ON M.E.D. estimated the average price of the intervention to be €150 per participant. The costs for developing and hosting the intervention are included in this flat tariff. We added €10 for each feedback session as this was the actual payment received by the coaches. Moreover, at the end of each lesson participants were asked how much time they had spent on the intervention. On average they needed 30 min for each session. Based on Krauth and colleagues,Reference Krauth, Hessel, Hansmeier, Wasem, Seitz and Schweikert32 the opportunity costs per hour were calculated at €23.10. Therefore, we estimated intervention costs of €283.46 (€63.18 feedback costs + €150 intervention costs + €70.28 opportunity costs).
For the control group, which received web-based psychoeducation, we calculated €23.10 (1 h opportunity costs) for reading the information and €10 for the manufacturers' time and effort in preparing an online psychoeducational session. It was assumed that all of the participants owned a computer and had internet access, so these costs were not included.
Direct medical costs
Direct medical costs included costs for any type of healthcare services (e.g. treatment time by health experts, time for homework assignments and health activities) and for medications. The costs of visits to a medical doctor or other healthcare services were based on the results and recommendations of Bock and colleaguesReference Bock, Brettschneider, Seidl, Bowles, Holle and Greiner33 and were indexed for 2013. The costs of medications, such as antidepressants, were based on the German drug register (Rote Liste). Here, we followed the recommendations from BockReference Bock, Brettschneider, Seidl, Bowles, Holle and Greiner33 and KrauthReference Krauth, Hessel, Hansmeier, Wasem, Seitz and Schweikert32 and calculated the arithmetic mean of the costs of the three largest packaging forms of the same agent, minus the pharmacist clawback, weighted by the statutory population share (89%). The only costs we did not measure were the direct medical costs of diabetes drugs (e.g. insulin), as these costs for type 1 and type 2 are very different.
Direct non-medical costs
Direct non-medical costs included costs for making the return trip to a healthcare service, for example, a general practitioner. A receipt for the cost of travelling by bus or taxi was requested; each kilometre was valued at €0.30. If no receipt was provided, the cost was calculated based on the average costs according to the German mileage lump-sum charge.
Costs of productivity losses
Indirect costs refer to productivity losses due to absenteeism and presenteeism in paid work and due to impairments in the ability to perform domestic tasks, expressed as the number of hours that others must spend performing those chores. Productivity costs were based on the human capital approach;Reference Drummond, Sculpher, Torrance, O'Brien and Stoddart28 specifically, the participants are asked whether they had been absent from work during the past 3 months (absenteeism). These days were multiplied by their average gross daily wage. Productivity losses may also occur when people feel ill while at work, which may result in lesser efficiency (presenteeism). Therefore, the participants were asked to report the number of days that they felt ill but continued to work. These days were multiplied by a self-reported inefficiency score, which ranged between 0 and 1 (1 represents totally inefficient, and 0 represents as efficient as when in good health), to obtain workday equivalents lost to presenteeism. Subsequently, their gross wages per hour were calculated based on their self-reported monthly salary and were used to calculate the costs of presenteeism.Reference Hakkaart-van Roijen31 Finally, people may not be able to perform domestic tasks and may thus, for example, receive help from their family members. These costs were valued as the price of domestic help at €18.33 per hour (which is essentially a shadow price for these costs).Reference Bock, Brettschneider, Seidl, Bowles, Holle and Greiner33
Statistical analysis
This study was powered to detect a mean difference of d = 0.35 in the primary outcome (CES-D) between the groups at post-measurement. This study was not powered to statistically test the differences in health economic outcomes. Therefore, we adopt a probabilistic decision-making approach for making health economic inferences.Reference van Hout, Al, Gordon and Rutten35
Analyses of clinical outcomes
All analyses were conducted in accordance with the intention-to-treat (ITT) principle. All of the participants completed the baseline assessment. Consistent with previous evaluations of this study,Reference Nobis, Lehr, Ebert, Baumeister, Snoek and Riper12, Reference Ebert, Nobis, Lehr, Baumeister, Riper, Auerbach, Snoek and Berking13 the missing data at follow-up were imputed using a Markov chain Monte Carlo multivariate imputation algorithm (missing data module in SPSS version 20) with ten estimations per missing value, and we then aggregated the ten estimations.Reference Schafer and Graham36
We included concurrent use of antidepressants, age, duration of diabetes, family status and use of other psychological treatments during the trial period as covariates in the primary outcome analysis. As none of these variables were a predictor of the outcome, we excluded them from the final model.
We categorised the participants as responders according to the widely used RCI.Reference Jacobson and Truax27 The participants with a reliable positive change (greater than −8.99 points on the CES-D) were classified as ‘reliably improved’. Next, we determined the number of participants who had scores below 23 on the CES-DReference Hautzinger, Bailer, Hofmeister and Keller22 in both groups and who were also categorised as being reliably improved.Reference Jacobson and Truax27 We assumed that the participants who fulfilled both of these criteria achieved a clinically relevant improvement; accordingly, we labelled them as participants with a ‘treatment response’. The utility scores obtained with the British tariffs for the EQ-5D were used to calculate the QALYs gained or lost during the 6-month study period. QALYs gained per individual in each group during the trial period were calculated using linear interpolation between measurement points (baseline, 2 months, and 6 months) and then accumulating these points over time using the area under the curve (AUC) method.Reference Matthews, Altman, Campbell and Royston37
Analysis of costs
The costs were determined at baseline and at the 6-month follow-up. Missing data were completed using the regression imputation methods in Stata version 13.0. Because group allocation was a significant predictor of missing cost data, it was used as predictor in this model. The cumulative costs for each participant during the 6-month follow-up period were estimated by calculating the AUC of linearly interpolated 1-month costs, adding the respective intervention costs to both groups.
Analysis of cost-effectiveness and cost utility
For the cost-effectiveness and cost-utility analyses, the costs and effects were calculated for a 6-month period. In both analyses, the incremental cost-effectiveness ratio (ICER) was calculated using the following formula:
 $${\rm ICER = \;} \displaystyle{{{\rm cost\; IG} - {\rm cost\; CG}} \over {{\rm effect\; IG} - {\rm effect\; CG}}},$$
where IG refers to the intervention group and CG refers to the control group.
The incremental cost-utility ratio (ICUR) was computed in the same manner. The non-parametric bootstrap resampling techniques (with 2500 replications) were used to consider the uncertainties surrounding the ICER and the ICUR. The bootstrap analyses were performed using Microsoft Office Excel 2010. The results are presented in a cost-effectiveness plane. The intervention is acceptable if lower costs are associated with more treatment responses (south-east quadrant). In this case, the intervention ‘dominates’ the active control group. If the ICER/ICUR falls in the north-east quadrant, the intervention is estimated to generate superior health outcomes at greater costs. In the north-west quadrant, the intervention is estimated to be inferior, with higher costs and losses in health compared with the control group (worst possible outcome of the intervention); the intervention is then unacceptable from a cost-effectiveness perspective. If the ICER/ICUR falls in the south-west quadrant, the intervention is estimated to produce inferior health outcomes compared with the control, but at lower costs.
When the bulk of simulated ICERs fall in the north-east quadrant, we must determine whether the extra health gains are worth the extra costs. To answer that question, an incremental cost-effectiveness acceptability curve was estimated.Reference Barrett and Byford38 This curve shows the probability that the intervention is cost-effective compared with the psychoeducation control group over a range of willingness-to-pay (WTP) ceilings to pay for one treatment response or for one QALY gained. This approach reflects the idea that people are generally willing to pay for health improvements, although there is no consensus on the WTP threshold for one QALY gained.Reference Hirth, Chernew, Miller, Fendrick and Weissert39
Sensitivity analyses
Three sensitivity analyses of intervention costs were conducted to test the robustness of the findings. In the primary analysis, we estimated intervention costs to be €283.46. Given the fact that web-based interventions are not implemented into routine care in Germany, there is uncertainty concerning these costs. We therefore repeated all of the analyses assuming different intervention costs; i.e. by reducing the costs by 50% (€141.73), increasing costs by 50% (€426.19) and increasing costs by 100% (€566.92).
Results
Sample
Over half of the participants (n = 142, 55%) had physician-diagnosed type 2 diabetes. A lot of the participants reported a long diabetes duration, e.g. 46% (n = 119) had been living with type 1 or type 2 diabetes for more than 10 years. The participants were middle aged (mean = 51 years), well educated (45% college qualification or higher) and predominantly female (63%). At baseline, their mean CES-D score was 32, which indicates a highly depressed target group.Reference Hautzinger, Bailer, Hofmeister and Keller22, Reference Radloff23 The DSM-IV (1994)40 depression diagnosis was measured with a telephone-administered Structured Clinical Interview for DSM-IV Axis I Disorders.Reference First, Spitzer, Gibbon and Williams41 The most common diagnosis was partially remitted depression (34%), followed by recurrent major depression (30%) and current major depression (24%). Overall, 80 (62%) out of the 129 participants from the intervention group completed all six sessions at 2 months follow-up. Detailed sample information is presented in a previous paper.Reference Nobis, Lehr, Ebert, Baumeister, Snoek and Riper12
Study drop outs
The ITT analysis included 256 participants because 4 participants (IG = 1; CG = 3) requested the deletion of their data, as permitted under the medical ethics rules in Germany. After 6 months, 182 (71%) of the 256 participants completed the web-based questionnaires. A higher drop-out rate was observed in the intervention group (n = 49; 38%) compared with the control group (n = 25; 20%).
Outcomes
Treatment response
In the intervention group, 90 (70%) of the 129 individuals were classified as being reliably improved and 77 (60%) of these 90 participants also had a CES-D below 23 and, thus, reached a treatment response at the 6-month follow-up assessment. In comparison, 23 (18%) of the 128 individuals in the control group reached a treatment response at the 6-month follow-up. These findings correspond to a likelihood ratio of 0.60/0.18 = 3.35 (95% CI = 2.25–4.97), indicating that the likelihood of a favourable outcome was more than tripled for the intervention group. The likelihood difference between the groups was 0.60–0.18 = 0.42 (95% CI = 0.31–0.53), and its inverse 1/0.42 indicated a number needed to treat of 2.37 (95% CI = 1.89–3.18).
QALYs
For the control group, the average utility score was 0.61 (s.d. = 0.26) at baseline, 0.63 (s.d. = 0.27) at post-measurement (2 months) and 0.69 (s.d. = 0.19) at the 6-month follow-up. For the intervention group, the mean utility score was 0.62 (s.d. = 0.25) at baseline, 0.66 (s.d. = 0.27) at post-measurement (2 months) and 0.69 (s.d. = 0.18) at the 6-month follow-up.
After applying the AUC method, the mean QALYs gained in the intervention group was 0.33 (s.d. = 0.11) compared with 0.32 (s.d. = 0.11) in the control group after 6 months. No significant differences were found between the groups (F 1254 = 0.42, P = 0.51).
Costs
The average costs accumulated per participant over the 6-month period are presented in Table 1 for direct medical, direct non-medical and indirect costs. The results are reported for both groups and for the differences between the groups.
Table 1 Average cost per participant (in €) by condition at the 6-month follow-up
a. Contacts with general practitioner, specialist in internal medicine or other.
b. Contacts with psychologist, psychotherapists or neurologists.
c. For example, physiotherapy or osteopathy.
d. Time for health activities, time taken by health experts for homework assignments and waiting times by general practitioner.
e. In concordance with the human capital approach, we included only the participants who were able to work (e.g. excluding retired persons). We included 72 participants in the control group and 70 participants in the intervention group.
The GET.ON M.E.D. intervention was calculated at €283 per participant, whereas the added cost of psychoeducation in the control group was €33. After 6 months, the direct costs were, on average, higher in the intervention group compared with the active control group. Regarding the indirect costs, the individuals in the intervention group produced higher absenteeism costs but fewer presenteeism costs than those in the control group. Moreover, the domestic help costs were lower in the intervention group. Overall, the average cost per participant in the intervention group was €5195 compared with €5098 in the control group. The mean costs were therefore €97 higher in the intervention group than in the control group after 6 months.
Cost-effectiveness
In summary, (a) the intervention resulted in more participants with a favourable treatment response compared with the psychoeducation control group (60 v. 18%), and (b) the intervention group had a higher average cost per participant (€5195 v. €5098). The substitution yield is therefore (5195–5098)/(0.60–0.18) = 233; meaning that for each participant that receives the GET.ON M.E.D. intervention (with a treatment response) instead of the psychoeducation, an extra cost of €233 is incurred.
In the cost-effectiveness plane (Fig. 1), the majority of the simulated ICERs were located in the north-east quadrant, indicating a 54% probability that the intervention generates better clinical outcomes compared with the control, but the intervention is also associated with additional costs. The other ICERs fell in the south-east quadrant, indicating a 46% probability that better health outcomes are achieved for lower costs in the intervention group compared with the control group.
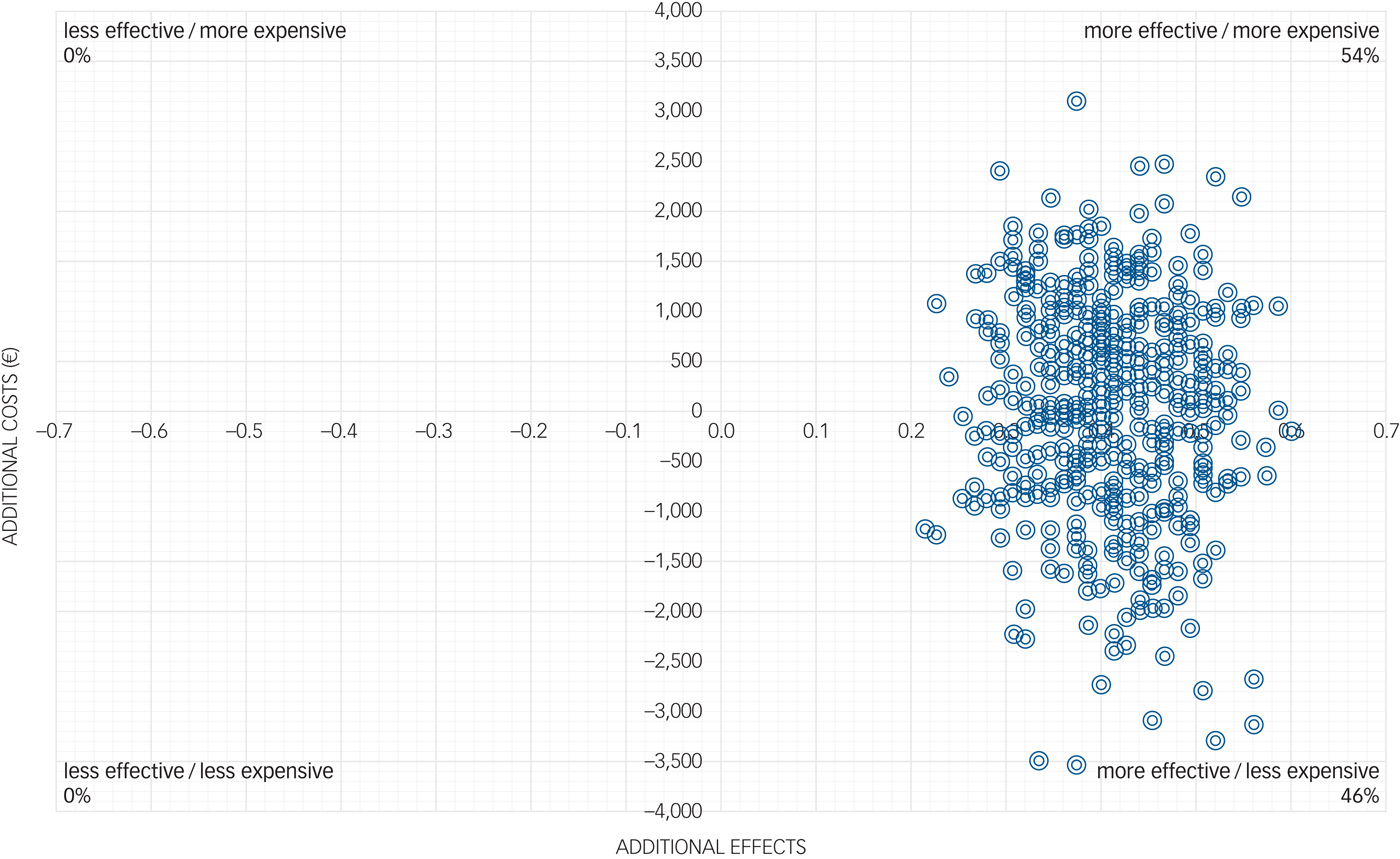
Fig. 1 Cost-effectiveness plane for the costs and treatment response of the participants.
Figure 2 shows that a 48% probability that the intervention was cost-effective at a WTP of €0 per treatment response compared with the control group. This probability increased to well above the 50% probability cut-off (64%) if society is willing to pay €1000 for a treatment response. The probability that the intervention was cost-effective at a WTP of €5000 per treatment response was 97%.
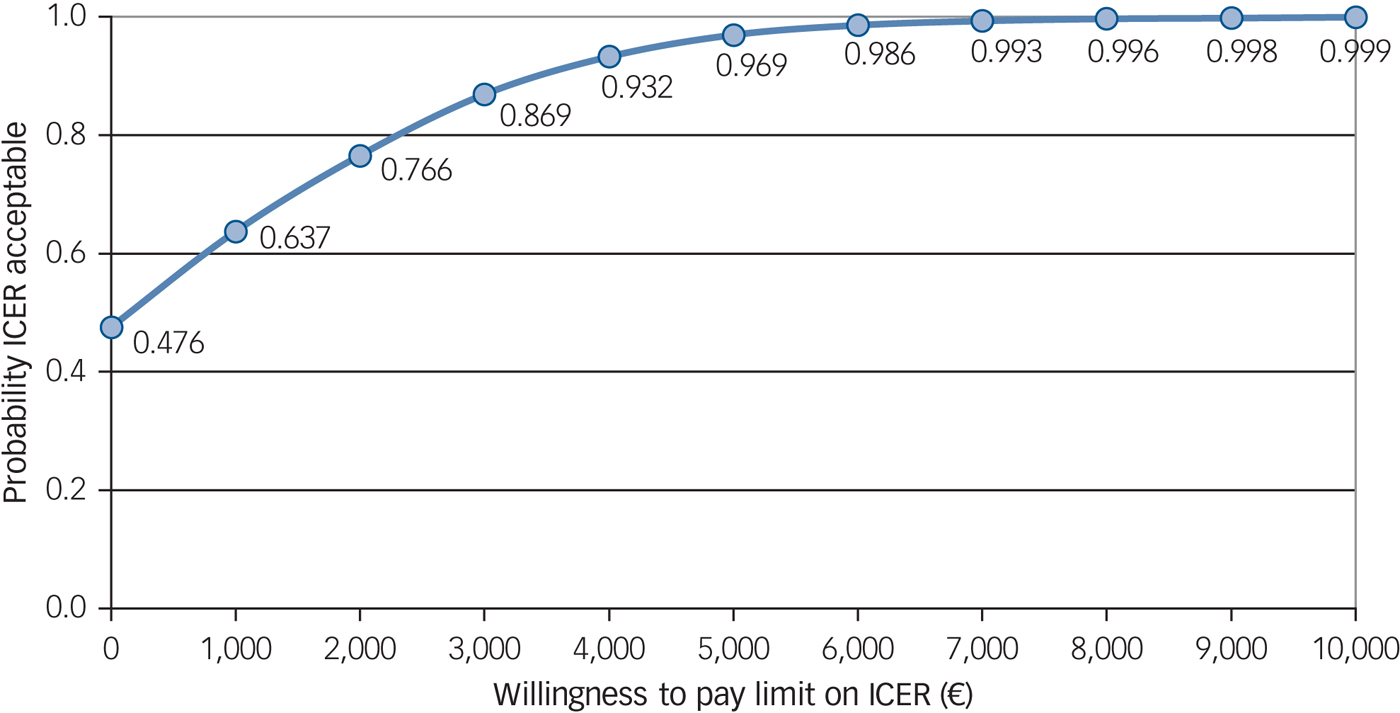
Fig. 2 Cost-effectiveness acceptability curve for the costs and treatment response of the participants.
Cost utility
The estimated costs for the participants in the intervention were higher (€5195 v. €5098) and the effects on QALYs were slightly better but not statistically significant (0.33 v. 0.32). The cost-utility analysis showed that the ICER for the intervention v. the psychoeducation control group resulted in €10 708 per QALY gained. Hence, each QALY gained by offering GET.ON M.E.D. instead of psychoeducation required an extra cost of €10 708.
Of the simulated ICURs, 37% fell in the north-east quadrant, indicating a 37% probability that the intervention generates more QALYs – but at higher costs – compared with the control. The south-east quadrant contained 13% of the ICURs, indicating that the intervention is both less costly and more effective. The acceptability curve showed a 46% likelihood that the intervention should be regarded as more cost-effective than psychoeducation when the WTP for gaining a QALY is nil. The probability of GET.ON M.E.D. being more cost-effective increases to 51% when the WTP for gaining a QALY is increased to €14 000, which is well below a conservative WTP ceiling of € 20 000 per QALY gained.Reference Hirth, Chernew, Miller, Fendrick and Weissert39
Sensitivity analyses
We conducted three sensitivity analyses (Table 2) for the costs of the GET.ON M.E.D. intervention because there was uncertainty concerning the price when implementing the intervention into routine care. In the first scenario, in which we assumed 50% lower costs of the intervention, each individual with a treatment response would be associated with a cost saving of €86 compared with the control group after 6 months. In the second and third scenarios, the ICERs increased to €596 and €933, i.e. the intervention cost was estimated to be 50% and 100% more expensive, respectively. However, in all of the cases, there is nearly a 100% probability of falling below a WTP of €10 000.
Table 2 Incremental cost-effectiveness ratio for the control group compared with three adjusted versions of costs for the GET.ON M.E.D. intervention
Discussion
Main findings
This study evaluated the cost-effectiveness and cost utility of a minimally guided, web-based, self-help intervention for individuals with types 1 and 2 diabetes mellitus aimed at reducing symptoms of depression, compared with an active psychoeducation control group.
After 6 months, 60% of the individuals who had received the GET.ON M.E.D. intervention showed treatment response compared with 18% of the control group. However, treatment response was not reflected in corresponding gains of QALYs, as we found no statistically significant difference between the conditions after 6 months. The EQ-5D is regarded as a standard measurement instrument to measure QALYs. However, it is unclear whether EQ-5D is sensitive enough to detect changes in quality of life for patients with mental health problems.Reference Mihalopoulos, Chen, Iezzi, Khan and Richardson42, Reference Turner, Campbell, Peters, Wiles and Hollinghurst43 Moreover, another explanation is that the impact of the intervention was not large enough to improve the quality of life of the intervention group compared with the control group.
In the cost-effectiveness and cost-utility analyses, we demonstrated that the intervention showed a higher probability of being regarded as cost-effective compared with the control condition from a societal perspective. At a WTP ceiling of €5000 for a treatment response, the intervention had a 97% probability of being regarded as cost-effective. Moreover, when the WTP ceiling for gaining a QALY was €14 000, the intervention had a 51% probability of being the preferred option, which is slightly below a conservative WTP ceiling of €20 000 per QALY gained.
Comparison with findings from other studies
To the best of our knowledge, this study is the first to evaluate the cost-effectiveness of a web-based, guided, self-help intervention for individuals with diabetes and comorbid depression. Hence, only a comparison with cost-effectiveness studies concerning web-based interventions for depression in general is possible. We identified five other studies evaluating the cost-effectiveness of a web-based depression intervention.Reference Hollinghurst, Peters, Kaur, Wiles, Lewis and Kessler16–Reference Geraedts, van Dongen, Kleiboer, Wiezer, van Mechelen and Cuijpers20 For example, Warmerdam and colleaguesReference Warmerdam, Smit, van Straten, Riper and Cuijpers17 conducted a cost-utility and cost-effectiveness study of internet-based treatments for adults with depression at a 3-month follow-up. In the cost-effectiveness analyses, offering CBT resulted in additional costs of €1817 for each additional participant, with a clinically significant change in the severity of symptoms of depression. At a WTP of zero for a clinically significant change in depressive symptoms, the probability that CBT was more cost-effective than the waiting list was approximately 30%. They found that the cost of gaining one QALY by participating in web-based CBT (iCBT) was €22 609 compared with a waiting list control. Without any WTP for gaining a QALY, the probability that iCBT was more cost-effective than the waiting list group was 28%.Reference Warmerdam, Smit, van Straten, Riper and Cuijpers17 The economic evaluations from Hollinghurst,Reference Hollinghurst, Peters, Kaur, Wiles, Lewis and Kessler16 GerhardsReference Gerhards, de Graaf, Jacobs, Severens, Huibers and Arntz18 and McCroneReference McCrone, Knapp, Proudfoot, Ryden, Cavanagh and Shapiro19 also concluded that iCBT had a high probability of being cost-effective. Recently, Geraedts and colleaguesReference Geraedts, van Dongen, Kleiboer, Wiezer, van Mechelen and Cuijpers20 conducted an economic evaluation of a web-based guided depression intervention for employees compared with care as usual after 12 months. With a WTP of zero, the intervention's probabilities of cost-effectiveness was 65% from a societal perspective and 55% from an employer's perspective However, they concluded that the intervention was not a cost saving from an employer's perspective.Reference Geraedts, van Dongen, Kleiboer, Wiezer, van Mechelen and Cuijpers20
The results of this study underline the potential of web-based interventions as an additional, cost-effective treatment opportunity in reducing symptoms of depression. However, the evidence for the cost-effectiveness of web-based depression interventions is limited and has little bearing on our study because the differences in healthcare systems and study participants may confound outcomes.
Limitations
The first limitation of this study is the attrition rate at the 6-month follow-up, which was substantial at 29%. We used ITT analyses and imputation techniques to handle missing data for both effects and costs.Reference Schafer and Graham36, Reference Faria, Gomes, Epstein and White44 However, we cannot exclude a potential bias due to missing data. Second, this study was not powered to statistically test the health economic differences. Rather, we relied on non-parametric and medical decision-making techniques to make inferences.Reference van Hout, Al, Gordon and Rutten35 Third, the costs and effects were evaluated over 6 months. It is, therefore, not possible to draw conclusions about the longer-term follow-up or the dynamic development of costs. Fourth, we only focused on the societal perspective; other perspectives, such as that of the healthcare payer, are also important. Fifth, we did not include costs for diabetes drugs; these costs can have a huge impact on diabetes-related costs and further studies should focus on this. Our findings should thus be interpreted with caution.
Conclusion
To summarise, the GET.ON M.E.D. intervention has been shown to have a high probability of being cost-effective in treating comorbid symptoms of depression in individuals with type 1 or type 2 diabetes mellitus compared with an active psychoeducation control group, especially from a cost-effectiveness perspective. Given the increasing number of individuals with diabetes and symptoms of depression, and the fact that only a small number of these people are reached by currently available healthcare services,Reference Egede and Ellis45 further research is necessary to compare such web-based interventions with routine treatment so that policy recommendations can be made.
Funding
The European Union funded this study (EU EFRE: ZW6-80119999, CCI 2007DE161PR001).
Acknowledgement
We thank S.N., who is the guarantor of this work and, as such, had full access to all the data in the study and takes responsibility for the integrity of the data and the accuracy of the data analysis.


eLetters
No eLetters have been published for this article.