

Overview
Global economic growth last year was 3.7 per cent, the strongest since 2011, and our analysis has revealed that recent growth has been broad-based, with a very high degree of synchronisation across countries.1 Our forecasts continue to show the 2017–19 period to be the strongest 3-year period for the global economy since 2011–13. However, there are now some signs of potential for weakening. Albeit in a small number of countries, some economic problems have arisen in the past six months. We expect that these will have the effect of constraining any further increase in the pace of global growth as well as adding to the uncertainties in the outlook.
The profile for global growth is only slightly stronger than anticipated a year ago, but the strengthening of US growth is a feature of the economic outlook. Even though global growth is strong relative to the years of recovery after the Great Recession, it is weaker than in the decade leading up to that event. As figure 1 shows, this feature is the case for both the advanced economies (AE) and the Developing and emerging economies (EM). Average annual growth since 2011 has been almost 1 percentage point a year weaker for both country groups than in the decade leading up to the Great Recession. The slower – but still rapid relative to the rest of the world – growth in China in the recent past accounts for part of the reduction in the pace of EM growth and, with some potential for slowing of ‘catch-up’ growth generally, had been expected to occur as the development phase of that country changed. The slow pace of the prolonged recovery phase in the US relative to previous economic cycles was highlighted in the August 2018 Review and has also been a feature of the main economies in Europe.2

Figure 1. GDP growth in advanced and emerging economies
As anticipated in the August Review, the weakness in the first quarter for some advanced economies reversed in the second quarter, supporting our ‘soft patch’ narrative. This was notable in the US but the UK, Canada, Japan and New Zealand all saw stronger growth. We continue to expect that growth will be steady in the advanced economies and that in the medium term its pace will moderate a little further. For example, the most recent Federal Reserve projections show a longer-run GDP growth rate of 1.8 per cent for the United States (an outlook close to ours), which is markedly lower than the expected outturn of close to 3 per cent growth this year.
While our overall forecast judgement on growth is little changed from August, with the global economy likely to continue growing this year at a pace slightly below 4 per cent, there are some signs of the synchronised pattern of growth changing. Setting aside the economic turmoil in recent months in Venezuela, Argentina and Turkey, South Africa moved in to recession in the second quarter when GDP fell again and Brazil has seen its quarterly growth rates slip this year, with outturns substantially lower than in the same quarters of 2017.
These events may reflect idiosyncratic shocks in individual economies or they may be early indicators of some of the uncertainties or imbalances in the global economic outlook starting to materialise. With policy interest rates in the US rising (and projected to increase further) and the US dollar having strengthened by almost 7 per cent from its low in January, these effects could be transmitted to other economies, creating spillover effects that will be outside their domestic control, for example on companies that may have borrowed substantially in US dollars. Our expectation that the current relatively rapid pace of US economic expansion will not last could also play into a reduced growth of demand for imports into the US, especially in an environment in which higher tariffs are being actively discussed. However, those exporting countries would also see effects coming from other changes, for example on exchange rates.
As growth in the advanced economies progresses, this should lead to more evident pressures on capacity and skills and be reflected in upward pressure on inflation and a greater tendency of policy to move towards less accommodative monetary policy. We discussed the importance of oil prices in the February 2018 Review, and they are now 20 per cent higher than at the start of this year.3 The issue of the extent to which this increase, together with continued economic growth and tighter labour markets will lead to faster wage growth and higher inflationary pressure, remains a key risk for the outlook.
So far in the expansion, inflation has not been a problem in the advanced economies. In the US the increases in policy rates have been a part of a process of normalisation and our expectation remains that this process will spread. Our forecast does not assume dramatic changes in policy interest rates – rather a general gradual upward path of interest rates, broadly in line with recent market expectations, in response to continuing growth and a concern about the possible upward bias to inflation that might be created in advanced economies from capacity pressures. As the forecast horizon extends, a combination of slowing domestic demand growth arising from demographic trends and somewhat higher interest rates is expected to feed into slower global growth. Reflecting anticipated trends in demographics, productivity and structural factors and an anticipation of slower growth in China as the economy continues its transformation, our medium-term forecast continues to expect global growth to run at around 3.5 per cent a year, with growth in the advanced economies continuing to be below that in the emerging economies where potential for ‘catch-up’ continues to exist.
Box A. Trade wars – the saga continues
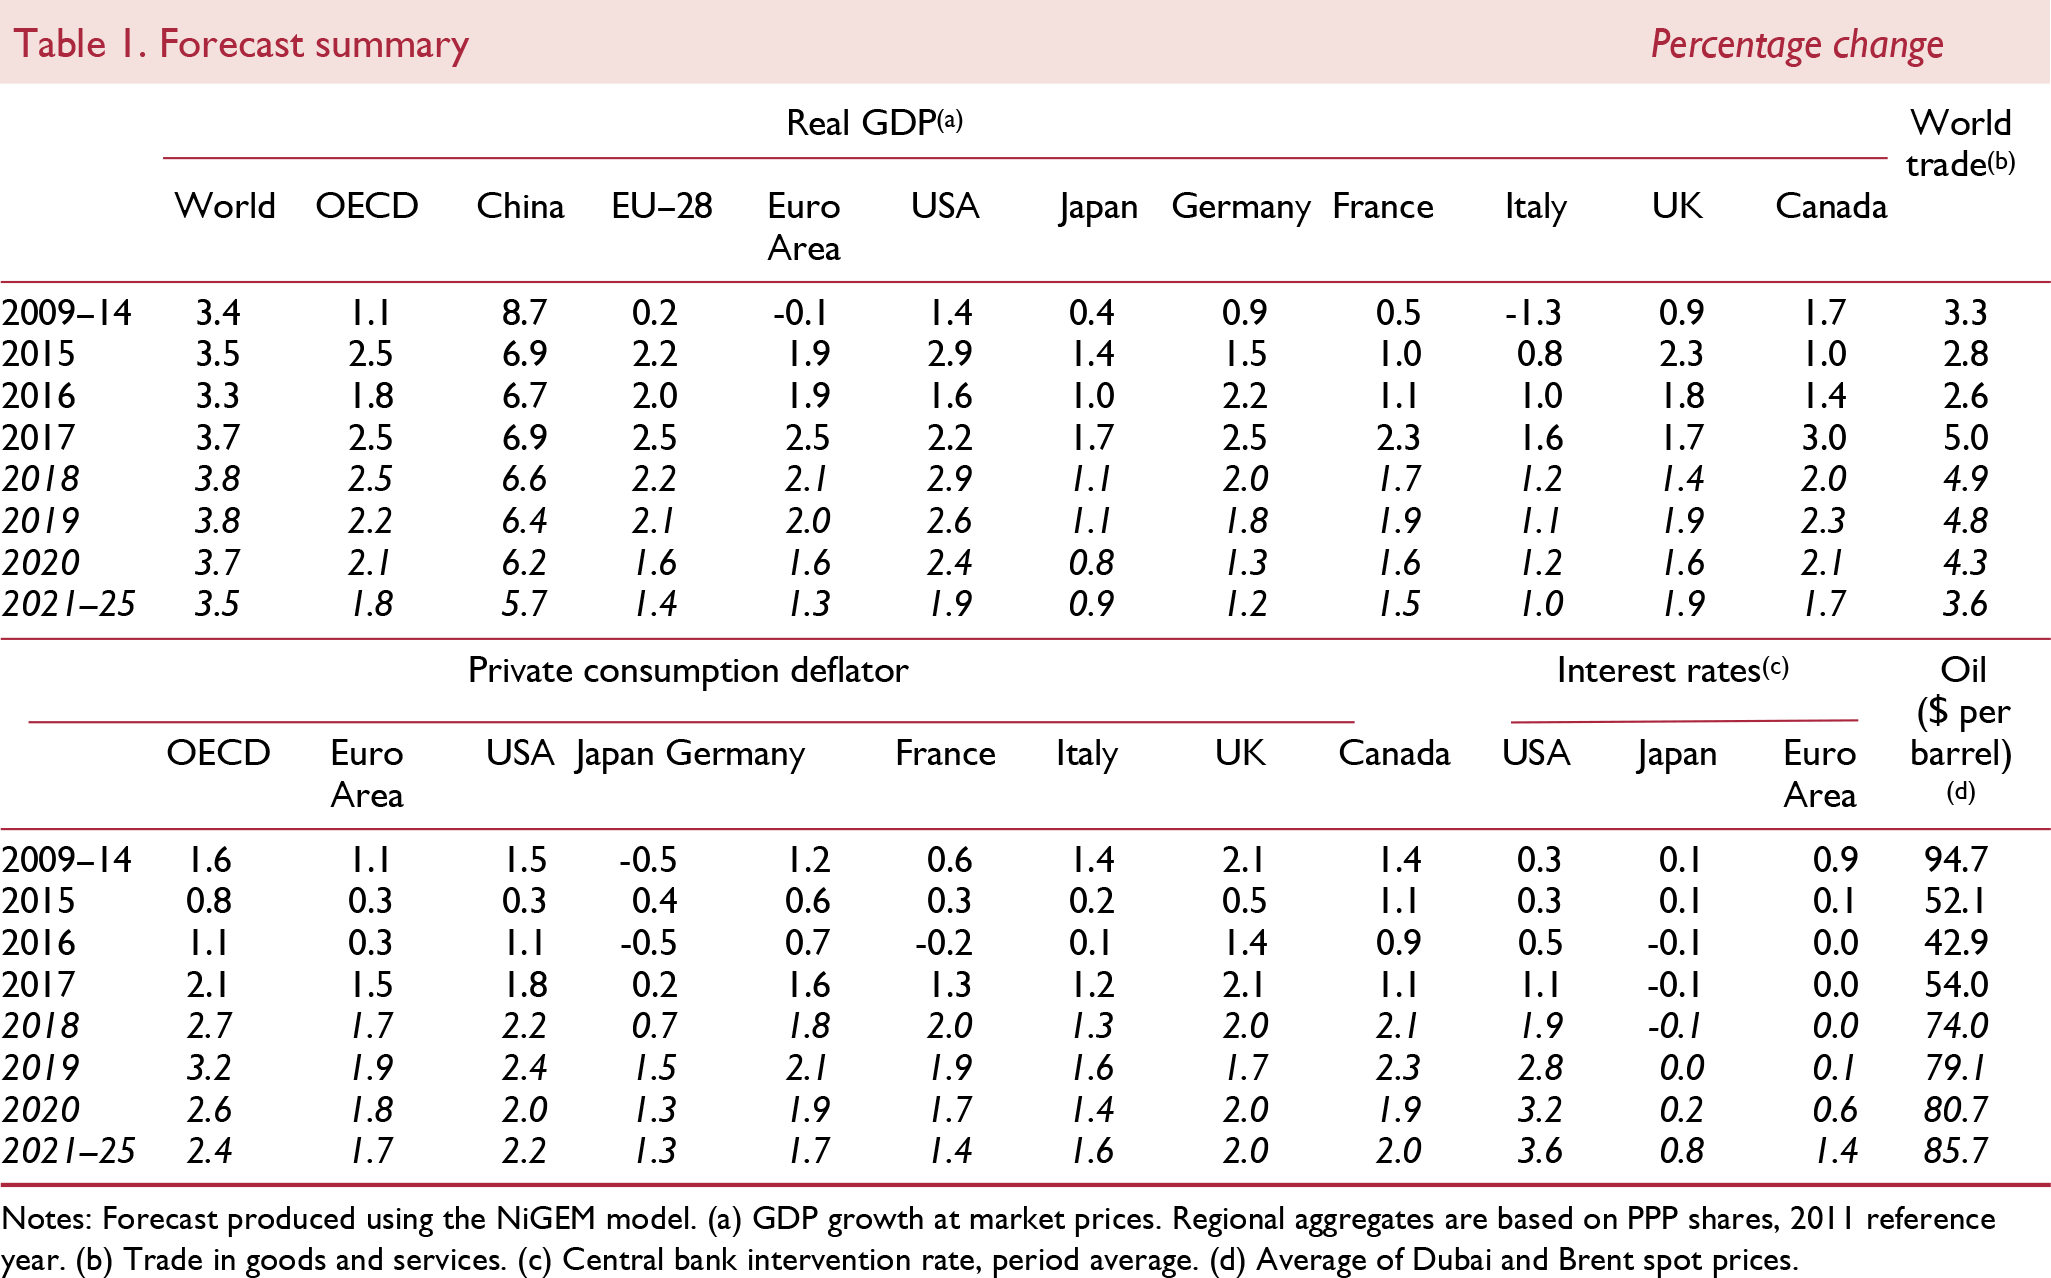
The trade dispute between the US and China has not abated. On 24 September, the US imposed a 10 per cent tariff on an additional $200bn imports from China (about 43 per cent of total US imports from China and 8 per cent of total Chinese exports of goods and services) with the possibility of a further increase in the rate to 25 per cent in January 2019. The Chinese authorities retaliated by imposing 5–10 per cent tariffs on $60bn of Chinese imports from the US.
We continue earlier analysis presented in recent Reviews and NIGEM Observations – Reference Carreras and RaminaCarreras and Ramina (2017), Reference Hantzsche and LiadzeHantzsche and Liadze (2018) and Reference Liadze and HaccheLiadze and Hacche (2017) – on the impact of the imposition of tariffs by the US. Here we look at the effect on output in selected countries from the latest round of tariff impositions. As before, we run stylised simulations using the National Institute's Global Econometric Model (NiGEM).Footnote 1 Two sets of simulations were conducted. Initially 10 per cent duties are assumed to be applied both to $200bn worth of US imports from China as well as to $60bn worth of Chinese imports from the US. The second simulation assumed a further increase in the 10 per cent levy on US imports from China to 25 per cent. We use an increase in import prices as a proxy for the tariff increase, i.e. we assume that higher tariffs raise import prices. Shocks are applied exogenously for 2.5 years and then slowly allowed to return back to base as prices adjust.
Figures A1 and A2 illustrate the average impact on the level of GDP for a range of economies over a 3-year period. Our analysis suggests that the loss of output in the US and China from the imposition of 10 per cent tariffs by both the US and China would be modest at around 0.1 per cent and 0.2 per cent of GDP respectively. However, the adverse impact on GDP broadly doubles when the levy on Chinese exports to the US increases to 25 per cent, with Chinese output declining on average by 0.4 per cent. World GDP falls by about 0.2 per cent relative to base.
Higher tariffs depress both exports and imports through the direct impact on higher export and import prices. Higher import prices pass through to domestic prices and reduce the real purchasing power of consumers and hence consumption. At the same time, monetary policy reacts to higher domestic prices by increasing interest rates, leading to higher borrowing costs and thus lowering incentives to invest. As a result, lower domestic demand, coupled with a negative impact on exports and imports leads to the lower level of world trade. So in our simulations world trade falls (relative to baseline), at its trough by about 0.35 per cent, when tit-for-tat 10 per cent tariffs are imposed by the US and China. This reduction would increase to about 0.7 per cent when tariffs on Chinese exports to the US increase further to 25 per cent.
Estimated spillover effects on selected economies from the bilateral US/China trade dispute are presented in figure A2. These capture effects from trade linkages and the sensitivity of exports to demand in the US and China as well as the impact from competitiveness amongst countries, as exporters compete with others who export to the same market as well as domestic producers, via relative prices. For some economies (such as Canada and India) the direct effect from lower foreign demand will be a dominant factor, for others a reduction in demand for imports will be somewhat counteracted by gains from improved competitiveness, thus lessening an overall negative impact.
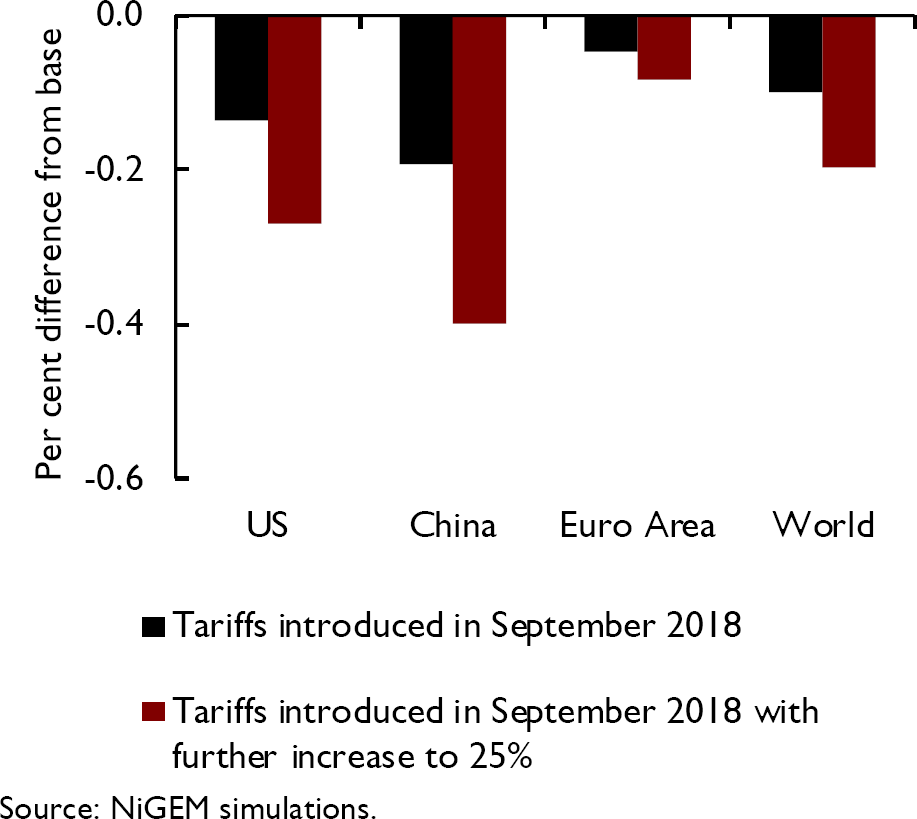
Figure A1. Average impact on the level of GDP (over three years)

Figure A2. Average impact (over three years) on GDP in selected economies
As in our previous analysis, we did not take into account any effects from uncertainty related to the future trade environment, which could depress business investment and/or private consumption via deferred spending or wealth effects and thus exacerbate the negative impact on output.
Note
1 An expanded version of NiGEM v3.18c, which enables tariffs to be imposed between the US and all countries and regions, was used in the analysis. This analysis assumes that monetary policy reacts to deviations from nominal GDP and inflation targets and financial markets are forward looking and respond to expected changes in interest rates.
Recent developments and the baseline forecast
Recent economic developments
The partial signs of slowing growth in several advanced economies in the first quarter have now been replaced by some signs of a stronger second quarter performance. Whether the earlier signs reflected specific factors such as adverse weather is hard to say with any certainty. Export growth surveys had generally pointed to slower growth but these might have been heavily influenced by the uncertainty following the protectionist rhetoric and tariff actions from the US. Activity on tariffs has intensified recently, with the earlier US threat to impose 10 per cent tariffs on $200bn of Chinese imports effective from 24 September and those tariffs could increase to 25 per cent on 1 January 2019. The Chinese authorities have responded by imposing tariffs (of 5 or 10 per cent) on $60bn of US goods.
With the US government threatening to extend the range of tariffs to all Chinese goods imports, trade uncertainties clearly remain. But on the positive side, the USMCA agreement between the US, Mexico and Canada has been negotiated. It still needs to be ratified by all these governments. Aside from increased domestic content for cars to qualify for zero tariffs and US farmers gaining greater access to Canadian dairy markets, it appears to mark only a relatively small change to the NAFTA agreement. In addition, the EU has concluded a trade agreement with Japan. So not all the news on trade has been negative.
In the Euro Area growth of 2.5 per cent in 2017 showed a rebound from 2016's 1.9 per cent. The 2017 pace and composition of growth looked unsustainable and it has moderated. We forecast growth of 2.1 per cent this year and 2.0 per cent next. The continued period of growth has led to unemployment falling, but it still remains high in some economies by pre-recession standards. Inflation within the Euro Area has remained subdued, enabling the ECB to continue its accommodative monetary policy. The degree of accommodation is set to reduce. The ECB announced at its June meeting that it anticipated that quantitative easing would end in December. However, it also announced that policy interest rates were expected to remain at present levels at least through the summer of 2019.
Among the emerging economies, India and China continue to show growth well ahead of the global average and countries such as Vietnam and the Philippines are also growing strongly. Turkey saw strong growth in 2017 (7.4 per cent) although it was accompanied by rapid inflation and during the middle of this year the economy has seen the Turkish Lira falling by about 40 per cent against the US dollar between late April and the middle of August and interest rates rising to 24 per cent to try to stabilise the currency. Argentina and Venezuela have continued to deal with severe economic problems and both have seen very rapid inflation.
Our revised baseline forecast
Taken as a whole, the recent economic news has been marginally weaker than anticipated six months ago, with the major change being the implementation of new tariffs on trade between the US and China. As Box A explains, based on simulations of our NiGEM model, our expectation of the effects of the recent increases in tariffs is that over a 3-year period global growth will be about 0.1 percentage point lower than otherwise. Furthermore, small shortfalls in growth will be widespread as a consequence of trade transmission effects. However, the US has had a fiscal expansion which gives a boost to US and global economic activity. The net result of these factors and the recent data flow has led us to reduce our forecast for global growth marginally – in 2018 from 3.9 per cent to 3.8 per cent, with 2019 unchanged at 3.8 per cent. These are minor adjustments and well within any tolerance level of statisticians’ ability to measure global growth. Recent developments suggest that the global growth cycle may be peaking. Now may be, in terms of the pace of global growth, ‘as good as it gets’ but, if some countries are seeing growth boosted by excess demand, a very gradual slowing in growth may well be a positive factor for sustainable growth as it suggests that adjustment is taking place smoothly.
Overall, our central expectation is for global output growth to continue at a robust pace relative to the past decade and for steady growth paths to be experienced by both advanced and emerging economy groupings. In the medium term, we expect the pace of GDP growth to be weaker than in the near term, running at an annual rate of around 3.5 per cent, reflecting a continued narrowing of output gaps in the expansion phase after the Great Recession, slower demographic growth and a gradual deceleration in growth in China. The risks around the forecast are illustrated by the fan chart for global economic growth shown in figure 2.
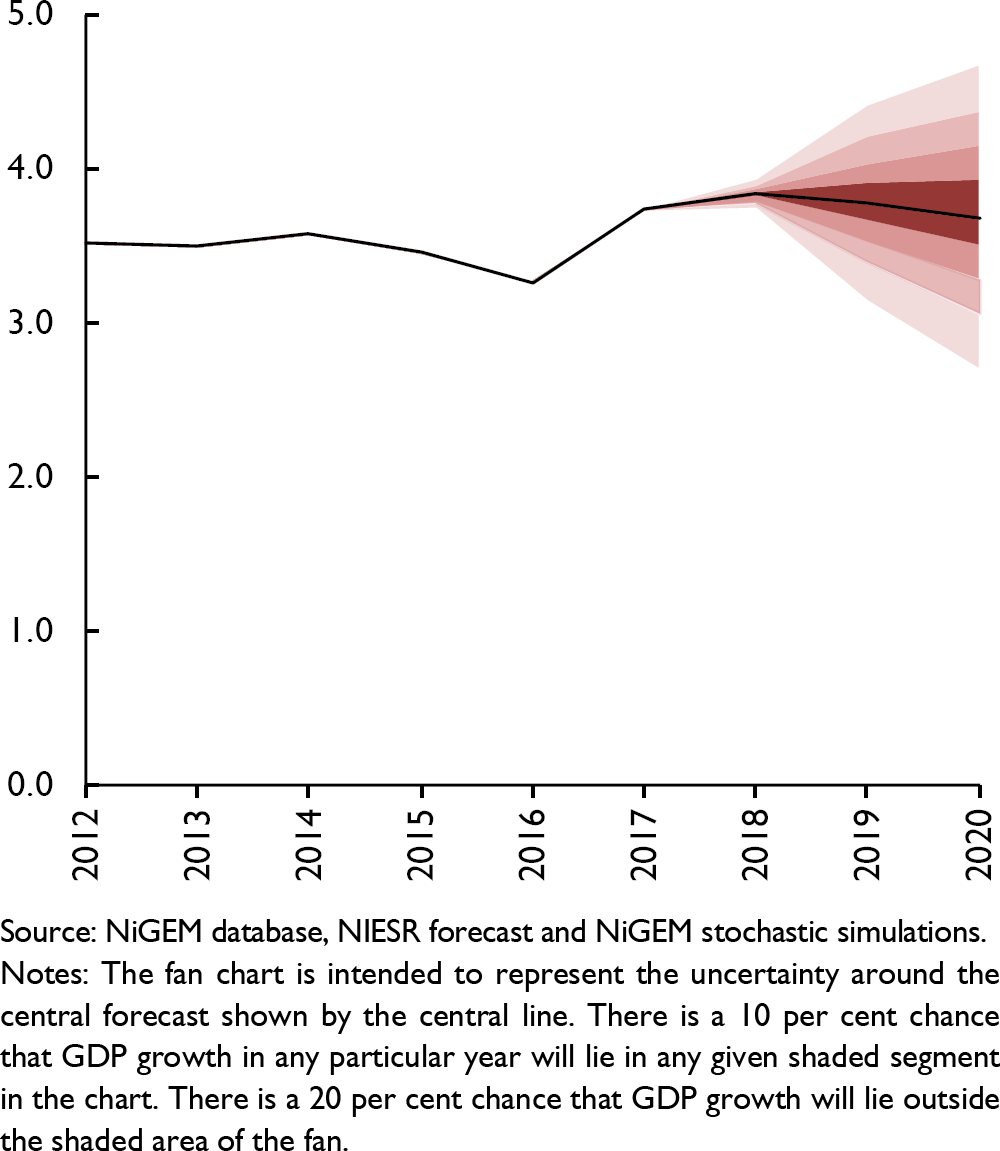
Figure 2. World annual GDP growth fan chart (per cent per annum)

Figure 3. World GDP growth and its components
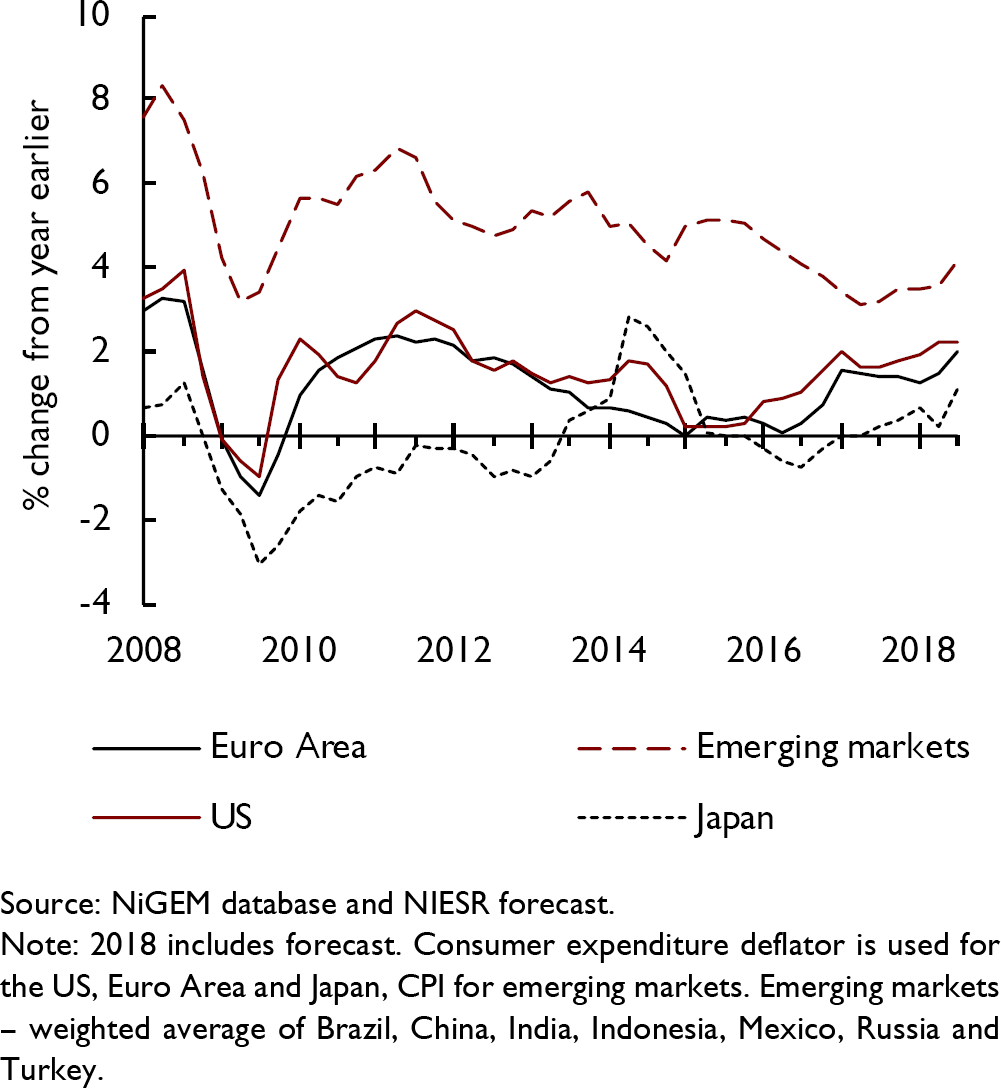
Figure 4. Consumer price inflation
We continue to expect inflation to run faster than in 2014–16 but to be broadly in line with policy targets. Lower headline unemployment rates, reports of skilled labour shortages and rising wage pressures in some advanced economies, could mean that capacity pressures are building which could increase inflation.4 In the US, the pro-cyclical fiscal boost earlier this year might contribute to capacity problems and so create pressures for inflation to rise above its target, something that it has stubbornly refused to do so far. However, our expectation is that, with a few exceptions such as Argentina and Turkey, the near-term prospects are for inflation to remain low and stable.
Box B. Global spillover effects of US monetary tightening
In 2013 the unexpected announcement by the US Federal Reserve of a possible reduction in the pace of bond purchases led to a substantial increase in US 10-year bond yields and an appreciation of the US dollar in what became known as the taper tantrum. While the period was short-lived, these changes in the US had effects on other economies, particularly via higher long-term interest rates and falling equity prices in some emerging markets (Reference Sahay, Arora, Arvanitis, Faruqee, N'Diaye and Mancini-GriffoliSahay et al., 2014). Since then, US monetary policy changes have been both gradual and within expectations. Having already raised its policy rate to the 2–2.25 per cent range, the US Federal Reserve is expected to raise policy interest rates further, with the latest ‘dot plot’ chart showing the median expectation for rates in 2021 at 3.4 per cent, a further 1 percentage point increase above the 2018 expectation.
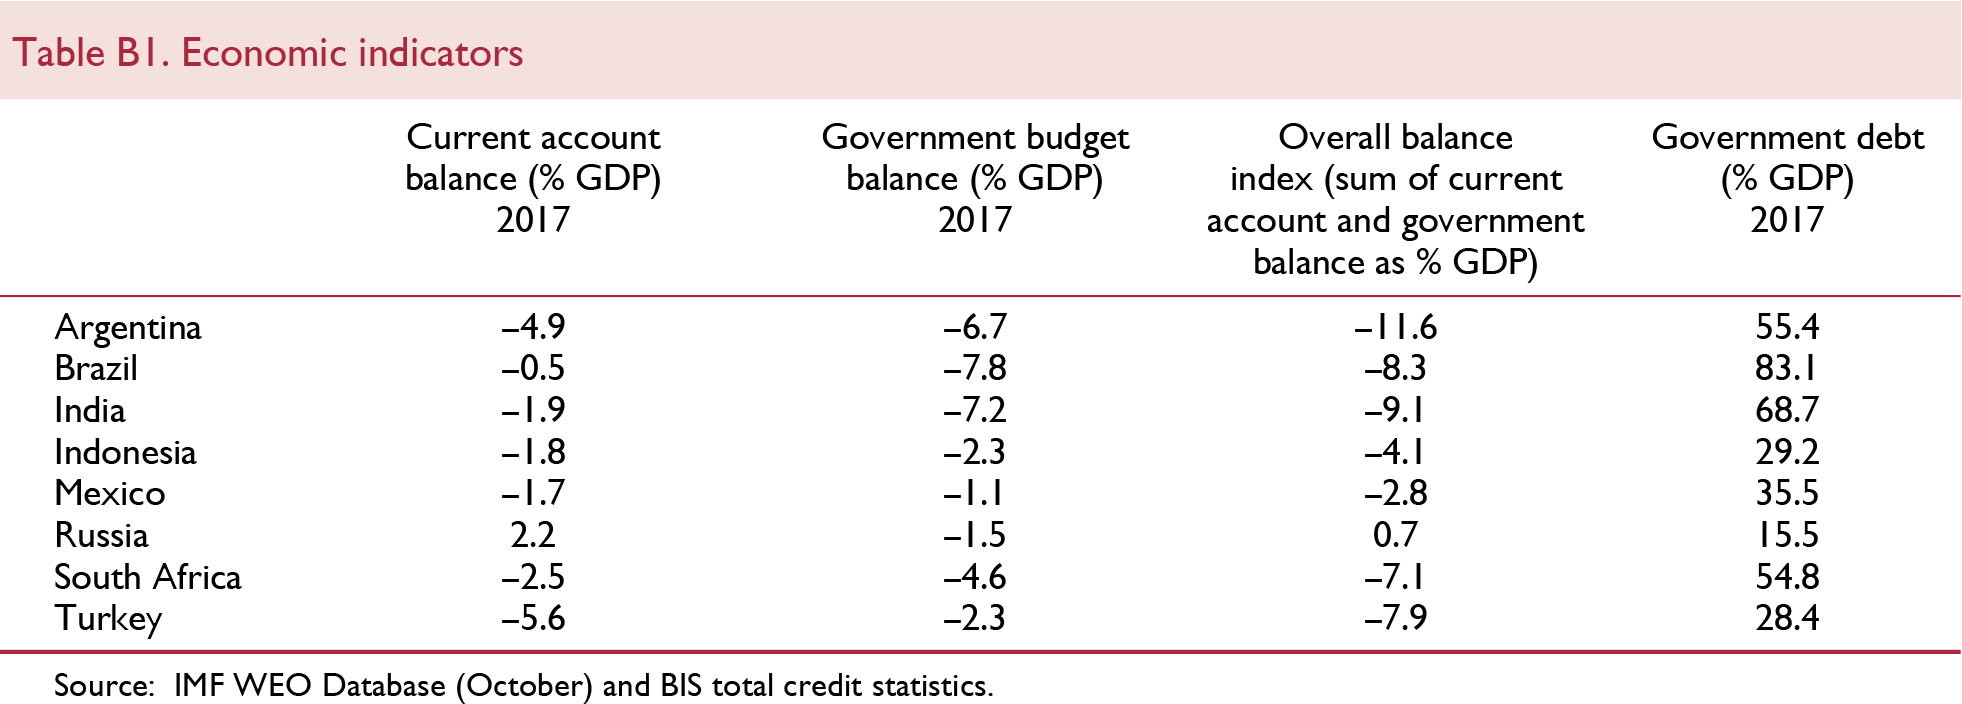
Recent reaction in economies such as Argentina and Turkey to continued monetary policy tightening in the US has brought back into focus indicators of economic health of economies. In terms of possible concerns about economies, in its External Sector Report 2018 the IMF provides a classification of countries’ performance relative to estimates of fundamental values based on current account imbalances. The behaviour of the current account is only one of a number of factors that economists have found to be important signifiers of a possible crisis and various models have been developed that range in their statistical sophistication with, for example, the IMF having recently outlined some early warning models for use in its Vulnerability Exercise (Reference Basu, Chamon and CroweBasu et al., 2017). A somewhat simpler approach was developed by Jan Qvigstad, former Deputy Governor at Norges Bank (Reference Berg, Qvigstad and VonenBerg, Qvigstad and Vonen, 2011; Reference Qvigstad, Llewellyn, Vonen and DharmasenaQvigstad and Llewellyn, 2012) which notes that values of the current account balance and the budget balances (as shares of GDP) greater than 4 may be a possible sign of “trouble lying ahead”. Government debt as a share of GDP is also examined as an indicator variable, using 60 per cent as a threshold level.
In order to examine the impact that US monetary policy tightening might have on selected developing economies, we simulate an unexpected increase in US policy interest rates using the National Institute's NiGEM model. We examine the results of an exogenous, 1 percentage point increase for five years relative to the baseline and focus on the size of spillover effects in three simulations.
In NiGEM, economies are linked through trade, competitiveness and financial markets. Hence, the effect on other economies of a monetary policy tightening in the US will be determined largely by the importance of trade with the US (see, for example, Reference ForbesForbes, 2001), changes in competitiveness, and to some extent by the reaction of domestic monetary policy and the impact on the wealth of the personal sector in those countries. Higher US interest rates and the associated appreciation of the dollar leads to the depreciation of currencies of US trade partners which support their exports, but at the same time domestic inflation increases. In most countries lower domestic demand is counterbalanced to some extent by the positive contribution from net trade (as exports increase and imports fall).
Table B1 provides a summary of key indicators of some emerging economies that are explicitly covered in the National Institute's NiGEM model (as these can be examined in a model simulation). The table shows, following Qvigstad, the size of current account and budget deficits and also the government debt position and helps to link concerns about possible vulnerability with the shock examined.
In the first simulation (‘US monetary policy tightening’), forward-looking expectations for wage bargainers, financial markets and targets in policy rules are assumed to hold and the impact on output outside the US is close to neutral, as illustrated in figure B1. An initial impact on respective GDPs would depend to a large extent on the sensitivity of domestic demand to export revenue. For some countries domestic demand is more sensitive to export revenue than others. Export volumes from each of the economies in table B1 would be expected to fall in response to the shock, as a reduction in external demand tends to offset gains in competitiveness. As relative import prices rise and demand weakens imports volumes fall as well, in some economies more than exports volumes, leading to net trade being a positive contributor to GDP.

Figure B1. Impact on GDP from US monetary policy tightening on selected emerging market economies (average over three years)
Recent events such as the taper tantrum have illustrated the importance of financial linkages and capital flows in the propagation of shocks across countries. To capture the negative impact from increased risk premia in economies as a reaction to an increase in the US interest rates, we add an investment premia shock (a temporary 1 percentage point exogenous shock to all economies, apart from the US) to the first simulation. This increase in investment premia affects both supply and demand sides of the economies by increasing the user cost of capital and lowering the equilibrium level of capital and investment. As shown in figure B1 under ‘US monetary tightening plus investment premia’, output falls (relative to baseline) in all the emerging market economies considered. The impacts are much larger than in the first simulation.
In the third simulation we demonstrate how changes in the assumptions about expectations applied in the simulation model affect the size of spillover effects. We rerun the previous simulation but assume backward looking expectations (i.e. long-term rates, labour and equity markets are backward looking and exchange rates are fixed) and, as shown in figure B1, the magnitude of the adverse spillover effects increases further. Here, without forward looking financial markets, exchange rates do not ‘jump’ on the policy ‘news’ and net trade positions worsen, exacerbating a negative impact on domestic demand.
The net result from these simulations is that an unanticipated US monetary tightening would have adverse effects on economic prospects in emerging economies but that the experience would not be uniform across countries. In the simulations, Turkey and Argentina experience relatively large effects, perhaps reinforcing the market concerns seen this year. With some vulnerabilities having emerged in the past six months and with an uncertain trading environment, this is an appropriate time to renew the monitoring of economic indicators that may foreshadow vulnerability to shocks.
This box was prepared by Iana Liadze and Barry NaisbittMonetary policy
Within the advanced economies, the Federal Reserve raised US policy rates three times in 2017 and has already repeated that degree of activity so far this year to reach the 2.0–2.25 per cent range, taking policy rates up by 2 percentage points since December 2015. In the same period, 10-year bond yields have risen by less than 1 percentage point. Based on the median expectation in the projections provided at the September Federal Reserve meeting, another increase this year is likely. Three further rises are implied by the Federal Reserve Board projections for next year as policy rates continue to be ‘normalised’. That said, the profile of policy rates is data dependent and not pre-set.
Monetary policy accommodation has also been reduced in the UK and Canada, with interest rates rising. In contrast, the ECB anticipates continuing to hold policy rates in negative territory until Summer 2019 but has scaled down the monthly size of asset purchases and anticipates the quantitative easing programme ending in December. Our monetary policy interest rate assumptions are for a gradual tightening in the advanced economies over the forecast horizon, reflecting a response to potential pressures from a narrowing of output gaps rather than a concern about burgeoning inflationary pressures. The US Federal Reserve's theme of ‘normalising’ policy may spread to other advanced economies over the next couple of years as the global expansion continues.
Given currency linkages, the pressure from US policy rate rises is likely to be transmitted to some emerging market economies (see Box B), perhaps with some concerns about non-financial companies’ debt and current account balances.5 With economies at different phases of the cycle, the pattern of potential policy and market rate movements remains diverse.
Financial and foreign exchange markets
Equity markets continued their multi-year rise in 2017 and this led to some market commentaries warning about a possible over-valuation of stocks. In February this year some of the warnings seemed to materialise when the S&P index fell by 10 per cent in two weeks, with that fall reflected in other markets. The downturn was short-lived, however, and markets rebounded. Announcements of US tariffs on steel and automobiles and then on trade with China on 22 March then led to further market jitters. Despite the news on tariffs continuing, markets firmed, with the S&P 500 up nearly 13 per cent at end September from its February low. Recent political views on the appropriateness of the Federal Reserve's monetary policy actions have led to another round of equity market falls, perhaps illustrating the potential vulnerability of the markets.
The Vix index, an indicator of financial market volatility or uncertainty (sometimes referred to as the ‘fear index’ for equity markets), spiked in February as equity markets fell.6 Then volatility gradually reduced, only to rise sharply again in early October as the equity market fell again.
After 10-year bond yields in the US briefly rose to over 3 per cent in May, touching their highest level since mid 2011, they eased back until mid-September when the 10-year yield broke through 3 per cent again, ending September at 3.05 per cent. Since then yields have hit 3.20 per cent, their highest since 2011, with a clear upward trend since the trough in mid-2016, coinciding with the rise in short-term policy rates.
In contrast, Euro Area 10-year bond yields have remained anchored at just over 1 per cent. Although quantitative easing is ending, the guidance that policy rates will be held unchanged at least through much of 2019 provides continued support for low longer-term rates to hold. But, within the Euro Area, Italian political events have led to higher yields (with an increase of around 1 percentage point between March and June) as risks have increased. In Turkey, where market concerns have been more acute recently, 10-year bond yields have risen to 19 per cent, but below the 24 per cent policy rate that was imposed recently. The slope of the yield curve, a much used lead indicator of recession, remains very low, with the New York Federal Reserve's model (based on the spread) implying a probability of just below 15 per cent of a recession in a year's time, the highest such probability since late 2008.7
Despite slowly rising short-term interest rates and relatively robust economic performance, the US dollar depreciated against the euro through 2017 by almost 20 per cent and hit a low point in early February this year. However, since late April the US dollar has appreciated by around 7 per cent against the euro. The trade-weighted exchange rate has also appreciated this year (by around 7 per cent), indicating that the stronger US dollar might be exerting pressure on those non-US borrowers who have dollar debt.
Commodity markets
Oil prices have continued their sustained increase seen since early 2016 with Brent oil rising briefly to $85 per barrel in early October, its highest since late 2014. The sustained rise has been supported by supply limitations, especially due to the Iranian ban and the turmoil in Venezuela, and is being seen in higher consumer prices for petrol and oil-related goods.
Prices of other commodities fell again in the third quarter after a fall of about 5 per cent in the second quarter following a 1 per cent rise in the first quarter (based on The Economist all-items commodity price index, in dollar terms). Food prices fell by 1 per cent in the third quarter after a fall of about 7 per cent in the second quarter and metals fell by 6 per cent in the third quarter after a rise in the second quarter of just under 1 per cent. Copper prices, sometimes seen by some as a bellwether indicator for global economic activity, have risen since mid-September following a fall in the previous quarter, possibly indicating some renewed momentum in the global growth picture.
Risks to the global forecast
While our near-term global growth projections are for continued steady growth, there are risks to that profile: most obviously due to the imposition of US tariffs and any retaliation risks and the possibility that the situation disintegrates into a ‘trade war’. In addition, the upside risk that threats of tariffs would not be realised has disappeared. Our estimates of the effects of US tariffs already imposed, using our NiGEM model (see Box A),8 indicate that the downside effects on global growth so far are small and consistent with a slight reduction in the pace of near-term growth. The possibility of further impositions and retaliations is a risk for the prospects for both world trade and global economic growth. The change in direction of US trade policy is a significant one and has added uncertainty to the trading environment. While, at present, the US actions directly affect a limited number of economies, the prospect of more countries being affected is a further risk. So uncertainties around the possibility of a worse outcome into the medium term remain in the downside to the risk profile. Against that, we have seen the agreement of a new NAFTA (the USMCA), which does not appear substantially negative, and the signing of a trade agreement between the EU and Japan. So not all the trade risks are on the downside.
On the positive side, the synchronised nature of relatively strong activity could well have further to run, with domestic demand growth in economies being boosted by investment spending growth responding to stronger global demand. If inflation remains subdued, this transmission mechanism could provide a boost to global growth. In addition, the stimulative fiscal measures in the US could add more momentum than expected, both in the US economy and through import demand channels, leading to a stronger US and global outlook in the near-term.9 This would especially be the case if US inflation remains below target, so that there is no additional pressure created by the stimulus to hasten the gradual reduction in monetary policy accommodation.
Monetary policy has remained accommodative across most economies since the Great Recession and, if low inflation persists, this could continue and so support a strong pace of growth. The gradual tightening of US monetary policy since 2015 has been accompanied by continued growth and a drop in the unemployment rate to 3.7 per cent in September, a near 50-year low. Despite some concerns about inflationary pressures rising, to date US inflation has been close to its target. But this could change quickly and the Federal Reserve could increase policy interest rates more rapidly and substantially than expected. At a time when equity markets appear to be richly valued relative to what might be regarded as fundamentals (see figure 7), such a change in policy stance could lead to falls in equity prices and household wealth, leading to weaker consumer spending growth and reduced import demand. Box B uses our NiGEM model to examine the broader international effects of a US monetary policy shock. It illustrates that an unanticipated US monetary tightening would have adverse effects on economic prospects in emerging economies. The estimated adverse effects are not uniform across countries, with the scale of effects depending upon both interconnectedness and how economic agents react to the changes.
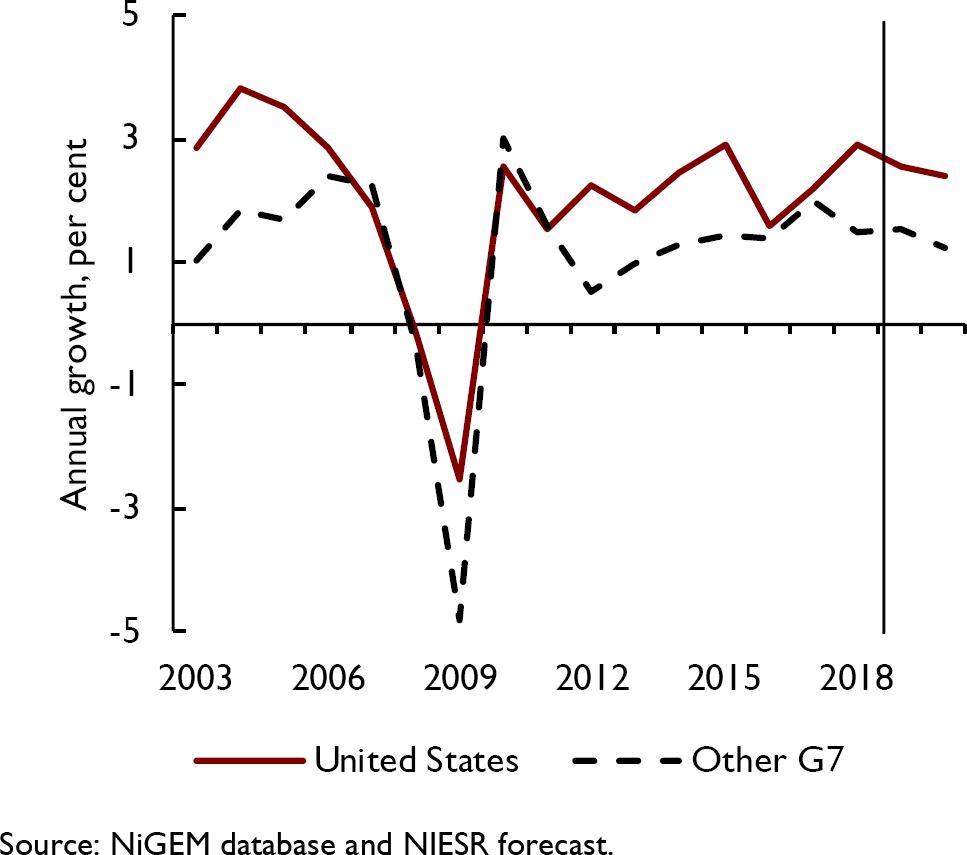
Figure 5. GDP growth in advanced economies
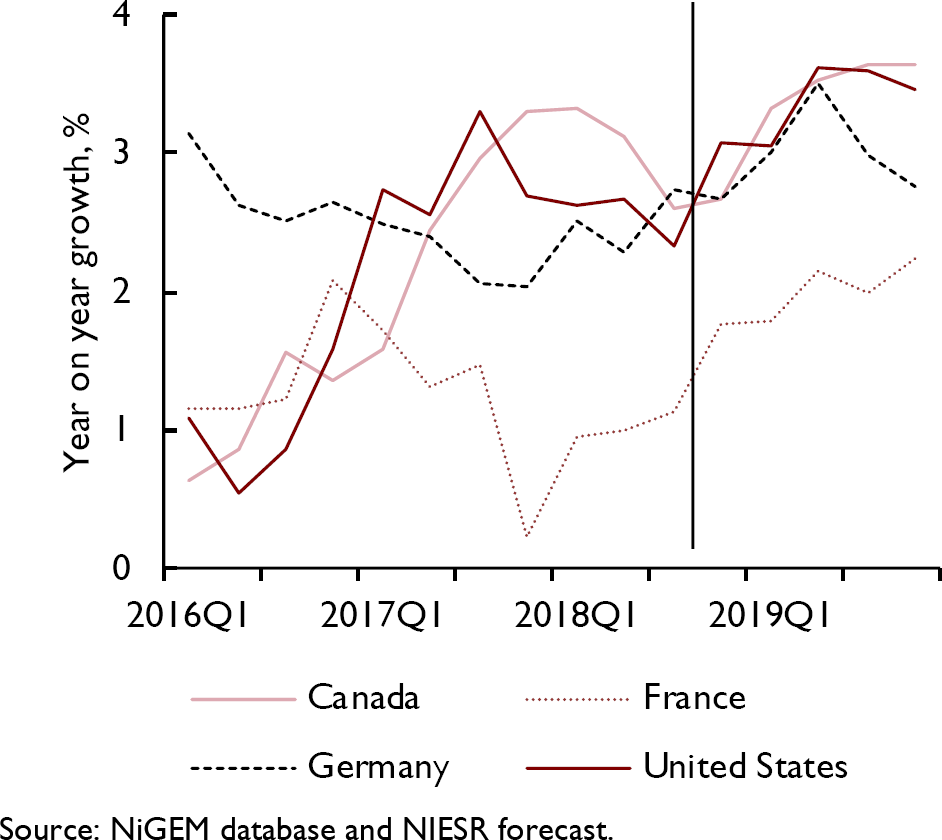
Figure 6. Average earnings growth
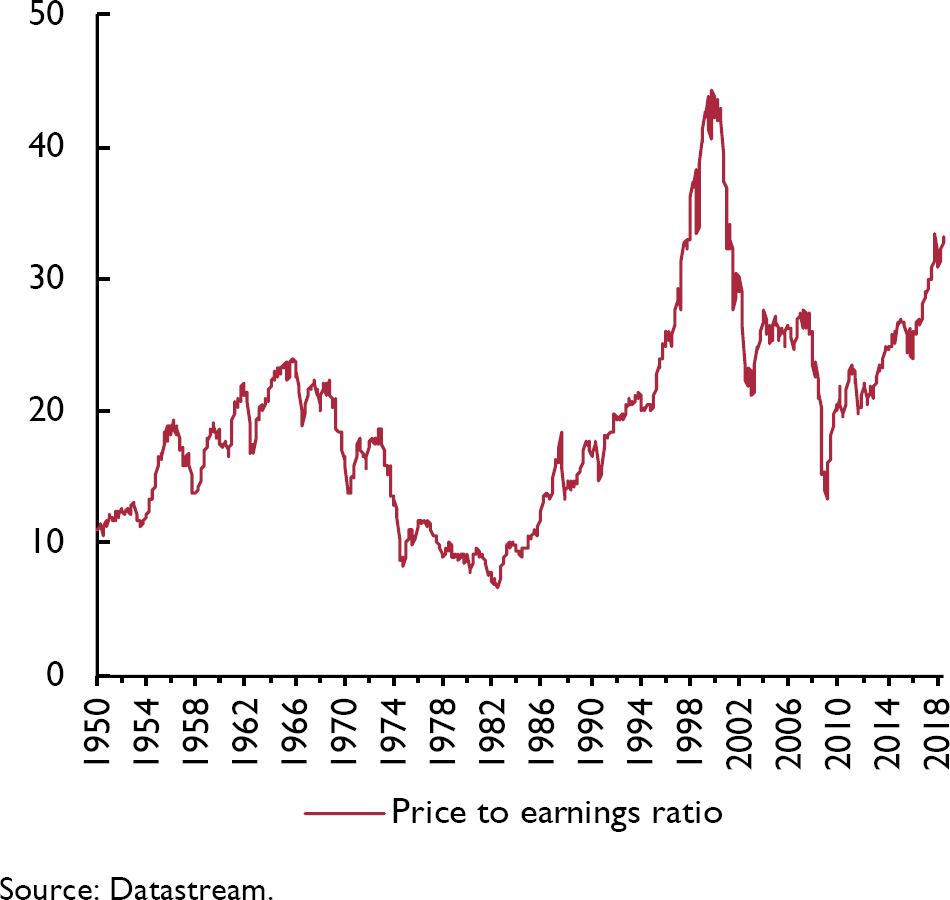
Figure 7. Shiller cyclically adjusted price-earnings ratio for the S&P 500
The potential downside risk to global economic prospects from the interaction of the build-up of debt – in both public and private sectors – and the gradual increases in interest rates was discussed in detail in the August 2018 issue of this Review. 10 As in the 2000s, higher debt can create a potential vulnerability and, after such a long period of ultra-low interest rates, perhaps a key issue is that borrowers and lenders may have grown too accustomed to low debt service costs such that gradual and limited increases in interest rates could have more substantial negative effects on spending and the prospects for continued economic growth than anticipated.11
In recent months economic problems in a few economies (including Argentina, South Africa and Turkey) have made the headlines. While there may be few substantial international spillover effects from these individual events, the more synchronised nature of the global expansion may lead to a shock that is unique to one economy being more readily transmitted to other economies than expected and so present a risk to maintaining sustained growth. The geographical diversity of the economies that have experienced difficulties recently limits such effects via trade links (as usually shown by ‘gravity’ models) but a prolonged period of steady growth and low interest rates may, in itself, create new vulnerabilities.


