


Introduction
Melting on the surface of the accumulation zone or the colder part of the percolation zone of an ice sheet often leads to refreezing of the meltwater near the surface and the formation of melt features. These melt features are part of the firn, and ultimately are preserved at depth in the glacial ice as each summer layer is buried through time. In appropriate regions of the polar ice sheets, melting events are rare enough in time that ice cores collected from these sites show variations in melt frequency with time. A number of previous studies have used melt layers in Arctic ice cores to infer Holocene summer climate for Greenland (Reference Herron, Herron and LangwayHerron and others, 1981; Reference Langway and ShojiLangway and Shoji, 1990; Reference Alley and AnandakrishnanAlley and Anandakrishnan, 1995; Reference Kameda, Narita, Shoji, Nishio, Fujii and WatanabeKameda and others, 1995; Reference Rowe, Anderson, Mote and KuivinenRowe and others, 1995), on Agassiz Ice Cap, Canada (Reference Fisher, Koerner and ReehFisher and others, 1995) and on Devon Ice Cap, Canada (Reference KoernerKoerner, 1977). These Arctic studies show the potential for using melt layers and amount of melt per cent (AMP) recorded in the firn and ice cores, as reliable indicators of climate variability and change.
Most studies of surface melting on glaciers and ice sheets, and of water flow through snow, are concerned with temperate, isothermal snow and ice. Pioneering work by Reference ColbeckColbeck (1972, Reference Colbeck1974b, Reference Colbeck1976) developed the initial theories to explain the vertical movement of water through snow, primarily modeled as Darcian flow, which works well for seasonal snowpacks and for the percolation zone of ice sheets, where snow temperatures, melt rates and water fluxes are high. Reviews by Reference Marsh and CorapciogluMarsh (1991, Reference Marsh1999) provide a useful overview of the many studies advancing the understanding of water flux through snow since then. In contrast, there have been few studies of melting and water flow in subfreezing snow with low water content. This is to be expected, as most studies of water flow through snow are driven by the need to understand snowmelt on the scale that affects ice-sheet and glacier mass balance, as well as snowmelt runoff processes. Meltwater flow through subfreezing snow has been thoroughly addressed by Pfeffer and others in a series of papers (Reference Pfeffer, Illangasekare and MeierPfeffer and others, 1990; Reference Pfeffer and HumphreyPfeffer and Humphrey, 1996) which have examined water movement and ice-layer formation in subfreezing snow in Greenland using numerical models, field observations and laboratory experiments. Guided by this earlier work, we have undertaken similar studies for the somewhat different conditions of the West Antarctic ice sheet.
This study specifically addresses melt-layer formation in West Antarctica to aid in interpreting the Holocene melt-layer record from the recently recovered deep ice core from Siple Dome, West Antarctica. (See Reference HamiltonHamilton (2002) and Reference TaylorTaylor and others (2004a, Reference Taylorb) for more background on the Siple Dome research area and deep ice core.) The scarcity of melt events, the same condition that makes melt layers useful as a paleotemperature signal in this region, makes them a challenge to observe and understand. Melting events occur at Siple Dome on the order of two to four times per century (Reference DasDas, 2003), and while melting may occur more often on the Ross Ice Shelf, it is still infrequent. Melting does occur seasonally in the warmer coastal regions of Antarctica, as well as the Antarctic Peninsula, where summer temperatures regularly rise above freezing, and observations of these melt events have been described in a number of studies including Reference Liston, Winther, Bruland, Elvehøy and SandListon and others (1999) and Reference Van den BroekeVan den Broeke and others (1999). In contrast, summer temperatures at Siple Dome are well below 08C (Reference Das, Alley, Reusch and ShumanDas and others, 2002). Using a 4 year automatic weather station (AWS) record from Siple Dome we calculated a mean summer temperature of –11.5°C with a standard deviation of 3.1 °C. As expected, during visits to our study sites in West Antarctica during the austral summers 1999/2000 and 2000/01, we did not observe any active melting conditions. This meant we could not investigate the ongoing effects of natural surface melting on snow conditions, melt-layer formation and firn stratigraphy in situ, as is often done in surface-melting studies in other locations (e.g. Reference Pfeffer and HumphreyPfeffer and Humphrey, 1996, 1998, and references therein).
We used two approaches to alleviate the lack of in situ observations of active melting and to study melt layers in this region;the results are presented in this paper. Firstly, during two field expeditions, we visited sites that were more likely than the summit of Siple Dome to have experienced surface melting in the last one to two decades. We dug 2 m snow pits in the firn, and also drilled holes to retrieve 5m firn cores at the AWS sites. In this way we were able to investigate the melt stratigraphy for recently occurring events. Secondly, we carried out a series of experiments at Siple Dome, creating artificial melting conditions to investigate the stratigraphic and climatic conditions necessary to form melt layers, and to observe changes in surface stratigraphy taking place during melt events.
Melt Observations
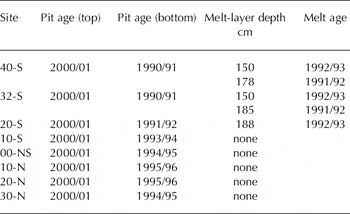
During two field seasons (1999/2000 and 2000/01) we visited 12 sites in West Antarctica (four sites on the Ross Ice Shelf and eight sites across Siple Dome; see Fig. 1) to look for naturally occurring melt features in the firn stratigraphy. In a 70 km transect across Siple Dome (from 30 km north of the summit at site 30-N to 40 km south at site 40-S) we dug 2m snow pits and examined stratigraphic features at eight sites, 10 km apart. The locations of these sites are listed in Table 1. Melt layers were found at the 40-S, 32-S and 20-S sites (Table 2). Melt layers were thin (generally a few millimeters thick), horizontal, laterally continuous, ice layers. They were occasionally found closely grouped in twos or threes, spaced 1–3 cm apart. At the two sites that contained the most melt features (32-S and 40-S) we also found a few ice lenses, or larger ice features (up to 30 cm long by 2.5 cm thick) below the ice layers. We were not able to fully investigate the spatial continuity of any of these melt layers, which were too deep for us to follow them horizontally given our limited time and resources. Melt layers were found to be continuous around the perimeter of a 1 m2 snow pit. In addition, when we revisited selected sites the following year and dug new snow pits, melt layers were found at the appropriate depth corresponding to the melt layers found the previous year. A previous stratigraphic study around Siple Dome also noted the presence of a few 2–5 mm thick melt layers found in shallow snow pits (Reference KreutzKreutz and others, 1999).
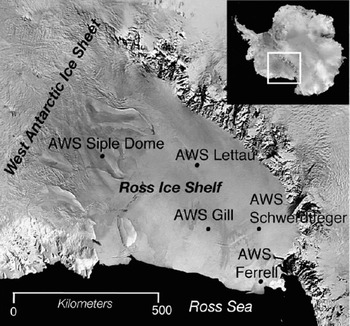
Fig. 1. Advanced Very High Resolution Radiometer (AVHRR) image showing the location in West Antarctica of Siple Dome and the AWS sites used in this study.
Table 1. The snow-pit site locations for the transect across Siple Dome. The site name identifies its distance (in kilometers) and direction (north or south) from the divide site
Table 2. Melt stratigraphy from 2 m snow pits dug at sites in a 70 km transect across the divide and part of the way down the flanks of Siple Dome. Melt layers from 1992/93 and 1991/92 melt events were found at sites 40-S, 32-S and 20-S. The depth of each melt-layer is also noted. All pits were dug during the 2000/01 summer field season. Melt layers were dated using a combination of physical stratigraphy and stable-isotope ratios
We also looked for melt features at four (AWS) sites across the Ross Ice Shelf (Lettau, Gill, Schwerdtfeger and Ferrell), where we collected 5 m firn cores in 1999. At the AWS sites, melt layers were found only at Schwerdtfeger and Gill. Schwerdtfeger had one melt layer, dating from 1991/92. This feature was found at 2.85 m depth and is 1 mm thick. Gill also has a melt layer from 1991/92 and another from 1982/83. The 1991/92 melt layer at Gill was at 2.17 m depth and is 1 mm thick. The 1982/83 melt layer at Gill was at 4.85 m depth and ranges in thickness from 2 to 3 mm.
Our third source of information about the morphology of melt layers is from analyses of the ice cores themselves. We analyzed the main Siple Dome ice core from the surface to bedrock. We also analyzed the shallow Siple Dome cores drilled on the flanks of Siple Dome. In general these shallow cores, at lower elevations than the deep core, showed higher frequencies of melt occurrence than did the main core, but the general melt features were similar in all cores. Melt layers were identified as thin, distinct, horizontal ice layers with few air bubbles.
One of the most notable characteristics of the melt features seen in both the ice core and the firn stratigraphy was the sharp boundaries between the melt layer and the surrounding bubbly glacier ice or firn. These field and core observations provide us with an understanding of the features of ‘naturally’ occurring melt layers. Next, we turn to field experiments to understand the formation of these layers.
Melt Experiments
While at Siple Dome in 1999/2000 and 2000/01 we carried out a series of experiments designed to create ‘artificial’ melt layers in the surface snow. We primarily used a hotbox (a 0.5 in (~12mm) thick clear plastic cube, measuring 0.5 m on each side, and open at the bottom), which we placed into the surface snow (Fig. 2). We also investigated using a Fresnel lens to focus the incoming solar radiation on the surface (also shown in Fig. 2) but this method worked ‘too well’ and very quickly sublimated a large hole in the surface snow. The purpose of the hotbox was to act as a greenhouse and thereby passively raise the air temperature inside the box above the ambient outside air temperature, ideally raising the surface temperature to the melting point. This allowed us to create artificial surface-melting conditions and we were thus able to observe active melting and related changes in snow stratigraphy, as well as the preservation of melt features. We placed a thermocouple with a data logger to record the air temperature at 1 min intervals. The thermocouple was too small to be properly shielded, so measurements may have been disturbed by direct solar radiation, but it was a very thin (1 mm diameter) white coated wire so we expect the disturbance was minimal. The external air temperature, at 1 m above the surface, was recorded at the same time at a weather station that we installed approximately 5m away from the experiment. The temperature sensor on the weather station was placed in a standard Campbell Scientific radiation shield. At the end of each experiment, the hotbox was removed, the region under the box was carefully excavated and the snow stratigraphy was observed. The box was then moved to a nearby, undisturbed location to begin the next experiment.

Fig. 2. Experimental set-up of artificial melt experiments showing the Fresnel lens and the hotbox placed in the snow.
Experimental Results
All five of the hotbox experiments achieved air temperatures at the snow surface above 0°C (Fig. 3) and four of the five experiments resulted in melting conditions (the stratigraphic diagram is shown in Fig. 4). A summary of conditions for each experiment is presented in Table 3. Melt layers were found to form in all of the experiments that experienced melting conditions, and the locations of melt layers are shown on the stratigraphic diagram (Fig. 4). The experimental melt features are thin, distinct ice layers, and formed in the location of pre-existing near-surface crusts. Apart from the crust regions, any surrounding snow that was wetted and refrozen did not show any type of melt feature similar to those observed in the firn-and ice-core stratigraphy. An example of one of the melt layers formed during the experiments is shown in Figure 5.

Fig. 3. Internal and external air temperatures during the five hotbox experiments at Siple Dome. External temperature was measured at 1 m above the surface. Each experiment experienced varying degrees of temperatures above 0°C and lasted for varying lengths of time (as indicated by the length of the solid bar above the curve).

Fig. 4. Summary diagram showing the stratigraphic results of the five hotbox melting experiments. Diagrams are ordered by the extent of melting, with the least melting at the top. The horizontal scale of the diagrams is the width of the hotbox (50 cm). The discontinuous melt layer that formed during experiment No. 3 followed a crust layer that dipped below the surface rather than extending horizontally at a constant depth. Melting and refreezing extended from the shallowest depth of the crust (0.2 cm below the surface) and ended where the crust reached 0.8cm below the surface, even though the crust itself continued at depth below that point. Also shown is the positive-degree-day (PDD) factor calculated for each experiment.

Fig. 5. Photograph of a surface melt layer formed during artificial melt Experiment No. 1 at Siple Dome.
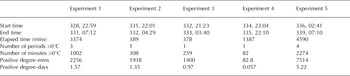
Table 3. Summary of hotbox surface-melting experimental conditions. Start and end times are Julian day, Greenwich Mean Time. PDD factors throughout the experiments show an experimental range from 0.057 to 5.22°C-day. Previous work (Reference DasDas, 2003) has shown that PDD factors at AWS sites across much of West Antarctica range from 0°C-day to a maximum observed value of 1.5°C-day. The maximum PDD factor observed at Siple Dome throughout the length of the AWS record (1997–2002) is from January 2002, and is 0.225°C-day
Discussion
Our results are similar in some ways to the results found for the Greenland percolation zone by Reference Pfeffer and HumphreyPfeffer and Humphrey (1998), with ice layers forming at stratigraphic boundaries in the upper snow layers. In our case though, the boundaries are near-surface crusts, which are thin distinct layers themselves, and they, in turn, become the melt layers. The crusts are significant in that they present stratigraphic boundaries to the water flow, and they are formed of very fine-grained (<0.5 mm diameter) clustered snow grains, whereas the grains in the surrounding snow are generally >1 mm in diameter and less tightly packed. The water is preferentially drawn into and held in these crust layers by stronger capillary forces;any additional energy is used to melt the crust snow grains. This layer then freezes in place as a distinct, icy, melt layer, while the latent heat from the freezing of this layer is quickly dissipated into the surrounding cold snow layers without creating further layered melt features outside the crust layer.
To test the theory that the meltwater preferentially flows into the crusts due to capillary forces, we carried out an experiment that illustrates this behavior nicely. We carefully extracted a piece of near-surface firn with a 1 mm thick horizontal crust running through the middle. We rotated the piece of firn 90° such that the crust was standing vertically and placed it in a shallow pan of dyed water for approximately 1 min. At the end of this time, the crust layer had entirely filled with the dyed water to the top of the sample due to capillary rise, while the surrounding snow experienced less than half the rise (Fig. 6). A more general and quantitative examination of the capillary effects on water flow in snow is given in Reference ColbeckColbeck (1974a).
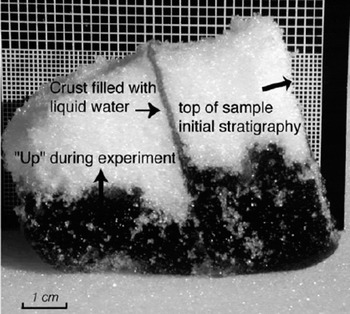
Fig. 6. Result of a dye experiment on a sample section of the surface snow demonstrating capillary force of the crust layers influencing meltwater movement. In the experiment a piece of near-surface firn with a 1 mm thick horizontal crust running through the middle was rotated 90° and placed in a shallow pan of dyed water. The dye quickly filled the entire extent of the now vertical crust layer to the top, and refroze as a dyed melt layer, which stands out in distiction from the snow layers on either side of the crust, which were filled less than halfway up during the experiment.
While information about changes in temperature and liquid-water content during the experiments would be extremely useful in adding to a more quantitative understanding of the melt processes observed here, we did not attempt to measure water content, as there are, to our knowledge, presently no instrumental techniques sensitive enough to measure changes in liquid-water content for extremely small amounts of water (<5%) with the high spatial resolution (~1 mm) necessary to capture the small-scale processes we see here. Neither did we measure the snow temperature gradient during our experiments, as we believe the intrusion into the near-surface snow layers to measure temperature changes would have significantly disrupted the initial stratigraphy and inadvertently changed the experiment, our thermocouples being close to the same thickness as a crust.
In order to compare the experimental results more precisely, we calculated temporally integrated positive air temperatures, otherwise known as positive-degree-day (PDD) values, for each experiment using the air-temperature record from inside the box. This allows us to compute a heating factor based on both the air temperature reached and the length of time over which the heating occurred. The physical basis of the PDD model as a melt-index method was examined by Reference ReehReeh (1991), Reference BraithwaiteBraithwaite (1995) and more recently by Reference OhmuraOhmura (2001). Since the length of each experiment varied considerably (378–4590 min) we have also normalized the PDD values to a single day (°C-day) to facilitate comparisons between experiments and values calculated for AWS sites on the Ross Ice Shelf. We calculate the PDD value as:

The measurements used to calculate the PDD factor for each experiment are shown in Table 3, and the final PDD values (in °C-day) are shown in Figure 4. The diagrams in Figure 4 are in order of ascending PDD values. The PDD method is useful here, not only because our experimental set-up limits us to the use of air temperature as both a measured and a controlling variable (since that is what is being changed in each experiment) but also because we can determine a melt threshold based entirely on air temperature, which we can then use to compare with conditions at AWS sites across West Antarctica. In doing so, we find close agreement between the PDD melt threshold found during these experiments (1 °C-day) and results from AWS stations that have experienced melting in the recent past as observed in the stratigraphy (Reference DasDas, 2003).
We can also use our experimental results to investigate the possibility that melting during one summer could produce sufficient meltwater (or raise snow temperatures sufficiently at depth) to affect the stratigraphy of previous years. This is obviously a concern when interpreting melt-layer stratigraphy in ice cores. Our experiments showed that a PDD of 1.57°C-day was not sufficient to form melt layers in the previous year’s firn layer, but that a PDD of 5.22°C-day (our next-highest value) did allow melt formation below the current year’s accumulation. Future work should fill in the gap between these experiments. Based on our experience, we expect that the PDD must be close to or above 5.2°C-day to allow melt-layer formation in the previous year’s firn. Because such heating is well outside likely conditions in the region, we expect that all or almost all observed melt layers occur in summertime firn from the same year in which melting occurred.
Ideally, a study such as this one would include a weather station with a suite of instruments capable of measuring the full surface energy balance (incoming and outgoing radiative fluxes, turbulent fluxes and near-surface snow temperature gradient) at a site that melts infrequently, but is nonetheless melting while the instruments are operating. But in the absence of such ‘ideal’ (and non-existent) meteorological observations, we maintain that the PDD method used in this study (and discussed further in Reference DasDas, 2003) is sufficient to explain the occurrence of melt events found across this region of West Antarctica, where melting is an infrequent phenomenon, where summer temperatures are well below 08C, and where temperature rises above 08C (when they do occur) are on the order of one or two days per summer.
Conclusions
This study enabled us to better characterize the melt features across West Antarctica and to understand the formation of melt layers in regions which experience infrequent melt conditions (on the order of a few times per century). Through experiments using a hotbox, we were able to create surface melting conditions. We were able to create melt layers similar in morphology to those found in the nearby firn and ice stratigraphy. The distinct form of these polar melt layers is due to a combination of factors including the small amount of liquid water formed during each melt event and the high ‘cold’ content of the initial surface snow layer. Most importantly, melt layers of the form occurring in this region were found to form entirely due to the preferential flow and subsequent refreezing of small amounts of meltwater from the surface into cold, near-surface, finegrained crust layers. We do not, however, believe crust availability is a limiting factor to melt-layer formation during a melt event. At no time or place at our 12 sites across the study region did we find insufficient surface or near-surface crusts to serve as potential melt layers;often two or more crusts were found in the top 5 cm of snow alone. Controls on crust formation and distribution of crusts are not well characterized, and it remains possible that lack of crusts could affect melt-layer formation in some places. However, our experience indicates that crusts are usually quite common (this study; Reference AlleyAlley, 1988). Finally, we determined the effect of various lengths of heating intensity required to create surface melt features at Siple Dome. By comparing results between experiments, we found (i) that continuous melt layers were formed when PDD values were above 1°C-day, a value which corresponds well with air-temperature records from AWS sites where melt layers have formed in the recent past, and (ii) that the potential for melt to reach the previous year’s accumulation exists at a PDD of 5.22°C-day. These results help validate the continued use of melt-layer records from polar ice cores such as the Greenland Ice Sheet Project 2 and Siple Dome cores as significant indicators of changes in summertime temperatures, and will assist in the calibration of changes in melt frequency into paleotemperature.
Acknowledgements
We thank D. Voigt, R.K. Campen, A.C. Kurtz, Antarctic Support Associates/Raytheon Polar Services Company, New York Air National Guard and Ken Borek Air for assistance in the field. We thank G. Hargreaves and J. Fitzpatrick for assistance at the US National Ice Core Laboratory. We thank B. Vaughn and J.W.C. White, University of Colorado Stable Isotope Laboratory, for the isotopic analyses of our firn samples used for dating the stratigraphy. We also thank S. Gerland and an anonymous reviewer for helpful comments. This research was supported by NASA grant NAG5-7776 and by US National Science Foundation grant OPP-9814485 to The Pennsylvania State University, and by a NASA Earth System Science Fellowship to S.B. Das.


