

Introduction
The ecology of the African buffalo (Syncerus caffer) has been the focus of extensive research studies over the past 50 years (Grimsdell, Reference Grimsdell1969; Sinclair, Reference Sinclair1977; Taylor, Reference Taylor1985; Prins, Reference Prins1996), including some more observational ones (e.g. Mloszewski, Reference Mloszewski1983). The species’ grouping patterns have historically been described as follows: mixed or breeding herds constitute the main social units, consisting of adult females, weaned and subadult individuals of both sexes (subadults are between 3 and 5 years of age) and a small proportion of adult males; bachelor groups gather males (two or more) 4 years of age and above; they gravitate around mixed herds, joining them mainly for mating and leaving them to escape intraspecies and gender competition and to improve their resource offtake efficiency until the next mating opportunity (Prins, Reference Prins1996; Turner et al., Reference Turner, Jolles and Owen-Smith2005). Bachelor groups tend to have a transient composition, with individuals associating for periods ranging between a few hours and several months. Bachelor groups can interact with several mixed herds ensuring gene flow at the inter-herd level (Van Hoof et al., Reference Van Hoof, Groen and Prins2003; Halley and Mari, Reference Halley and Mari2004; Turner et al., Reference Turner, Jolles and Owen-Smith2005). The mixed/breeding herd is classically defined by its home range, which has little interannual variation, and on which it interacts with bachelor groups, and a static and stable group size often affected by temporary and seasonal fusion–fission patterns (Prins, Reference Prins1989a; Cross et al., Reference Cross, Lloyd-Smith and Bowers2004; Tambling et al., Reference Tambling, Druce and Hayward2012). However, some aspects of this planet- and satellite-like framework have recently been challenged by observational studies.
In addition, the lack of a clear set of definitions regarding the entities composing buffalo assemblages prevent a clear and comparative approach. For example, two mixed herds can be described as either fusing or as one ‘herd’ being joined by another ‘group’ or ‘subgroup’, and the new entity is sometimes called a ‘large or mega herd’. The complexity associated with reliably and accurately identifying individual buffalo within large groups and regularly estimating the number of individuals associated with a focal animal (e.g. followed by telemetry) explains the difficulty with understanding group/individual dynamics within mixed herds. In this chapter, we will present a revised conceptual framework for buffalo social systems based on recent knowledge and interpretation. This conceptual framework will present the facts and hypotheses and highlight the gaps in knowledge to map the way forward in our understanding of African buffalo social dynamics.
Mixed Herds of African Buffalo
Mixed or breeding herd of African buffalo are the common terms used for a group of buffalo with a core social unit consisting of adult females. We will start by reviewing recent data from telemetry studies to shed light on what is known and unknown about these mixed herds.
A Mixed Herd is Composed of Adult Females Sharing a Home Range
In Gonarezhou National Park (GNP), Zimbabwe in 2008–2009, nine adult female Syncerus caffer caffer were equipped with GPS collars in four presumably different groups spotted from a helicopter (1, 2, 3 and 3 individuals in each group, respectively). Animals of these age and sex categories are expected to be most strongly bound to mixed herds (Sinclair, Reference Sinclair1977; Prins, Reference Prins1996; Fortin et al., Reference Fortin, Fortin and Beyer2009; but see Cross et al., Reference Cross, Lloyd-Smith and Bowers2004, Reference Cross, Lloyd-Smith, Johnson and Getz2005). The GPS acquired hourly locations over 405 days. The annual home range (HR) was computed (up to the 0.95 isopleth) for each collared individual using a movement-based kernel density estimation method (Benhamou and Cornélis, Reference Benhamou and Cornélis2010). HR overlap between individuals was estimated using Bhattacharyya’s affinity index (Benhamou et al., Reference Benhamou, Valeix and Chamaillé-Jammes2014). When displayed together (Figure 6.1), the HR of the nine females captured in four groups cluster easily in two HRs, which define the HRs of two mixed herds. Individual HRs strongly overlap within each mixed herd (74.4–80 per cent; and 59.3–68.6 per cent).

Figure 6.1 In yellow–reddish gradient, nine individual adult females African buffalo annual home range (HR) captured in Gonarezhou NP, Zimbabwe in 2008; central larger map, HR of the two mixed herds after superposition of individual HR.
Observations from GNP were included in a larger study based on 47 adult female buffalo from three national parks (NPs) in Zimbabwe and South Africa, which confirmed that adult female buffalo belonging to the same mixed herds shared at least 60 per cent of their HR. However, when observing adult female dyad dynamics (i.e. collared adult females two by two) within each mixed herd, the proportion of time spent together (simultaneous locations within 1000 m) in relation to HR overlap remained highly variable between dyads (Figure 6.2; Wielgus et al., Reference Wielgus, Cornélis and de Garine-Wichatitsky2020). In GNP and Kruger NP (KNP), females sharing between 60 per cent and 80 per cent of their HR spent, respectively, between 10–40 per cent and 10–70 per cent of their time together in each park. Cross et al. (Reference Cross, Lloyd-Smith and Bowers2004, Reference Cross, Lloyd-Smith, Johnson and Getz2005) found similar patterns of fusion–fission dynamics within mixed herds.

Figure 6.2 Relationship between the time spent in the same subgroup and HR overlap among pairs of Syncerus caffer caffer; n = 47 adult female buffalo from Gonarezhou, Kruger and Hwange NPs (Zimbabwe, South Africa); points represent the observed values for each dyad per year and per season. Solid lines represent the predictions from the model, and grey dashed lines represent 95 per cent confidence intervals. Horizontal blue dashed line indicates the cut-off value of 10 per cent of time spent in the same subgroup.
In the Okavango Delta (OD), Botswana, hourly GPS data were collected from 15 buffalo cows between 2007 and 2010. Based on HR overlap, two mixed herds were identified, one resident and the other migratory (Bennitt et al., Reference Bennitt, Bonyongo, Harris and Barrett2018). Analysis using the methods of Wielgus et al. (Reference Wielgus, Cornélis and de Garine-Wichatitsky2020) showed that buffalo dyads with approximately 30–90 per cent HR overlap spent between 3 per cent and 80 per cent of their time within 1000 m of each other. These data fit well with the definition of a mixed herd being composed of individuals sharing the same HR (Sinclair, Reference Sinclair1977).
Mixed Herds’ Home Range Overlap is Generally Small
The African buffalo is usually considered a non-territorial species, but studies investigating space sharing between neighbouring mixed herds have reported contrasting results. At Lake Manyara NP, Tanzania (Prins, Reference Prins1996), in Chobe NP, Botswana (Halley et al., Reference Halley, Vandewalle, Mari and Taolo2002), at Klaserie Private Nature Reserve, South Africa (Ryan et al., Reference Ryan, Knechtel and Getz2006) and in Niassa National Reserve, Mozambique (Prins, personal communication), herds tended to occupy distinct and exclusive HRs with little overlap. In contrast, in Rwenzori NP, Uganda (Grimsdell, Reference Grimsdell1969) and Sengwa Wildlife Research Area, Zimbabwe (Conybeare, Reference Conybeare1980), a large spatial overlap has been reported between HRs of neighbouring mixed herds (but these may have been offshoots of mixed herds). Seasonal changes in the use of space between neighbouring mixed herds and their temporal dynamics, however, are less understood.
Recently, the use of GPS technology on adult females has provided more accurate measures of the temporal dynamics between neighbouring herds. In a West African buffalo population living in W Regional Park, Niger, two neighbouring herds had very little direct contact within a 500-m spatial window, and for less than an hour despite the quite large overlap (21 per cent) of their HRs (Cornélis et al., Reference Cornélis, Benhamou and Janeau2011). In KNP and GNP, HR overlaps between individuals belonging to different mixed herds were very small, ranging from 3 per cent to 8 per cent (Figure 6.1). These results are in agreement with observations in Manyara NP, Tanzania (Prins, Reference Prins1996). A recent study based on long-term GPS-tracking of adult females in KNP and the OD has confirmed strong spatial segregation of HRs of neighbouring Cape buffalo herds, and short-term behavioural avoidance (Wielgus et al., Reference Wielgus, Caron and Bennitt2021). Cape buffalo formed relatively distinct herds occupying unique and separated HRs, with minimal overlap and very few direct contacts. Interestingly, and for the first time, this study highlighted that herds tended to avoid areas used by another herd in the previous two days during both the dry and wet seasons. Indirect contacts (i.e. use by two collared individuals of the same area at different times) between the neighbouring herds occurring within one month were more frequent than direct contacts.
Exchanges of Individuals between Mixed Herds Do Exist
Despite the temporal avoidance and the low spatial overlap between the HR of neighbouring mixed herds, dispersal events connecting mixed herds have been observed. From direct observations, Cross et al. (Reference Cross, Lloyd-Smith and Bowers2004) reported contacts and exchanges between neighbouring mixed herds within a two-year period. Caron et al. (Reference Caron, Cornélis and Foggin2016) reported three occurrences of dispersal by juvenile female buffalo out of 19 juvenile cows tagged or fitted with a GPS collar in KNP and GNP (Figure 6.3). These observations are corroborated by reports by game farmers and managers of juvenile females being spotted in small groups around wildlife farms or along veterinary fences in Zimbabwe (Caron, personal observation). Naidoo et al. (Reference Naidoo, Du Preez and Stuart-Hill2014) also reported long-range movement of female buffalo (age unknown) in Namibia and Botswana, some without apparent return to their former HR. In Ruaha NP in Tanzania and in Chobe NP and the OD in Botswana, herd switching was also observed (Halley et al., Reference Halley, Vandewalle, Mari and Taolo2002; Bennitt et al., Reference Bennitt, Bonyongo, Harris and Barrett2018; Roug et al., Reference Roug, Muse and Clifford2020). In southern KNP, the annual dispersal rates in two herds by adult females were 14 per cent and 19 per cent, respectively, and younger adult cows were more likely to disperse (Spaan et al., Reference Spaan, Epps, Ezenwa and Jolles2019). These results indicate that adult and juvenile females do change herds, with juvenile cows engaging in this behaviour more frequently. An outbreeding behaviour prior to first reproduction could explain this difference. However, the composition (other individuals of the same or different age or sex, if any) of the group accompanying the tracked females in these studies is unknown. In addition, it is not known in this study if these female dispersal events are also mirrored by male dispersal events.

Figure 6.3 Study area encompassing part of Mozambique, South Africa and Zimbabwe. The inset map shows the location of the Great Limpopo Transfrontier Conservation Area within southern Africa. Brown areas represent the home ranges of five satellite collar–equipped adult female African buffalo, representative of the five herds followed for the study in Kruger National Park (NP; n = 3) and Gonarezhou NP (n = 2). Because of overlap among the herds, boundaries for the five herds cannot be seen. Data for the other adult female buffalo in the study are not represented. The home range of Kruger NP herds spans the Limpopo River between South Africa and Zimbabwe. Long-distance movements of three subadult female buffalo are shown. Arrows indicate the direction of movements for two buffalo; sites of capture and resighting are shown for the third buffalo. A complete description of the movements of these three buffalo is provided in the expanded figure legend online (wwwnc.cdc.gov/EID/article/22/2/14-0864-F1.htm).
Social Dynamics within Mixed Herds Are More Fluid Than Expected
Based on the studies in GNP, KNP and Hwange NP (HNP), adult female dyads within a mixed herd were shown to be sometimes loosely associated, and that dyad association patterns varied between sites (Figure 6.3). For example, a majority of loose dyad associations were found in GNP and KNP (with 15–50 per cent of time spent together within a mixed herd) and the OD (most dyads with >30 per cent HR overlap spent <30 per cent of the time together) versus more lasting dyad association in HNP (with the majority of dyads spending 40–65 per cent of time together).
These results challenge previous works that proposed a more cohesive definition of mixed herds (Grimsdell, Reference Grimsdell1969; Sinclair, Reference Sinclair1977; Prins, Reference Prins1996). The fact that intraherd associations for adult cows seem to be looser than expected in Figure 6.2 indicates either that the social dynamics within the mixed herds studied in southern Africa differed from those of the mixed herds studied in eastern Africa, or that these previous studies, which did not use precise individual tracking, could not detect such dyad dynamics. Another interpretation could be that in more recent times, the disturbances created by humans at the periphery or in protected areas (most buffalo mixed herds followed in Figure 6.3 live on the periphery of protected areas) have impacted the social dynamics of mixed herds compared to earlier studies implemented in the heart of more intact protected areas.
Gaps in Knowledge and Hypotheses about Mixed Herds
If a mixed herd is not the cohesive social unit within which individuals spend most of their time together, it could hypothetically be the case within a smaller social unit, which we will define as a core group and within which individuals would spend most of their time together (Korte, Reference Korte2009; Table 6.1).
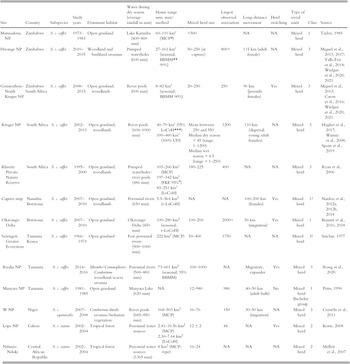
Table 6.1 Information about studied African buffalo populations across their range; classes are (1) habitat where water is not a limiting factor; (2) woodland/forest habitat; (3) habitat with water as a limiting factor during the dry season. Site gives area name and country. Habitat heterogeneity provides the proportion of grassland in the home range. Water provides the average annual rainfall and the availability of water during the dry season. HR = home range (minimum and maximum recorded) including acronym of the methodology used to measure the HR.
| Site | Country | Subspecies | Study years | Dominant habitat | Water during dry season (average rainfall in mm) | Home range min, max/method | Mixed herd size | Largest observed association | Long-distance movement | Herd switching | Type of social units | Class | Source |
|---|---|---|---|---|---|---|---|---|---|---|---|---|---|
| Matusadona NP | Zimbabwe | S. c. caffer | 1973–1983 | Open grassland | Lake Karimba (400–800 mm) | 60–110 km² (MCPFootnote *) | >500 | NA | NA | Mixed herd | 1 | Taylor, Reference Taylor1985 | |
| Hwange NP | Zimbabwe | S. c. caffer | 2010–2015 | Woodland and bushland savannas | Pumped waterholes (600 mm) | 27–161 km² (seasonal; BBMMFootnote ** 90%) | 50–250 (at capture) | 800+ | 115 km (adult female) | NA | Mixed herd | 3 | Miguel et al., Reference de Garine-Wichatitsky, Miguel and Mukamuri2013, Reference Miguel, Grosbois and Fritz2017; Valls-Fox et al., Reference Valls-Fox, Chamaillé-Jammes and de Garine-Wichatitsky2018; Wielgus et al., Reference Wielgus, Cornélis and de Garine-Wichatitsky2020, Reference Wielgus, Caron and Bennitt2021 |
| Gonarezhou–North Kruger NP | Zimbabwe South Africa | S. c. caffer | 2008–2015 | Open grassland, woodlands | River pools (600 mm) | 8–82 km² (seasonal; BBMM 90%) | 20–250 | 250 | 96 km (juvenile females) | Yes | Mixed herd | 3 | Miguel et al., Reference de Garine-Wichatitsky, Miguel and Mukamuri2013; Caron et al., Reference Caron, Cornélis and Foggin2016; Wielgus et al., Reference Wielgus, Cornélis and de Garine-Wichatitsky2020, Reference Wielgus, Caron and Bennitt2021 |
| Kruger NP | South Africa | S. c. caffer | 2002–2013 | Open grassland, woodlands | River pools (600–1000 mm) | 40–70 km² (95% LoCoHFootnote ***) 100–460 km² (100% UD) | Mean between 250 and 550 Median dry season = 45 (range: 1–1200) Median wet season = 4.5 (range = 1–250) | 1200 | 110 km (dispersal, young adult females) | NA | Mixed herd | 3 | Hughes et al., Reference Hughes, Fosgate and Budke2017; Winnie et al., Reference Winnie, Cross and Getz2008; Spaan et al., Reference Spaan, Epps, Ezenwa and Jolles2019 |
| Klaserie Private Nature Reserve | South Africa | S. c. caffer | 1995–2000 | Open grassland, woodlands | Pumped waterholes/river pools (486 mm) | 103–266 km² (MCP) 197–342 km² (FKE 95%Footnote #) 83–251 km² (LoCoH) | 180–225 | 400 | NA | NA | Mixed herd | 3 | Ryan et al., Reference Ryan, Knechtel and Getz2006 |
| Caprivi strip | Namibia Botswana | S. c. caffer | 2007–2010 | Open grassland, woodlands | Perennial rivers (650 mm) | 5.5–564 km2 (r-LoCoH) | NA | NA | 100–200 km (females) | Yes | Mixed herd | 1? | Naidoo et al., Reference Naidoo, Du Preez and Stuart-Hill2012a, Reference Naidoo, Du Preez and Stuart-Hill2012b, Reference Naidoo, Du Preez and Stuart-Hill2014 |
| Okavango Delta | Botswana | S. c. caffer | 2007–2010 | Open grassland | Okavango Delta (450 mm) | 100–280 km2 (seasonal; r-LoCoH) | 100–200 | 2000+ | 50 km (migration) | Yes | Mixed herd | 1 | Bennitt et al., Reference Bennitt, Bonyongo and Harris2016, Reference Bennitt, Bonyongo, Harris and Barrett2018 |
| Serengeti Greater Ecosystem | Tanzania Kenya | S. c. caffer | 1966–1973 | Open grassland | Few perennial rivers (500–1000 mm) | 222 km2 (MCP) | 50–400 | 1750 | NA | NA | Mixed herd | 3? | Sinclair, Reference Sinclair1977 |
| Ruaha NP | Tanzania | S. c. caffer | 2014–2016 | Miombo/Commiphora–Combretum woodland/acacia savanna | Perennial rivers (500–800 mm) | 73–601 km2 (seasonal, 95% BBMM) | 100–1000 | NA | Migratory, expander | Yes | Mixed herd | 3 | Roug et al., Reference Roug, Muse and Clifford2020 |
| Manyara NP | Tanzania | S. c. caffer | 1981–1985 | Open grassland | Manyara Lake (620 mm) | NA | 12–980 | 980 | 40–50 km (adult bulls) | No | Mixed herd Bachelor group | 1 | Prins, Reference Prins1996 |
| W NP | Niger | S. c. equinocalis | 2007–2008 | Combretum shrub savanna/Sudanian vegetation | River pools (685–850 mm) | 168–503 km2 (MCP) | 16–76 | 150 | 30–50 km (migration) | NA | Mixed herd | 3 | Cornélis et al., Reference Cornélis, Benhamou and Janeau2011 |
| Lope NP | Gabon | S. c. nanus | 2002–2004 | Tropical forest | Perennial water sources | 2.41–10.56 km2 (MCP) 2.30–7.64 km2 (LoCoH) | 12 ± 2 | 44 | NA | Yes | Mixed herd | 2 | Korte, Reference Korte2008 |
| Ndanza-Ndoki | Central African Republic | S. c. nanus | 2002–2004 | Tropical forest | Perennial water sources (1365 mm) | 8 km2 (MCP-type) | 16–24 | NA | NA | NA | Mixed herd | 2 | Melleti et al., 2007 |
* Minimum Convex Polygon;
** Brownian Bridge Models;
*** Local nearest-neighbour convex-hull construction;
# Fixed Kernel Estimator 95%;
## Kernel-based utilization distribution.
Adult females, calves and juveniles of both sexes and possibly adult males can potentially belong to this core group (Grueter et al., Reference Grueter, Qi, Li and Li2017). The existence of these core groups (or ‘basic herds’ or ‘subgroups’) has already been suggested (Sinclair, Reference Sinclair1977; Mloszewski, Reference Mloszewski1983). Several storylines could explain why individual buffalo would spend most of their time together. First, core herds could be based on kinship, containing mothers and several generations of their offspring, with young females staying with their mothers until the birth of their first calf and perhaps longer, and juvenile males leaving this association earlier (Sinclair, Reference Sinclair1977; Mloszewski, Reference Mloszewski1983; Prins, Reference Prins1996). Second, individuals having the same metabolic requirements could spend time together. However, this second storyline would imply that core groups are not stable over time as individual metabolic requirements can vary (e.g. with reproductive status). Third, some behaviours could benefit clusters of individuals that would spend more time together; such behaviours could concern anti-predation or anti-parasite, competition avoidance and information sharing on food resources, among others. These storylines are not mutually exclusive and various authors have described mixed herds as a composition of family groups, juvenile groups (male or female) and single males.
Field observations provide indications about the size of core groups based on the smallest units observed. In the savannas of GNP, Zimbabwe, groups of 20–40 buffalo were regularly seen during a study between 2007 and 2012 (Caron, personal observation). In tropical forests of Lope NP in Gabon, Korte (Reference Korte2008) observed a mean group size of 12 (range 3–24) Syncerus caffer nanus individuals per group. In the Guinean–Congolian Forest of Central African Republic, Melletti et al. (Reference Melletti, Penteriani, Mirabile and Boitani2007) studied over two years a herd of the same S. c. nanus subspecies comprising 16 individuals (one adult male, nine adult females, five juveniles and one calf) that only increased to 24 individuals through reproduction within the herd. Most buffalo groups observed in the OD contained 50–200 individuals (54 per cent of groups; Bennitt et al., Reference Bennitt, Bonyongo and Harris2016). The core group’s size (and composition) may vary between buffalo subspecies and geographical areas. Kinship could form the basis of mixed herds, with several core groups sharing the same HR but intermingling at times.
Against this kinship hypothesis is the observation that individuals collared in the same group (i.e. individuals that were together at the time of darting and fitting GPS collars) at the beginning of a study engage in highly heterogeneous fusion–fission dynamics (Prins, Reference Prins1989a). Wielgus et al. (Reference Wielgus, Cornélis and de Garine-Wichatitsky2020) analysed the associations of 4–6 individual buffalo collared in the same groups in GNP, HNP and KNP and found almost no stability in dyad observations. In addition, genetic characterization of individuals (both males and females) captured in the same herds in GNP and KNP revealed low levels of genetic relatedness, which were similar to relatedness values between individuals from different herds. This suggests that herds may contain many unrelated buffalo (Wielgus et al., personal communication). The combination of genetic and GPS data has also shown that the strength of female–female associations studied within three herds was not strongly influenced by their genetic relatedness. However, these observations should be considered cautiously, as few individuals from the same herd were both simultaneously monitored and genotyped (n = 3, 4 and 6 individuals in each herd). Sinclair (Reference Sinclair1977) observed mixed herd size variation around focal marked individuals through direct observation and aerial photographs. Herd size varied throughout the year and between HR areas, ranging from 90 to 428 individuals (Sinclair, Reference Sinclair1977). In the same study, two cases were reported of buffalo being darted and then joining a herd different from their original one. They were chased by the hosting herd and remained at the periphery of the herd (and one was quickly killed by a lion). In contrast, Grimsdell (Reference Grimsdell1969) found a relative stability of mixed herd size and composition in Queen Elizabeth NP, Uganda during a one-year study.
A better understanding of what constitutes a mixed herd therefore requires understanding of its inner dynamics and the existence or not of core groups. Currently available data indicate that buffalo herds experience very frequent fusion–fission dynamics, which seem to contradict the core group existence, with the exception of the very close association between mothers and calves. This fluidity also seems to exist at a higher order: numerous observations of groups of 1000–2000 individual buffalo suggest that distinct mixed herds could undergo fusion (Sinclair, Reference Sinclair1977; Chardonnet, personal communication; Table 6.1). While there are few continuous observation data available on these mega herds, it seems that their existence is temporary and responds to environmental drivers (Table 6.1). Given the little overlap observed between adjacent herds (less than 8 per cent of the HR), the gathering of several mixed herds raises the question of the HR of these temporary mega herds. It could span over more than one mixed herd’s HR or concentrate at very specific times on highly concentrated resources (see subsequent sections).
Knowledge of bachelor groups, the specific male-based social unit, has not significantly improved in recent years, mainly due to the reduced longevity of telemetry devices fitted on male buffalo (i.e. collars usually fail within a few weeks after deployment, probably due to the specific aggressive behaviour and strength of adult males; Taolo, Reference Taolo2003). Bachelor group size ranges from a couple of individuals up to 51, with 20 already being an unusual observation (Sinclair, Reference Sinclair1977; Prins, Reference Prins1989a; Hughes et al., Reference Hughes, Fosgate and Budke2017). Larger bachelor groups might form as a response to high levels of predation pressure from lions that prefer buffalo prey. They represent social associations based partially on similar metabolic requirements, that is to build on strength to face better odds of reproduction when joining mixed herds (i.e. re-entrant consecutive polygyny; Prins, Reference Prins1989b). Sinclair indicated that in the Serengeti they could represent 5.7 per cent and 15 per cent of the adult male and total populations, respectively (Sinclair, Reference Sinclair1977), proportions that increased during the dry season.
On the Difficulty of Understanding Social Dynamics in Buffalo
The ability of the African buffalo to cope with contrasting environmental conditions throughout most sub-Saharan ecosystems by modulating a large array of biological traits (weight, herd and HR sizes, etc.) highlights a high degree of behavioural plasticity. This plasticity, which allows the buffalo to enjoy a very wide distribution range in Africa (>200 mm rainfall), is a factor that challenges the understanding of the social dynamics of this species (Prins, Reference Prins1996). In this context, one main challenge is the ability to sample social movements and interactions at different scales and over time, between and within ecosystems, between and within adjacent social units, and finally within cohesive social units.
More recent research presented here has benefited from the use of GPS collaring technology, which provides almost continuous, accurate information on the location of each collared animal. However, it does not provide information about the group size or individual composition around the focal individual equipped with a GPS collar. Therefore, a dyad identified by telemetry does not indicate whether focal individuals associate in dyads within a defined social group (e.g. a core group). A limit to this technology is that the impact on the behaviour of individuals chased and darted from a helicopter to deploy collars has not been extensively measured and could trigger short-and longer-term behavioural responses that could blur the social dynamics studied (e.g. effect on mortality; Oosthuizen et al., Reference Oosthuizen, Cross and Bowers2009).
In addition, there is a large number of indices to quantify the overlap between HRs (e.g. Fieberg and Kochanny, Reference Fieberg and Kochanny2005), which can also be delimited in many ways, for example using minimum convex polygon (MCP) and utilization distribution (UD) methods. Recently, alternative methods that more explicitly consider the temporal component of movement data have been proposed, including the Brownian bridges methods (Benhamou and Cornélis, Reference Benhamou and Cornélis2010). The variability of methods can restrain understanding of social dynamics at the species level because comparisons between studies using distinct methods or applications are limited. For example, we used data from the telemetry studies described above (Bennitt et al., Reference Bennitt, Bonyongo, Harris and Barrett2018; Wielgus et al., Reference Wielgus, Cornélis and de Garine-Wichatitsky2020) to compare four empirical HR estimation methods: MCP, a fixed kernel utilization density method (KUD with least squares cross-validation, LSCV), a local convex-hull construction method (r-LoCoH) and Brownian random bridge model method (BRBMM) for 99, 90 and 50 per cent isopleths. These methods demonstrated the potentially different size estimates of the HR that we can obtain using the same data sets. In general, annual HRs obtained using BRBMM and KUD were substantially smaller than those estimated from MCP (e.g. 3.2 and 2.5 times greater than BRBMM and KUD, respectively, for the 90 per cent isopleth) and LoCoH (e.g. 2.2 and 1.7 times greater than BRBMM and KUD, respectively, for the 90 per cent isopleth), irrespective of the isopleth used to define the bounds. For these same data, the degree of overlap between seasonal HRs calculated with Bhattacharyya’s affinity index was greater than when calculated with the Utilization Distribution Overlap Index (UDOI). A similar comparison was conducted by Ryan et al. (Reference Ryan, Knechtel and Getz2006), with the MCP method giving a larger range size than the LoCoH method. In the future, standardizing variables should be used to facilitate comparisons between populations and improve our understanding of buffalo herd definition.
Additionally, GPS collars can provide key information about proximity between buffalo dyads, which can be interpreted in the context of social associations, enabling the identification of fusion–fission events (Bennitt et al., Reference Bennitt, Bonyongo, Harris and Barrett2018; Wielgus et al., Reference Wielgus, Cornélis and de Garine-Wichatitsky2020). However, these studies rely on an external definition of a proximity and temporal threshold determining whether buffalo dyads are ‘together’ or ‘apart’, and variation in this threshold can alter interpretation. Definitions of fusion–fission events should therefore be informed by buffalo detection capabilities rather than those of observers, which could lead to new interpretations of buffalo social systems. Knowledge is still missing to determine at what distance buffalo still perceive themselves as being together or not (e.g. what is the threshold beyond which an individual will react to a flight behaviour by the mixed herd?).
Determining the evolution of group size around a focal individual is also a crucial parameter to explore fusion–fission dynamics. Regular direct observation can in principle estimate this parameter if the focal individual is easily identifiable (e.g. with a color tag or collar; Grimsdell, Reference Grimsdell1969; Prins, Reference Prins1996). However, recent studies tend to focus on telemetry technology to remotely follow buffalo movements. This technology falls short of identifying group size and individuals moving or not in association with the collared individuals. Therefore, group size estimations around focal individuals will require direct observation studies or approaches combining telemetry and unmanned aerial vehicles, for example capturing regularly the group size around the collared individuals after locating it. The advent of proximity sensors should be a powerful tool for understanding social dynamics in African buffalo. These sensors record when two collared animals are close to each other according to the specified spatial threshold, and their lower cost compared to GPS technology makes it possible to monitor simultaneously a larger number of individuals, which is especially relevant for this species (Prange et al., Reference Prange, Jordan, Hunter and Gehrt2006; Hamede et al., Reference Hamede, Bashford, McCallum and Jones2009; Walrath et al., Reference Walrath, Van Deelen and VerCauteren2011). Additionally, when synchronized with GPS data (collected on some animals), the use of proximity sensors can help better identify the location of fusion and fission events, and therefore, the external drivers of fusion–fission dynamics.
Fluidity in Group Dynamics and Its Drivers – Conceptual Framework
Given the female-based social units described in the previous sections, and using the highly dynamic fusion–fission patterns of adult females observed with telemetry, Figure 6.4 presents a revised framework including the level of fluidity in social dynamics. In recent studies, the number of fusion–fission events between dyads of cows (dyads were considered together if at 1 km or less at the same time log) belonging to the same herd ranged on average between 4.04 and 5.73 per month during the dry season and 8.22 and 10.30 per month during the wet season in GNP, HNP and KNP (Wielgus et al., Reference Wielgus, Cornélis and de Garine-Wichatitsky2020); and in the OD, the mean number of fusion events per dyad ranged between 2.7 and 5.5 during the different seasons of 2008 and 2009 (dyads were considered together if at 300 m or less at the same time log; Bennitt et al., Reference Bennitt, Bonyongo, Harris and Barrett2018). These data would indicate fusion–fission dynamics corresponding to the right-end panel of Figure 6.4.

Figure 6.4 Framework of social units and dynamics of African buffalo. The three female-based social units (i.e. core, mixed and mega herds) are presented in a fluid diagram. We hypothesize that there is a fluidity between these social units in the same buffalo grouping, depending on drivers discussed in this chapter.
These dynamics both respond to a set of external factors, reviewed in the next section, and result from individual decision making (Cross et al., Reference Cross, Lloyd-Smith, Johnson and Getz2005). A dominance of fusion events will cause the formation of larger groups, whereas frequent fission events will lead to smaller groups. Prins (Reference Prins1996) observed in Manyara NP, Tanzania, that larger herds tended to split more often than smaller herds. Individual decisions may be triggered by resource competition within mixed herds, predation risk (e.g. the larger the group in open habitat, the lesser the predation risk per individual), kinship bonding (e.g. related to the core group concept), activity synchronizing and access to collective knowledge to deal with habitat heterogeneity and access to vital resources. Investigating the position of individuals within the herd, Prins (Reference Prins1996) hypothesized about the use of fission by rear individuals to ‘overcome social inequality’ of not accessing good resources compared to animals at the front. Apart from this, knowledge of how buffalo decide whether to stay in an association or not remains scarce.
External Drivers of Fusion–Fission Dynamics
Resource Distribution and Habitat Heterogeneity
Resource availability is closely related to variation in social organization in social ungulates (Jedrzejewski et al., Reference Jedrzejewski, Spaedtke and Kamler2006; Isvaran, Reference Isvaran2007; Fortin et al., Reference Fortin, Fortin and Beyer2009). When forage and water are relatively scarce and/or distributed in small, distant patches, animals are expected to form smaller groups and aggregate in areas or during times where or when resources are abundant. Interestingly, studies investigating temporal variation in group size in African buffalo described seasonal changes in group size that hint at the role of resource condition as a driver of fusion–fission dynamics (e.g. Sinclair, Reference Sinclair1977; Melletti et al., Reference Melletti, Penteriani, Mirabile and Boitani2007; Hughes et al., Reference Hughes, Fosgate and Budke2017). However, they reported contrasting results depending on the geographical areas and the subspecies. For instance, while S. c. caffer groups from Klaserie Private Nature Reserve (South Africa; Ryan et al., Reference Ryan, Knechtel and Getz2006) and Serengeti NP (Serengeti; Sinclair, Reference Sinclair1977) occurred in larger herds during the wet season, the opposite was reported in S. c. caffer groups from Chobe NP (Botswana; Halley et al., Reference Halley, Vandewalle, Mari and Taolo2002) as well as in S. c. nanus herds living in Dzanga–Ndoki NP (Central African Republic; Melletti et al., Reference Melletti, Penteriani, Mirabile and Boitani2007). Conversely, Korte (Reference Korte2008) reported that S. c. nanus herds were relatively stable between seasons at Lopé NP (Gabon). Irrespective of the group size, the monitoring of adult females in KNP, GNP and HNP revealed seasonal differences in the underlying patterns of fusion–fission events within herds, with higher fusion–fission dynamics during the wet season, while fusion–fission dynamics in the OD did not vary seasonally (Bennitt et al., Reference Bennitt, Bonyongo, Harris and Barrett2018; Wielgus et al., Reference Wielgus, Cornélis and de Garine-Wichatitsky2020). This suggests that environmental heterogeneity affects buffalo group dynamics, but in different ways depending on the geographical areas.
In social ungulates, larger and tighter groups are more common in open habitats where visibility is higher than in closed habitats. Large group sizes facilitate social cohesion, improve protection against predators and parasites (e.g. ticks, flies) and possibly provide access to more abundant forage for grazing (Jarman, Reference Jarman1974; Isvaran, Reference Isvaran2007; Pays et al., Reference Pays, Benhamou, Helder and Gerard2007; Sueur et al., Reference Sueur, King and Conradt2011). A tendency for buffalo to occur in larger groups in open habitats, such as grassland, as well as in more homogeneous areas has been noticed in Hluhluwe–iMfolozi Game Reserve during both dry and wet seasons (Dora, Reference Dora2004). Therefore, one hypothesis is that as the habitat opens and turns into more (larger patches of) grasslands, fusion–fission dynamics will tend to create larger herds, up to mega herds, compared to woodland habitats hosting smaller mixed herds (Figure 6.4). This hypothesis is also supported by field observations in Matusadona NP, Zimbabwe (Taylor, Reference Taylor1985), Serengeti NP, Tanzania (Sinclair, Reference Sinclair1977) and forest buffalo in Gabon (Korte, Reference Korte2008). Mloszewski (Reference Mloszewski1983) proposed three types of herds depending on the habitat: open grassland habitat that allows the largest herds with water available throughout (e.g. OD or Matusadona NP); well-watered woodland habitat hosting smaller herds (e.g. forest buffalo in tropical forests); and drier habitats where the need to regularly commute between water and pasture encourages smaller herds and the greatest degree of herd discipline (e.g. GNP, HNP or KNP; Table 6.1). GPS monitoring of adult females revealed that habitat openness had a minor effect on the patterns of associations among individuals and the location of fusion–fission events. Similarly, in the same study, although the scarcity of water during the dry season in such habitats might be expected to affect the social dynamics of buffalo, a significant, but weak, effect of distance to water on the patterns of associations and the location of fusion–fission events between adult females was observed (Wielgus et al., Reference Wielgus, Cornélis and de Garine-Wichatitsky2020).
Bachelor groups often concentrate around small patches of good-quality grazing, too small for larger herds to exploit (Taylor, Reference Taylor1985; Prins, Reference Prins1996).
Predation and Parasitism
The ‘ecology of fear’ has detailed the behavioural and ecological trait changes of numerous prey species and their consequences in response to predators in temperate and tropical ecosystems (Buck et al., Reference Buck, Weinstein and Young2018). For instance, Tambling et al. (Reference Tambling, Druce and Hayward2012) documented the changes in the behaviour of S. c. caffer following the reintroduction of lions (Panthera leo) into the Addo Elephant National Park, South Africa. Buffalo responded by increasing group sizes and switching habitat preferences towards more open grasslands during lions’ hunting hours, which countered the initial high levels of predation on juvenile buffalo experienced just after the reintroduction of the predator.
Although parasites (broadly including micro- and macroparasites) can also cause hosts to adopt defensive strategies that reduce infection risks, the ‘ecology of disgust’ has not yet provided strong empirical and theoretical evidence of the causes and consequences of such anti-parasite behaviours (Buck et al., Reference Buck, Weinstein and Young2018). The ‘encounter-dilution’ effect provides protection when the probability of detection of a group does not increase in proportion to an increase in group size provided that the parasites (or predator) do not offset the encounter effect by attacking more members of the group (Mooring and Hart, Reference Mooring and Hart1992). This mechanism could provide larger groups of buffalo with some added protection against parasites that actively seek their hosts, such as biting flies (e.g. tabanids, Glossina spp). The ‘selfish herd’ effect provides protection from predators to animals that are in the centre of a group (Hamilton, Reference Hamilton1971), which also protects against biting parasites (Mooring and Hart, Reference Mooring and Hart1992). Ungulate hosts have evolved adaptive strategies to minimize their exposure to parasites (Gunn and Irvine, Reference Gunn and Irvine2003; Fritzsche and Allan, Reference Fritzsche and Allan2012), and the adoption of such grouping and foraging strategies could provide some protection to buffalo herds against free-living stages of significant ectoparasites, such as ticks in southern African savanna ecosystems (de Garine-Wichatitsky et al., Reference de Garine-Wichatitsky, De Meeus, Guegan and Renaud1999; de Garine-Wichatitsky, Reference de Garine-Wichatitsky2000).
In conclusion, analysing the causes and consequences of predation and parasitism on African buffalo grouping strategies is not trivial. Despite relatively abundant literature documenting the effects of parasites on buffalo populations, including detailed surveys of the complex interactions between parasites (Jolles et al., Reference Jolles, Ezenwa and Etienne2008; Ezenwa et al., Reference Ezenwa, Jolles, Beechler, Wilson, Fenton and Tompkins2019; Chapter 11), there is a need for further empirical data specifically documenting group size variations of buffalo herds and their epidemiological consequences. Furthermore, it is likely that some consequences of buffalo herding strategies may differ fundamentally between predation and parasitism, with contrasted consequences depending on the mode of transmission of parasites (density- versus frequency-dependent transmission; Heesterbeek and Roberts, Reference Heesterbeek and Roberts1995).
Anthropological Drivers
Although few buffalo populations remain unaffected by human activities, little is known about the impact of human activities and infrastructures on fusion–fission dynamics in African buffalo. Naidoo et al. (Reference Naidoo, Du Preez and Stuart-Hill2012a, Reference Naidoo, Du Preez and Stuart-Hill2012b) explored the influence of infrastructure such as (wildlife management or veterinary) fences, roads, fires, cultivated areas and homesteads on the dispersal and home range of African buffalo in the Caprivi strip in Bostwana/Namibia, and noted that they all influenced buffalo movements and HRs as no through zones (e.g. fence, roads) or no-go zones (e.g. villages or recently burnt areas). In Zimbabwe, in HNP, KNP and GNP studies, African buffalo were seldom seen outside of protected areas (Miguel et al., Reference Miguel, Grosbois and Fritz2017; Valls-Fox et al., Reference Valls-Fox, Chamaillé-Jammes and de Garine-Wichatitsky2018). In Figure 6.1, the right-hand side boundary for both herds is a railway line doubled with a dirt road crossing through the GNP; no adult female buffalo ever crossed that line even after coming very close to it (Caron, personal observation). Buffalo regularly cross over the poorly maintained veterinary fence around the OD, most likely seeking productive forage, and several individual male buffalo were seen in Maun in 2021. In Kasane town, Botswana, buffalo just ignore the tarmac main road (Chardonnet, personal communication).
Besides the impact of humans on buffalo movements and HRs, little is known about the impact of cattle encounters on fusion–fission dynamics in buffalo mixed herds. Over most of their current distribution in sub-Saharan Africa, the ranges of buffalo and cattle populations extensively overlap, and they often share forage and grazing resources (Chapter 10). However, at a fine scale, there are few field observations of free-ranging buffalo mingling with cattle on the same grazing grounds, drinking together from the same waterholes, or any other activity implying close direct contact between individuals from the two species. On the contrary, most field evidence indicates that buffalo tend to avoid areas occupied by cattle herds. For instance, a spoor survey conducted to monitor the movements of wildlife and livestock across the damaged FMD fence of southern GNP found that cattle and buffalo used different sections of the damaged fence (Chigwenhese et al., Reference Chigwenhese, Murwira and Zengeya2016), while Hibert et al. (Reference Hibert, Calenge and Fritz2010) demonstrated a similar trend, with a clear separation of buffalo from cattle tended even at large scales in the WNP in West Africa. At a finer scale, Valls-Fox et al. (Reference Valls-Fox, Chamaillé-Jammes and de Garine-Wichatitsky2018) were able to further quantify the movement patterns of sympatric free-roaming buffalo and herded cattle using GPS empirical data combined with spatial modelling, according to seasonal changes of surface water availability in an interface area of HNP. As expected, both cattle and buffalo preferred open grassland habitats found close to water, but buffalo avoidance of cattle varied seasonally. During the rainy season, buffalo avoided cattle completely at the HR scale, whereas during the dry season, when cattle ranged further into the protected area in search of forage, buffalo and cattle spatial overlap increased as water dependence took precedence over avoidance (Valls-Fox et al., Reference Valls-Fox, Chamaillé-Jammes and de Garine-Wichatitsky2018). The same study observed a more nocturnal use by buffalo of shared pastures between both species, at a time when cattle are penned in ‘kraals’ close to their owner’s homestead. Although it is still unclear whether buffalo avoid cattle, or possibly their herders, dogs or other associates, and what cues they use to detect and minimize contacts, this could open perspectives for the management of wildlife–livestock interfaces (Sitters et al., Reference Sitters, Heitkönig, Holmgren and Ojwang’2009; Caron et al., Reference Caron, Angel Barasona, Miguel, Vicente, Vercauteren and Gortázar2021). Valls-Fox et al. (Reference Valls-Fox, Chamaillé-Jammes and de Garine-Wichatitsky2018) suggested that long-term planning of both artificial water provisioning and traditional cattle-herding practices could help maintain spatial segregation and thus mitigate conservation conflicts such as pathogen transmission, crop-raiding and livestock depredation. Finally, if, when encounters occur, they result in fusion–fission events as observed when one encounters buffalo groups, one would expect that the size of buffalo groups closer to park boundaries would be smaller than those further from boundaries.
Conclusion
Since Prins (Reference Prins1996), the understanding of the dynamics of mixed herds of buffalo has evolved, mainly due to breakthroughs in telemetry technology. Associations of buffalo are now considered more fluid than the initial idea of a stable mixed herd fixed in a home range. Individual buffalo belonging to a mixed herd participate in extensive fusion–fission events and can spend less than 30 per cent of their time together. In addition, dyads are not stable over time and patterns of individuals’ association within mixed herds are not clear. A mixed herd is therefore better defined by a fixed home range shared by individuals, and mixed herd switching by young or adult females has been observed on several occasions (Table 6.1). Individuals within mixed herds may associate based on kinship or shared metabolic requirements, and attempts to test these hypotheses have been inconclusive so far. These two non-exclusive hypotheses should attract more attention in future studies. These interpretations are mainly based on studies in southern Africa and their replication in other regions where the species occur would be welcome.
The dynamics of fusion–fission events within mixed herds are largely driven by habitat heterogeneity and the quality and quantity of grazing and surface water (Winnie et al., Reference Winnie, Cross and Getz2008). The size of grazing patches and water points determine the size of mixed herds that can crop them, and their distribution across space trigger fusion–fission dynamics. Additional drivers such as predation, parasitism or fires also influence mixed herd dynamics. However, most African buffalo populations today are exposed to some degree of human activity (traditional and trophy hunting, cattle grazing, roads, fences and fire to name a few). Human activities have been shown to impact buffalo movements, home ranges and daily activities (Naidoo et al., Reference Naidoo, Du Preez and Stuart-Hill2012a; Valls-Fox et al., Reference Valls-Fox, Chamaillé-Jammes and de Garine-Wichatitsky2018). The fluidity of the buffalo social system as updated in this chapter may help the species to adapt to changing environments and expanding buffalo/cattle/human interfaces (Figure 6.5). However, given the potential impact of climate change on water availability in Africa (James and Washington, Reference James and Washington2013), the drier conditions that will be experienced in semi-arid ecosystems in the coming decades may alter external drivers (e.g. intensity of buffalo/cattle/human interfaces) and herd dynamics (less), home range (larger) and group size (smaller) (Naidoo et al., Reference Naidoo, Du Preez and Stuart-Hill2012a; Roug et al., Reference Roug, Muse and Clifford2020; Wielgus et al., Reference Wielgus, Cornélis and de Garine-Wichatitsky2020).

Figure 6.5 Herd of Cape African buffalo observed from a helicopter, central Botswana.
Some large buffalo populations also remain unstudied. For example, 21,000 buffalo are estimated in Maromeu National Reserve in Mozambique and 12,000 in Zakouma National Park (Chapter 4). Forest buffalo are largely understudied despite their importance to confirm or not the existence of a core group for the species. Studies on these populations could shed light on the ‘natural’ ecology of buffalo populations in different contexts, as some remain relatively free of human impact.
In 1977, Sinclair concluded: ‘we need more data on the degree to which animals move between herds and whether there are characteristic gene frequencies for each herd’. These needs are still valid today, and one could add ‘how animals move within herds’. Future studies will benefit from more advances in telemetry, using cheaper devices (e.g. ear tags, proximity tags), new technologies (e.g. drones to regularly estimate group size around focal/collared individuals), new information sources (e.g. sound recorders) and non-invasive genetic studies to enhance our knowledge of buffalo social dynamics. These future studies should not forget that longitudinal observational studies based on fieldwork by researchers will always bring additional information that new technologies promoting remote access to data tend to occult.


 Open access