


Introduction
Although the total area of alpine glaciers is much smaller than that of polar ice sheets, the contribution of alpine glaciers to recent global sea-level rise is thought to be important (Reference MeierMeier, 1984; Reference Dyurgerov and MeierDyurgerov and Meier, 1997; Reference Gregory and OerlemansGregory and Oerlemans, 1998). Temperate glaciers are particularly sensitive to climate change because of their relatively large annual mass-exchange rates. Better understanding of the flow dynamics of maritime glaciers, such as Koryto glacier, Kamchatka, Russia, is needed to interpret changes in temperate-glacier systems. In this context, understanding basal motion is particularly important as many questions about the physics of basal motion remain unsolved (Reference WeertmanWeertman, 1979; Reference JanssonJansson, 1995; Reference WillisWills, 1995; Reference Iken and TrufferIken and Truffer,1997; Reference Hanson, Hooke and GraceHanson and others,1998).
Late 20th century climate changes are known to have affected maritime glaciers. There was a significant shift in air temperature and sea-surface pressure over the north Pacific Ocean in the late 1970s (Reference Nitta and YamadaNitta and Yamada, 1989; Reference TrenberthTrenberth,1990). Reference MinobeMinobe (1997) interpreted this shift as part of a periodic phenomenon with 50–70 year periodicity. In addition, glaciers in Alaska and Washington State, U.S.A., showed significant shifts in their mass-balance trends in the late 1970s (Reference McCabe and FountainMcCabe and Fountain, 1995; Reference Rabus, Echelmeyer, Trabant and BensonRabus and others, 1995). It is likely that the same phenomenon has affected the behavior of glaciers in Kamchatka Peninsula, on the opposite side of the north Pacific Ocean, because winter moisture is supplied to Kamchatka from both the Sea of Okhotsk and the Pacific Ocean. Accumulation on glaciers in Kamchatka is affected by the gradient between the Aleutian low-pressure system in the Pacific and the Siberian high-pressure system. Thus, the study of maritime temperate glaciers of Kamchatka will contribute new information on impacts of climate change in the north Pacific region.
Regional Setting
Koryto glacier is located on Kronotsky peninsula, which protrudes into the Pacific Ocean from the east coast of Kamchatka. The 32 glaciers in this region (Reference VinogradovVinogradov, 1968) typically have clean surfaces compared to other glaciers in Kamchatka, which generally have surfaces covered with debris or volcanic detritus. In addition, glaciers in this region exist at lower altitudes than those in other areas of Kamchatka. Some of them, including Koryto glacier, flow down to altitudes as low as 250 m a.s.l. Koryto glacier, with an area of 8.9 km2, is the third largest glacier in this region and extends northwestward from 1200–250 m a.s.l. and terminates at 54°50′ N, 161°44′ E. The glacier has a large accumulation area and a narrow ablation area (Fig. 1). The 1981/82 equilibrium-line altitude (ELA) was 780 m a.s.l. (Reference Haeberli and MüllerHaeberli and Müller, 1988).
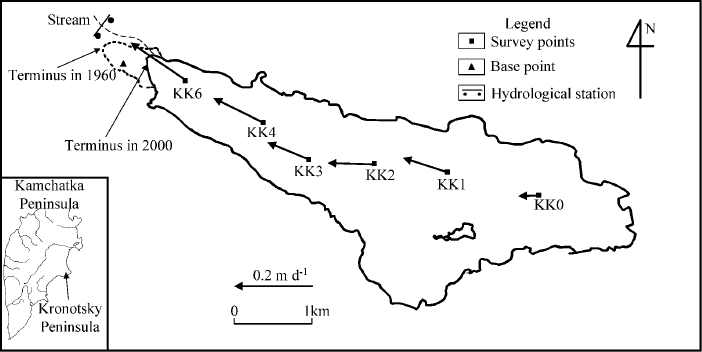
Fig. 1. Map of Koryto glacier, with mean horizontal velocities (arrows) measured in August and September 2000.The glacier terminus in 1996 is shown by a dotted line (determined from a 1960 map) and that in 2000 by a solid line. A thin broken line indicates an outlet stream in 2000.
According to Reference Dyurgerov and MeierDyurgerov and Meier (1999), the annual mass-balance amplitude of Koryto glacier is the second largest among the Northern Hemisphere glaciers studied for 1961–90. In fact, measurements here showed that winter accumulation was >7 m w.e. near the top of the accumulation area and summer ablation was >7 m w.e. near the terminus (Reference Shiraiwa, Murav’yev, Yamaguchi, Glazirin, Kodama and MatsumotoShiraiwa and others, 1997). This glacier is one of the most maritime glaciers to have been studied and is characteristic of glaciers in extreme maritime climates.
Measurements
From 2 August–7 September 2000, we measured the surface flow velocities on Koryto glacier at six survey points (Fig. 1). One of a pair of global positioning system (GPS) receivers (Topcon model GP-SX1) was established at a fixed base point near the glacier terminus. Positions of the six survey points on the glacier were measured in conjunction with the fixed receiver for 30 min periods (differential method). Altitudes of the survey points were determined in reference to the known altitude of the base point. Wooden dowels, ∼1 cm in diameter and 30 cm long, were set at each survey point. All dowels were buried in drilled holes with only the top ∼1 cm protruding above the surface to reduce errors due to leaning. The horizontal and vertical errors of the GPS positions depend on their distance from the base point; survey point KK0 had the largest uncertainty (±10 mm in the horizontal and ±20 mm in the vertical). Errors of dowel positions due to surface melting and leaning were less than ±5 mm total. Wooden stakes, 3 cm in diameter and 2 m long, were placed near the GPS survey points and melt rates obtained by measuring changes in the stakes’ height. Both position and melt rate at each point were measured almost daily.
At survey points KK4 and KK6, square strain grids (50 m × 23 m) were set up. Each side was measured three times during the survey period with an electric distance meter (Topcon EDM-theodolite: Guppy GTR-2R) and surface strain rates obtained.
Around the lower two points (KK4 and KK6) the surface was bare ice during the entire survey period, whereas around the upper two points (KK0 and KK1) it was persistently snow-covered. The surface around points KK2 and KK3 changed from snow-covered to bare ice with the rising snowline at KK2 on 25 August and at KK3 on 17 August.
A hydrological station was constructed at the outlet stream, about 800 m below the terminus, to measure water discharge from the glacier; precipitation was measured at hourly intervals with a rain gauge near the station (Fig. 1). The shape of the terminus in 2000 was measured using the distance meter.
Results
Shrinkage of the glacier
Comparison of the 2000 survey with the 1960 map with 10 m contour lines (personal communication from D. G. Tsvetkov, 1982) indicates that the terminus retreated ∼450 m during these 40 years (Fig. 1). Figure 2a shows the surface lowering at six survey points since 1960, estimated by comparing the 2000 GPS data with the 1960 map.The inferred thinning rate gradually decreases up-glacier; however KK0, the highest point, is an exception to this trend, showing a large average thinning of about 1 m a−1. Using these elevation changes and the altitudinal area distribution of Koryto glacier (Reference Shiraiwa, Murav’yev, Yamaguchi, Glazirin, Kodama and MatsumotoShiraiwa and others, 1997), we estimate that ice-thickness change averaged over the glacier is ∼ ∼−30 m and the glacier has lost 2.4 × 10⁸ m3 of ice since 1960.
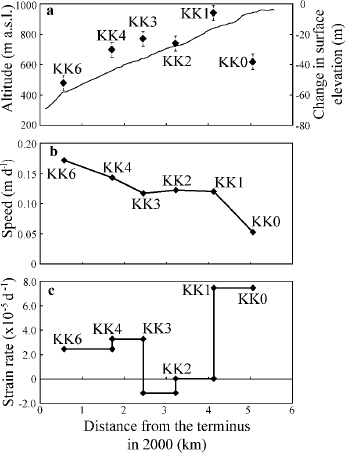
Fig. 2. Results of 2000 survey along the central flowline of Koryto glacier. (a) Surface profile in 2000 (solid line) and changes in surface elevation from 1960–2000 (diamonds), negative values being ice thinning. Error bars of elevation changes are mostly due to uncertainties in the 1996 altitude, which was derived from a 10 m contour map. (b) Distribution of flow speed averaged over the survey period. (c) Distribution of longitudinal strain rate. Positive value indicates the extension and negative the compression.
Horizontal flow velocities
The vectors in Figure 1 show the survey-averaged surface flow velocities at the six survey points. Figure 2 shows the surface profile, mean daily flow speeds and estimated longitudinal strain rates along a flowline. The maximum flow speed was observed at KK6, near the terminus, with speeds decreasing gradually up-glacier (Fig. 2b; Table 1). This speed distribution could be caused by surface steepening and possibly by faster basal motion near the terminus.
Table 1. Mean surface speeds during the survey period (August–September 2000) at the six points shown in Figure 1

Glaciers usually have a component of emergence velocity in the ablation area, due to a negative horizontal strain rate. Additionally, accumulation of snow in the upper areas of the glacier leads to a positive horizontal strain rate there. In fact, the 1997 results showed compressive flow in the lower reaches of the glacier and extension flow in its upper reaches (Reference YamaguchiYamaguchi and others, 1998). However the flow in 2000 was extensional in most areas although the strain rate magnitudes (Fig. 2c) were almost the same as in 1997. It is unclear why the strain-rate distributions are different for these 2 years, but might result in part from a difference in the time of the surveys (the 1997 and 2000 surveys were in late and middle ablation season, respectively).
Vertical displacement
Figure 3 shows vertical displacements at five survey points. Each value was derived from the difference between ice-surface heights with the surface lowering due to ice melt eliminated. The motion was generally downward during the survey period, with increasing magnitude down-glacier.
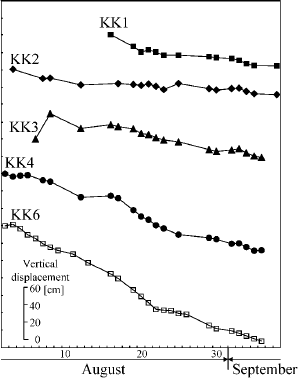
Fig. 3. Vertical displacements at five survey points, 2 August–7 September 2000.
Discussion
Glacier recession and climate conditions
The glacier termini retreated by 80 m from 1971–82 (Reference Haeberli and MüllerHaeberli and Müller, 1988) and 300 or 310 m from 1971–97 (Reference Murav’yev and NaruseMurav’yev and others, 1999). Assuming the retreat rate from 1997–2000 is similar to that from 1982–97, we can estimate the change in the glacier length based on the 7000 m length in 2000 (Fig. 4c). The retreat rates were ∼8 m a−1 from 1960–82 and ∼15 m a−1 from 1982–2000; the recession has accelerated.
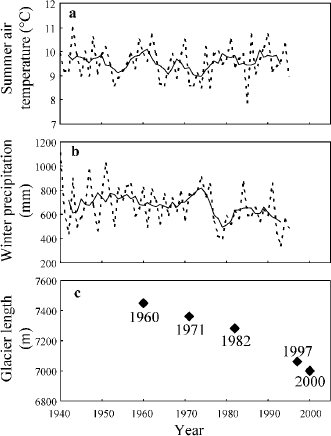
Fig. 4. Comparison of change in the glacier length with climate conditions at Stopozh, about 50 km southwest of Koryto glacier: (a) Mean summer air temperature (June–August); (b) total winter precipitation (October–May); and (c) change in glacier length. Broken lines indicate values at each year and solid lines indicate values of the 5 year running mean.
Figures 4a and 4b show variations in mean summer air temperature (June–August) and winter precipitation (October–May) at Stopozh, a meteorological station near the glacier (Reference Murav’yev and NaruseMurav’yev and others,1999). Summer temperatures fluctuated without any significant trend, but winter precipitation decreased significantly after the early 1970s. Specifically, the difference between the average summer temperatures before and after 1975 is only 0.1°C, whereas the difference between the average winter precipitation before and after 1975 is 130 mm, a change of more than 18%. Thus the acceleration of recession of Koryto glacier may be caused by the decrease in winter precipitation. Numerical experiments using a one-dimensional model of the glacier reconstructed the glacier-recession trends well during the last half century under conditions of fluctuating winter precipitation (Fig. 4b) and constant summer temperature (S.Yamaguchi and others, unpublished data).
The same decreasing winter-precipitation trend was reported at South Cascade Glacier, Washington, U.S.A., on the eastern side of the Pacific Ocean; a phenomenon believed to be caused by a change in the synoptic-scale atmospheric field (Reference McCabe and FountainMcCabe and Fountain,1995). It is likely that the same phenomenon affected the mass balance of Koryto glacier.
Daily fluctuation in horizontal flow speed
Daily values for surface horizontal flow speed at the five survey points with sufficient data are shown in Figure 5. The figure also shows water discharge from the glacier and daily water input, calculated as the sum of the daily melt-rate averaged over the glacier plus the daily precipitation, both of which have been shown to be related to surface speed change (e.g. Reference Hooke, Calla, Holmlund, Nilsson and StroevenHooke and others, 1989; Reference Hanson and HookeHanson and Hooke,1994).
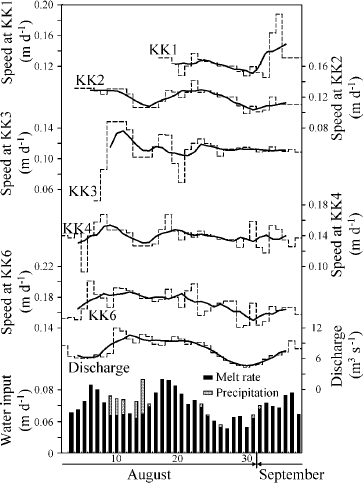
Fig. 5. Daily fluctuations in surface horizontal flow speed (broken lines) and the 5 day running mean (solid lines) at five survey points, plus daily water input (sum of precipitation and melt rate averaged over the glacier) and water discharge from the glacier terminus, 2 August–7 September 2000.
The flow rate at each survey point exhibits significant daily fluctuations, implying that basal motion occurred all over the glacier bed because such large fluctuations in the internal ice-deformation rate are unlikely to occur.The data generally show higher speed at some locations in early August, around 20 August and 3 September. These correspond to the large water-input periods. Five day running-mean curves show a high correlation between the speed at KK6, near the terminus, and the discharge (correlation coefficient of ≈ 0.85). A weak correlation can also be seen between motion at KK4 and the discharge. A similar relationship was obtained in 1997, with peaks of discharge appearing ≈ 4 h later than peaks of the flow speed near the terminus (Reference YamaguchiYamaguchi and others, 1998). These correlations between discharge and speed may reflect an underlying linkage between the discharge and the subglacial water storage or pressure near the terminus.
A possible cause of downward vertical movement
There are two different subglacial drainage systems in alpine glaciers; one is an inefficient, distributed drainage system and the other is an efficient, channelized drainage system (which forms at regions of the bed underlying snow-free ice at the surface) (Reference Nienow, Sharp and WillisNienow and others, 1998). The latter system grows up-glacier at the expense of the former system as the snowline rises. Based on this concept, the trend of decreasing vertical-displacement magnitude up-glacier (Fig. 3) might be due to the different drainage systems; e.g. the relatively large vertical displacements in the lower part of the glacier may be due to changes in a well-developed channelized drainage system under the ablation zone.
Vertical velocity (w s), which represents the rate of vertical displacement per day, arises from a combination of flow on a sloping bed, vertical strain of the ice and expansion or contraction of englacial or subglacial cavities (Reference Hooke, Calla, Holmlund, Nilsson and StroevenHooke and others, 1989). Thus,
where u b is the horizontal component of the basal velocity, β is the bed slope (taken as positive for upward slope in the flow direction x), Ez is the vertical strain rate averaged over the ice thickness (H), v is vertical velocity caused by basal sliding and vertical strain, and C is the vertical uplift rate due to cavity opening. Both w s and v are taken positive upward.
We now estimate the approximate magnitude of each term of Equation (1). Principal strain rates were calculated as 0.66 × 10⁻⁴ and −2.16 × 10⁻⁴ d−1 at KK4 and 0.62 × 10⁻⁴ and −1.90 × 10⁻⁴ d−1 at KK6. Then, assuming the incompressibility of ice, vertical strain rates at the surface Ez s were estimated as 1.5 × 10⁻⁴ and 1.3 × 10⁻⁴ d−1 at KK4 and KK6, respectively. In valley glaciers, vertical strain rate may change with depth (Reference HarrisonHarrison, 1975). However in the present study, we do not have sufficient strain-rate data to evaluate the effect of difference in vertical strain rate with depth, as analyzed by Reference Mair, Sharp and WillisMair and others (2002). Therefore, as a first approximation, we assume constant vertical strain rate with depth, namely Ez = Ez s.
Values for H and β were estimated from ice-radar measurements made in 2000 (personal communication from Yu.Ya. Macheret, 2001). Since we have no data to constrain u b, alternately we assume u b = 0 and u b = u s, which yield the maximum and minimum vertical velocities v max and v min, respectively (Table 2).
Table 2. Parameters used for calculations and estimated vertical velocities v min and v max due to basal sliding and vertical strain at KK4 and KK6

In Figure 6, daily variations in the measured w s at five survey points are shown with the estimated v max and v min at the lower two points. All values of w s are found to be lower than vmin at KK4 and KK6. If the vertical strain rate increased with depth as measured at Blue Glacier, Washington, U.S.A. (Reference HarrisonHarrison, 1975), then Ez > Ez s, which results in increases of v max and v min. Therefore, it is likely that the surface lowering at these two points was due to shrinkage of englacial or subglacial cavities. However, we cannot conclude this effect is a definite cause because there are several errors and uncertainties in the measurements and estimates.

Fig. 6. Daily fluctuations in vertical velocity ws (solid lines) at five survey points, 2 August–5 September 2000. Broken horizontal lines indicate vertical velocities (v min and v max ) caused by basal motion and vertical strain at KK4 and KK6. Both w s and v are positive upward.
The inferred cavity shrinkage implies that a lot of water was stored within the glacier and at the bed before this survey period. This trend is consistent with observations that total water discharge from the glacier was much larger than the cumulative amount of surface ablation in the same period (T. Matsumoto and others, unpublished data), which may be the same phenomenon reported at Mikkaglaciärem, Sweden (Reference StenborgStenborg, 1970), and South Cascade Glacier (Reference Tangborn, Krimmel and MeierTangborn and others, 1975).
There are numerous studies which show that surface flow speed increase is correlated with upward vertical velocity (e.g. Reference Iken, Röthlisberger, Flotron and HaeberliIken and others, 1983; Reference Iken and BindschadlerIken and Bindschadler, 1986; Reference Kamb and EngelhardtKamb and Engelhardt, 1987). At Koryto, although simultaneous peaks of horizontal speed and vertical velocity can be recognized on some days (Figs 3 and 6), no significant correlations were found between them.
Conclusions
Koryto glacier has thinned by 10–50 m and retreated about 450 m since 1960 and its recession has accelerated. The acceleration may be related to the change in winter precipitation, which decreased by about 18% after the mid 1970s. The same trend was reported at South Cascade Glacier on the other side of the Pacific Ocean.
The surface horizontal speeds measured at six points showed marked daily fluctuations, so the dominant contribution to flow is considered to be the basal motion. Surface lowering of the glacier, during the survey period in mid melt season, may be caused by shrinkage of englacial and subglacial cavities. This suggests the storage of a large amount of water in the glacier during the early melt season. It is recommended that investigations of the dynamics and response of this extreme maritime system are continued at Koryto glacier.
Acknowledgements
We would like to thank T. Yamada, T. Aoki, K. Konya and S. Tchoumitchev, Institute of Low Temperature Science, Hokkaido University, who helped with field research and gave useful suggestions. We also wish to express our gratitude to Yu.Ya Macheret, A. F. Glazovsky, Institute of Geography, Russian Academy of Sciences, and Ye.V. Vasilenko, Institute of Industrial Research ‘Academpribor” for providing ice radar data. The constructive comments from an anonymous reviewer and the Scientific Editor K. M. Cuffey led to major improvements in this paper. Suggestions from the Chief Editor W. D. Harrison were also helpful to the revisions. This study was supported by a grant from the Ministry of Education, Science, Sports and Culture, Japan (No. 11691166: principal investigator T. Hara).


