


Worldwide, epidemiological studies have shown a high prevalence of overweight and unhealthy lifestyles among children and adolescents(1,Reference Ng, Fleming and Robinson2) . The food environment plays an important role in this context, with an impact on young people’s health(Reference Poskitt3).
While a dietary assessment investigates food and nutrient intakes, a study of food choices confines to the selection of foods and does not reach what foods are eaten(Reference Smith and Cunningham-Sabo4). Furthermore, the assessment of food choices has to consider the different factors motivating the selection of one food over another, such as taste, familiarity and/or health(Reference Contento, Williams and Michela5).
In order to investigate the food choices of adolescents motivated by health, researchers from the HELENA (Healthy Lifestyle in Europe by Nutrition in Adolescence) study developed the Food Choices and Preferences (FCP) questionnaire based on focus group discussions with European adolescents concerning their insights about healthy eating and lifestyle, food choices and preferences(Reference Gonzaléz-Gross, Henauw and Gottrand6,Reference Gilbert, Hall and Hegyi7) . This questionnaire has been analysed based on a classic approach that takes into account the percentage of answers; however, this analysis focused on specific topics of the FCP(Reference Hallström, Vereecken and Ruiz8). In this regard, there is a need to obtain a more detailed information about health motivation influencing food choices.
The Item Response Theory (IRT) analysis has been suggested as an approach to measure attitudes and abilities complementing the classical analysis underlying the percentage of responses. The IRT analysis provides a discrimination of the latent trace for each item of the questionnaire and considers the proximity between individuals and items to calculate the scores(Reference Santos, Julian and Andrade9–Reference Roberts, Donoghue and Laughlin11). However, the use of IRT analysis is relatively recent in the evaluation of food attitudes(Reference Baranowski, Watson and Missaghian12,Reference Baranowski, Missaghian and Broadfoot13) , especially when considering the proximity factor between individuals and the studied items.
For these reasons, we aimed (i) to develop a scale to assess health motivation influencing food choices using a generalised graded unfolding model (GGUM) of the IRT; and (ii) to explore the performance of the scale in association with food intakes and nutritional biomarkers. In order to assess these objectives, the motivation influencing food choices was considered a latent trace in the current analysis.
Methods
Study design and subjects
The HELENA study is a cross-sectional, multi-centre investigation in ten European cities of more than 100 000 habitants: Vienna (Austria), Gent (Belgium), Lille (France), Dortmund (Germany), Athens and Heraklion (Greece), Pécs (Hungary), Rome (Italy), Zaragoza (Spain) and Stockholm (Sweden)(Reference Moreno, De Henauw and Gonzalez-Gross14). It was carried out on a random cluster sample of 3528 European adolescents aged 12·5–17·5 years, stratified for geographical location, age and socioeconomic status. Overall, ten schools and 15–20 classes (350–400 students) were selected from each centre of investigation. At the selected schools, the eligibility of each class was based on the percentage of students who agreed to participate in the HELENA study, equal to at least 70 %. From the total sample, it was decided to obtain blood samples from a random selected group of one-third of adolescents (n 1089).
Exclusions from the study were carried out a posteriori when the adolescents presented simultaneous participation in another clinical trial; age <12·5 or ≥17·5 years; and/or acute infection within 1 week before inclusion. Those adolescents who completed the FCP questionnaire were included (n 2954) for factor analysis. To estimate the IRT parameters, a random sample of 2000 adolescents was selected in accordance to the maximum number of respondents for analyses using the GGUM 2004 software. No differences were observed between those who participated in the current analyses and those who did not, except for their age; adolescents who were included in the current analyses are older than the whole sample (online Supplementary Table S1).
The IRT scores could only be estimated for 2000 adolescents. For the mixed model linear regression analyses, adolescents had to provide complete information on IRT scores, dietary intake, biomarkers and corresponding confounding factors. Adolescents who had information on dietary intake (n 1945) were included to investigate associations between food intakes and IRT scores. Those who had information on blood testing (n 641) were included to investigate associations between biomarkers and IRT scores. These analyses were also processed excluding under-reporting of energy intake. When evaluating energy under-reporting, we considered the Black(Reference Black15) approach using the Goldberg et al.(Reference Goldberg, Black and Jebb16) cut-off points. A total of 311 adolescents under-reported energy intake.
Food choices assessment
Food choices were evaluated using the FCP questionnaire (online Supplemental Figure 1) that investigated adolescent attitudes and opinions about food choices, preferences, healthy eating and lifestyle(Reference Gonzaléz-Gross, Henauw and Gottrand6,Reference Vicente-Rodriguez, Libersa and Mesana17) . Adolescents answered the questionnaire while in the classroom.
The FCP questionnaire presented 166 questions with different response models, but 161 of them required selecting only one answer. When performing IRT analysis, and due to the hedonic nature of the scale, only questions with one possible answer can be included. Those questions with more than one possible answer and those with a non-hedonic scale were excluded (n 42), with 124 questions remaining in the present analyses. In the FCP questionnaire, the questions were displayed in three sections(Reference Gonzaléz-Gross, Henauw and Gottrand6). From these sections, the following subsections presented the criteria to be included in the present study:
-
(1) Opinions about food choices, preferences, diet and health, with subsection 1.1 ‘Opinions about food choices, preferences and healthy eating’ (seven-point hedonic scale);
-
(2) Choices and preferences of snack foods and drinks, with subsections 2.1 ‘How much the adolescent liked each food and drink from a popular list of snack foods and drinks’ (five-point hedonic scale); and 2.2 ‘How healthy the adolescent perceived each of those foods and drinks to be’ (five-point hedonic scale);
-
(3) Important influences on food choices and preferences, with subsection 3.1 ‘Important influences on food choices at breakfast, main meal and snacks’ (five-point hedonic scale).
Sociodemographic characteristics
Socioeconomic status was evaluated with a self-reported questionnaire that collected data on living conditions, family structure, employment status and parental occupation, and educational level(Reference Iliescu, Beghin and Maes18). The Family Affluence Scale index was calculated based on this questionnaire and used as an indicator of adolescents’ material affluence. The final score ranged from 0 to 8 and was dichotomised into ‘low familial wealth’ (0–4) and ‘high familial wealth’ (5–8). Maternal education levels were categorised in ‘primary education’, ‘lower secondary education’, ‘higher secondary education’ and ‘university degree’(Reference Julián, Mouratidou and Vicente-Rodrigues19).
Dietary assessment
Dietary intake was assessed via two non-consecutive computerised 24-h recalls, including weekdays and Sundays, and using the HELENA-Dietary Intake Assessment Tool (HELENA-DIAT). The second 24-h recall was administered 2 weeks after the first(Reference Vandevijvere, Geelen and Gonzalez-Gross20). Both 24-h recalls were completed at the school setting, and trained nutritionists assisted the students when required. Adolescents autonomously selected all the consumed foods and beverages from a food list that included six ‘meal occasions’. Some questions were presented to respondents to help them remember what they ate the day before(Reference Vereecken, Covents and Sichert-Hellert21).
In order to remove the effect of day-to-day variability and random error in 24-h recalls, the individual’s usual food intake was estimated by the multiple source method(Reference Haubrock, Nothlings and Volatier22). This analysis takes into consideration information from the food frequency questionnaire (FFQ) as a covariate of the two 24-h dietary recalls. This FFQ was designed by the Healthy Behaviour in School-aged Children study(Reference Currie23) and includes fifteen items and seven response categories ranging from ‘never’ to ‘more than once a day, every day’(Reference Vandevijvere, Geelen and Gonzalez-Gross20).
Food and beverage consumption was expressed as g/d and ml/d, respectively. Fifteen food groups were computed according to similarity in nutritional content and health-related characteristics: (i) vegetables (excluding potatoes); (ii) fruits; (iii) vegetables (excluding potatoes) and fruits; (iv) sweets (including carbonated/soft/isotonic drinks, cakes, biscuits, chocolate and other sugar products); (v) cereals; (vi) nuts and seeds; (vii) vegetable oils; (viii) olives and avocado; (ix) alcohol; (x) dairy products (including milk and yogurt); (xi) pulses; (xii) water; (xiii) meats and eggs; (xiv) fish; and (xv) savoury snacks.
Body composition
Weight was measured using of an electronic scale (model SECA 861; precision 0·1 kg). Height was measured, with participants barefoot in the Frankfort plane, using a telescopic height-measuring instrument (model SECA 225; precision 0·1 cm; range 70–200 cm). All measurements were taken by trained staff(Reference Nagy, Vicente-Rodriguez and Manios24).
Body mass index (BMI) was calculated as weight (in kilograms) divided by the square of height (in meters). The values of BMI were categorised into ‘thinness’, ‘normal weight’, ‘overweight’ and ‘obesity’ using the BMI cut-offs defined by Cole et al.(Reference Cole, Flegal and Nicholls25,Reference Cole, Bellizzi and Flegal26) .
Analysis of blood biomarkers
Blood collection was performed after 10 h of overnight fast following a standardised protocol. A handling and transport system was developed to guarantee quality assurance and stability of fresh blood samples(Reference González-Gross, Breidenasel and Gomez-Martinez27).
Folate (plasma and erythrocyte) and cobalamin were measured by competitive immunoassay (Immunolite 2000; DPC Biermann GmbH). β-Carotene and vitamin C were analysed by HPLC (Sykam) via UV detection (UV-Vis 205; Merck Darmstadt). n-3 and trans-fatty acids concentrations were determined using capillary GC (Model 3900) after extraction by TLC. Holo-transcobalamin was measured by micro-particle enzyme immunoassay (Active B12; Axis-Shield Limited) using an AxSym analyser (Abbott Diagnostics, Abbott Park)(Reference Vandevijvere, Geelen and Gonzalez-Gross20,Reference González-Gross, Breidenasel and Gomez-Martinez27) .
Data analysis
The dimensionality of the FCP questionnaire was analysed by factor analysis using principal components analysis with varimax orthogonal rotation. Items that presented unidimensionality were maintained for further analyses. Conformability was based on the Kaiser–Meyer–Olkin (KMO) test (>0·50), Bartlett test (P < 0·05)(Reference Hair, Black and Babin28), and communality of items derived from the two retained factors. One item was excluded when communality was <0·30, indicating that these two retained factors represented <30 % of its variation(Reference Roberts, Donoghue and Laughlin11,Reference Roberts and Laughlin29) . Factor analysis was repeated only with items with adequate communality and factor loadings >0·40. In addition, the first factor had to explain ≥20 % of the total variance(Reference Reckase30).
To perform IRT analysis with the estimation of IRT parameters, GGUM was used. This model allows measures of proximity of the individual to the item and can be represented by a single-peaked response function indicating that agreement will be higher when the proximity of the individual to the item is lower(Reference Roberts, Donoghue and Laughlin11,Reference Roberts and Laughlin29) . Regarding health motivation influencing food choices, both an individual with low motivation and another one with high motivation would present a high disagreement with the studied item. For example, for the item ‘What is your opinion about: you feel well informed about what are healthy foods?’ that presents seven possible responses (from ‘strongly disagree’ to ‘strongly agree’), both individuals may think that they are not informed enough about healthy foods; therefore, the distance between the item and the individual will be large in both cases.
GGUM is represented by the following equation:
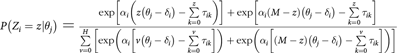 $$P\left( {{Z_i} = z|{\theta _j}} \right) = {\rm{ }}{{\exp \left[ {{\alpha _i}\left( {z\left( {{\theta _j} - {\delta _i}} \right) - \sum\limits_{k = 0}^z {{\tau _{ik}}} } \right)} \right] + \exp \left[ {{\alpha _i}\left( {M - z} \right)\left( {{\theta _j} - {\delta _i}} \right) - \sum\limits_{k = 0}^z {{\tau _{ik}}} } \right]} \over {\sum\limits_{v = 0}^H {\left[ {\exp \left( {{\alpha _i}\left[ {v\left( {{\theta _j} - {\delta _i}} \right) - \sum\limits_{k = 0}^v {{\tau _{ik}}} } \right]} \right) + \exp \left( {{\alpha _i}\left[ {\left( {M - z} \right)\left( {{\theta _j} - {\delta _i}} \right) - \sum\limits_{k = 0}^v {{\tau _{ik}}} } \right]} \right)} \right]} }}$$
where
Z i = an observable response to item i;
z = 0, 1, 2, …, C, where z = 0 corresponds to the strongest level of disagreement;
θ j = the location of individual n on the continuum of motivation influencing food choices;
α i = discrimination parameter of item i;
δ i = the location of item i on the continuum of motivation influencing food choices;
τ ik = the relative location of the subjective response category threshold k on the continuum relative to a given item i;
M = the number of subjective response categories minus 1.
Y i = a subjective response to item i;
y = 0, 1, 2, 3, …, M, where y = 0 corresponds to the strongest level of disagreement from below the item, whereas y = M corresponds to the strongest level of disagreement from above the item.
α i indicates the variation of a subjective response category between the items while the score changes along the continuum. Items with higher values for this parameter present a lower probability of change across categories when variation of the score is low. δ i is estimated in the same scale of the parameter of location of an individual (θ j ), and it indicates if someone is located below or above the location of an item. τ ik indicates the range of subjective responses for each item. Individual scores were obtained using a Bayesian estimation method: the Expected a Posteriori (EAP) with a priori distribution(Reference Bortolotti, Tezza and Andrade10).
All IRT parameters (α i , δ i and τ ik ) were estimated by marginal maximum likelihood with N (0, 1) a priori distribution with mean = 0 and se = 1. The estimates were analysed with the corresponding standard error. Items with a high δ i standard error and with overlapping of the item characteristic curve were re-categorised. Items that remained with high δ i standard errors after the re-categorisation and with low values for α i were excluded for further analyses.
Fifty quadrature points were used equally spaced between –4 and +4 with P value <0·001 for convergence. For each pair of θ j and δ i , a signed difference was calculated, and this difference was divided into homogenous groups of size n 100.
The range of scores from health motivation influencing food choices between which individuals are most likely to agree with the latter category was assessed from the equation Delta ± Tau of the last category. Item fit was assessed using unweighted mean squared error (outfit) and weighed mean squared error (infit). Items that presented these statistics not equal or close to 1 were excluded(Reference Bortolotti and Andrade31). Two nutritionists (TSSS and CJ) did the characterisation of each scale level.
Chi-square tests were performed to evaluate differences between demographic, socioeconomic and BMI categories within each scale level. Mixed model linear regression analyses were used to verify associations between food group intakes, nutritional biomarkers and IRT scores (as continuous data). Food group and biomarker variables were included separately in the model, and centre of investigation was included as the random intercept. Age, gender, maternal education, Family Affluence Scale index, BMI and energy intake were entered as covariates in the model.
Analyses were carried out using the statistical software package STATA version 14.0 and GGUM 2004 software(Reference Roberts, Donoghue and Laughlin11,Reference Roberts, Fang and Cui32) .
Results
As suggested by factor analysis, items from the three sections of the FCP questionnaire did not present unidimensionality. Nevertheless, some items presented low values of communality and factor loadings. Items referring to the subsection 2.1 (How much the adolescent liked each food and drink from a popular list of snack foods and drinks) were excluded from further analyses as they were grouped into a different factor compared with other subsections.
Factor analysis was repeated for subsections 1.1 (Opinions about food choices, preferences and healthy eating), 2.2 (How healthy the adolescents perceived each of those foods and drinks) and 3.1 (Important influences on food choices at breakfast, main meal and snacks). No items from subsections 1.1 and 2.2 presented adequate values of communality and factor loadings. Only some items of subsection 3.1 presented adequate values of communality and factor loadings, suggesting that these items were related to a different latent trace than the items from subsections 1.1 and 2.2.
The aforementioned analyses indicate that the items from subsections 2.1 (How much the adolescents liked each food and drinks from a popular list of snack foods and drinks) and 3.1 (Important influences on food choices at breakfast, main meal and snacks) measured a latent trace other than health motivation influencing food choices. Factor analysis was repeated for the other two subsections (1.1 and 2.2). On the rotated solution, nineteen items (seven from subsection 1.1 and twelve from subsection 2.2) presented adequate communality and factor loadings and explained 22 % of the total variance. The data were suitable for factor analysis considering the KMO test (0·89) and the Bartlett test (χ 2 = 20 058·4; df = 171; P = 0·000).
These nineteen items were analysed with GGUM (online Supplemental Table S2). Sixteen of these items presented adequate IRT parameters and respective standard errors for the final Scale of evaluatiOn of Food choIcEs (SOFIE). The questions are displayed in online Supplemental Figure 2.
The IRT parameters (α i , δ i and τ ik ), range of scores, and values for outfit and infit of the remaining items are described in Table 1 in δ i increasing order. The item ‘What is your opinion about: the food you eat at home is healthy?’ presented the highest value for discrimination parameter (α i = 2·09). Individuals who presented SOFIE scores between –0·23 and 2·07 were more likely to agree on this item. The item ‘What is your opinion about: you enjoy fruit and vegetables?’ presented the lowest value for discrimination parameter (α i = 0·53) and the highest value for δ i (1·75). Individuals who presented SOFIE scores between 1·36 and 2·15 were more likely to agree moderately on this item. The characteristic curves for these two items are displayed in Figs 1 and 2, respectively.
Table 1 Total number of categories, generalised graded unfolding model item parameter estimates, range of scores, outfit and infit for each item from the SOFIE scale (n 2000)

N cat, number of categories; α i, discrimination parameter of item i; SE, standard error; δ i, location of item i on the attitude continuum; τi1, equal to zero for all items; τi2, difference between subjective categories from category 2; τi3, difference between subjective categories from category 3; τi4, difference between subjective categories from category 4; τi5, difference between subjective categories from category 5. Range = Delta±Tau of the last category.
* Very unhealthy; unhealthy; indifferent; healthy.
† Very unhealthy; unhealthy; indifferent; healthy; very healthy.
‡ Unhealthy; indifferent; healthy; very healthy.
§ Unhealthy; indifferent; healthy.
‖ Disagree; indifferent; agree.
¶ Disagree; indifferent; slightly agree; moderately agree.

Fig. 1 Item characteristic curve for (‘What is your opinion about the food you eat at home is healthy?) with the highest discrimination parameter (α i = 2·09) (n 2000). Prob., Probability; Theta, IRT scores; z0 (![]() ), item characteristic curve from category 1; z1 (
), item characteristic curve from category 1; z1 (![]() ), item characteristic curve from category 2; z2 (
), item characteristic curve from category 2; z2 (![]() ), item characteristic curve from category 3
), item characteristic curve from category 3

Fig. 2 Item characteristic curve for (‘What is your opinion about enjoying fruits and vegetables?’) with the lowest discrimination parameter (α i = 0·53) and highest parameter of the location of the item (δ i = 1·75) (n 2000). Prob., probability; Theta, IRT scores; z0 (![]() ), item characteristic curve from category 1; z1 (
), item characteristic curve from category 1; z1 (![]() ), item characteristic curve from category 2; z2 (
), item characteristic curve from category 2; z2 (![]() ), item characteristic curve from category 3; z3 (
), item characteristic curve from category 3; z3 (![]() ), item characteristic curve from category 4
), item characteristic curve from category 4
The items presented adequate values for outfit (range 0·84–1·30) and infit (range 0·83–1·27). The adequate overall adjustment of the observed average values is shown in Fig. 3.

Fig. 3 Average observed v expected estimates of food choice scores (n 2000). Theta – Delta = IRT scores – parameter of the location of the item
SOFIE was categorised into three levels, namely low (1), indifferent (2) and high (3). Level (1) includes items about how healthy the adolescents perceived chocolate milk, cheese products, sandwiches/toasts/panini, cereal bars, yoghurt/yoghurt products, bowl of cereal and juices. Level (2) includes items about how healthy the adolescents perceived bread/toast, milk, tea and pasta dishes. Level (3) includes items about the opinions about feed at home, individual diet, information about healthy foods and food preferences. So, individuals who moderately agreed on item ‘What is your opinion about: you enjoy fruit and vegetables?’ (those with scores between 1·36 and 2·15) were more likely to present high health motivation in choosing foods. Individuals who perceived tea as healthy (those with scores between –1·69 and 2·09) were more likely to present indifferent health motivation when choosing foods. SOFIE medium scores are less informative than those in the low and high levels (Fig. 4).

Fig. 4 Test information curve from Scale of Evaluation to Food Choices (n 2000)
Demographic and socioeconomic characteristics of the participants on the three levels of SOFIE are displayed in Table 2. Girls and adolescents with a high Family Affluence Scale index and mothers with university education presented high health motivation when choosing foods.
Table 2 Demographic and socioeconomic characteristics and BMI according to food choices among European adolescents (n 2000)

FAS, Family Affluent Scale; BMI, body mass index.
† Likelihood ratio.
‡ Linear-by-linear association.
* P < 0·05.
The results of the mixed model linear regression analyses with food group consumption as the dependent variable are shown in Table 3. SOFIE scores were positively associated with intakes of cereals, dairy products, meats and eggs, and fish, and were negatively associated with intakes of alcohol (P < 0·05). These results are similar when under-reporters were excluded from the analyses (online Supplemental Table S3). The only difference observed was that SOFIE scores were also negatively associated with intakes of nuts and seeds and savoury snacks (P < 0·05). Comparative analyses indicated that under-reporters had a lower intake of savoury snacks (P < 0·05) (data not shown).
Table 3 Mixed model analyses between food groups’ intakes (g/d) and food choice scores among European adolescents adjusted by age, gender, maternal education, Family Affluent Scale and energy intake (n 1945)

EPA, eicosapentaenoic acid; DHA, docosahexaenoic acid.
* P < 0·05. Centre used as the random intercept.
The results of mixed model linear regression analyses with biomarkers as the dependent variable are displayed in Table 4. SOFIE scores were positively associated with the concentrations of vitamin C, β-carotene, n-3 fatty acids, cobalamin, holo-transcobalamin and folate (plasma and erythrocyte) (P < 0·05). These results are similar when the number of cigarettes was included as covariate and when under-reporters were excluded (online Supplemental Table S4).
Table 4 Mixed model analyses between biomarkers and food choice scores among European adolescents adjusted by age, gender, maternal education, Family Affluent Scale, BMI and energy intake (n 641)

* P < 0·05. Centre used as the random intercept.
Discussion
The present study developed a scale to assess health motivation influencing food choices (SOFIE), applying a generalised graded unfolding model of the IRT to the FCP questionnaire, among adolescents. Factor analysis indicated that more than one factor explained the total variance from the subsections analysed. Nineteen items from the subsections about opinions on food choices, preferences and healthy eating (1.1) and how healthy the adolescents perceived each of those foods and drinks (2.2) showed the unidimensionality assumption for GGUM(Reference Roberts, Donoghue and Laughlin11,Reference Roberts and Laughlin29,Reference Reckase30) . Some previously developed questionnaires(Reference Fotopoulos, Krystallis and Vassallo33,Reference Steptoe, Pollard and Wardle34) have evaluated the motivation influencing food choices based on multidimensional approaches. Our results indicate that SOFIE covers one dimension of the continuum in the evaluation of health motivation for choosing foods.
Regarding the IRT analyses, the accuracy of the estimates of item parameters depends on the responses to each category(Reference Bock and Aitkin35). For these reasons, two items were excluded, because they presented a low frequency of response to the ‘disagree’ category and, therefore, higher standard errors: ‘What is your opinion about: what you eat now will have a big impact on your future health?’ and ‘What is your opinion about: if there is the option to choose a whole grain version of a food, you will choose it?’ The item ‘How healthy you perceived water?’ was excluded because it had a high frequency of response on the ‘unhealthy’ category and, therefore, it was not possible to apply re-categorisation of item responses. Sixteen items assessed health motivation influencing food choices accurately. Moreover, SOFIE does not present extreme values for the parameter of location of the item (δ i ), varying from –0·11 to 1·75. No extreme values of τ ik and δ i can confirm the accuracy of the estimates(Reference Roberts, Donoghue and Laughlin11).
The item ‘What is your opinion about: you enjoy fruit and vegetables?’ presented the lowest discrimination parameter (α i ) and the largest location (δ i ). However, this item remained in SOFIE because of its importance for evaluating health motivation influencing food choices in this specific population. Lowest discrimination (α i ) and largest location (δ i ) of this item indicate the difficulty to evaluate the food practices related to fruit and vegetable intakes. Some adolescents may think they have an adequate consumption of healthy foods(Reference Toral, Slater and Cintra36) even if they are not reaching the corresponding dietary recommendation stated in g/d and daily number of servings(Reference Diethelm, Jankovic and Moreno37). Another possibility is that adolescents’ answers are influenced by social desirable responses(Reference Bel-Serrat, Julián-Almárcegui and González-Gross38). Furthermore, the current study failed to find an association between fruit and vegetable intakes and SOFIE scores (P > 0·05), confirming the difficulty in evaluating the food practices related to these intakes. A recent study indicated that adolescents have a greater motivation to choose unhealthy snacks even when they have eaten healthy foods or when there is a high availability of healthy foods at home(Reference Vervoort, Clauwaert and Vandeweghe39).
The item ‘What is your opinion about: the food you eat at home is healthy?’ presented the highest value for discrimination parameter (α i = 2·09). This item is important to the continuum of motivation influencing food choices. Individuals who agreed on this item were more likely to choose healthy food options. With respect to foods eaten at home, the literature indicates that the more frequent the family meals, the better the diet quality, and this may be associated with a healthy nutritional status of the youth(Reference Fulkerson, Larson and Horning40). In this regard, adolescents with the best socioeconomic status and maternal education also presented high health motivation when choosing foods.
SOFIE scores presented an adequate adjustment with more accurate estimates in the low and high levels (Figs 3 and 4). Therefore, IRT analyses improved the assessment of health motivation influencing food choices. The formerly used approaches were restricted to the classical test theory(Reference Hallström, Vereecken and Ruiz8,Reference Eertmans, Victoir and Notelaers41) . IRT has some advantages in comparison with the classical approach, which only assess the percentage of responses for each item. Although the current analysis indicated differences on demographic and socioeconomic characteristics across the SOFIE levels, the IRT parameters and scores were independently estimated of the sample characteristics(Reference Araújo, Andrade and Bortolotti42). Moreover, IRT distributes items based on the continuum of motivation influencing food choices, which allows categorising responses on low or high motivation(Reference Araújo, Andrade and Bortolotti42). In this context, SOFIE allows to know the food attitudes influenced by adolescents’ health motivation.
The assessment of associations between SOFIE scores and other determinants of health may improve our understanding when evaluating the rationale behind adolescents’ food choices. In the current study, mixed model linear regression analyses indicated that SOFIE scores were positively associated with the intakes of cereals, dairy products, meat and eggs and fish, and with the concentrations of vitamin C, β-carotene, n-3 fatty acids, cobalamin, holo-transcobalamin and folate. An increase of one unit in SOFIE score is associated with an increase of fish consumption of 46 g/d. Similarly, an increase of one unit in SOFIE score is associated with a 4·7 % increase in EPA and DHA concentrations in blood. SOFIE scores were positively associated with all biomarkers analysed, but only with a few food groups. In the study sample, intakes of fruits, vegetables and fish were also correlated with the blood concentrations of vitamin C, β-carotene and n-3 fatty acids(Reference Vandevijvere, Geelen and Gonzalez-Gross20). Despite the associations between SOFIE scores and nutritional biomarkers as well as food intakes, it was not possible to confirm that adolescents who have health-motivated food choices will have healthier food consumption. On the other hand, it seems that health motivations are influencing food choices, which may guide health professionals to improve the efficiency of their actions.
Based on the sensitivity analyses to assess how SOFIE scores performed excluding under-reporters, we observed that SOFIE scores were negatively associated with intakes of nuts and seeds and savoury snacks (P < 0·05). The intakes of savoury snacks (P < 0·05) were lower for adolescents who underreported compared with the whole sample. Therefore, caution should be taken when interpreting these results. This may indicate that other factors may motive food choices rather than health.
As previously reported, hunger and taste are some of the most important motivations at breakfast(Reference Hallström, Vereecken and Ruiz8). Moreover, it has been established that the reasons why adolescents choose the first food to eat in the morning may vary. For school lunch, adolescents prefer taste over healthy options at the first selected food (59 %), although taste motivation reduces at the selection of the third food (41 %). In contrast, the motivation to select foods for reasons related to health increased from the first selected food (8 %) to the third selected food (24 %)(Reference Contento, Williams and Michela5). Health may not be the main motivation when adolescents choose what they eat. It is necessary to highlight the importance of assessing accurately the health motivation influencing food choices when developing public health policies. SOFIE may help identify individuals with lower health motivation when choosing foods and guide interventions.
Limitations and strengths
Limitations of this study include the inherent limitation of the GGUM 2004 software, regarding the maximum number of respondents allowed for analysis, which is 2000. In addition, the cross-sectional nature of our study cannot be used to establish causation between food intakes and/or nutritional biomarkers with motivation influencing food choices or viceversa. The study has also several strengths. The estimation of item parameters and scores presented low standard errors. The use of IRT analysis allowed including new items in SOFIE based on the items’ parameters calculated in the present analyses. GGUM may provide new insights to evaluate motivation influencing food choices, and SOFIE can be presented as a new approach to evaluate health motivation.
Conclusions
SOFIE scores, obtained using GGUM, can improve the assessment of motivation influencing food choices. The items in SOFIE showed the best discrimination performance in investigating the attitudes presented by individuals with low, indifferent or high health motivation. The associations between SOFIE scores and food intakes and nutritional biomarkers indicated that health motivation may influence healthy food intakes. This is very important for planning public policies to promote healthy food choices. SOFIE is proposed as a new measure to further study health motivation influencing food choices.
Acknowledgements
Financial support: This work was supported by the Exterior Sandwich Doctorate Program for the Coordination of Improvement of Higher Level Personnel (CAPES – Coordenação de Aperfeiçoamento de Pessoal de Nível Superior) (grant number 88881.132853/2016-01). The HELENA study took place with the financial support of the European Community Sixth RTD Framework Programme (contract FOOD-CT-2005-007034). Conflict of interest: None. Authorship: S.S.S. and C.J. analysed the data and wrote the first draft with contributions from L.A.M. All authors reviewed and commented on subsequent drafts of the manuscript. Ethics of human subject participation: This study was conducted according to the guidelines laid down in the Declaration of Helsinki, and all procedures involving study participants were approved by the responsible institution in each of the participating countries. Written informed consent was obtained from all subjects/patients.
Supplementary material
For supplementary material accompanying this article visit https://doi.org/10.1017/S1368980019004658
Appendix
HELENA Study Group
Co-ordinator: Luis A. Moreno. Core Group Members: Luis A. Moreno, Fréderic Gottrand, Stefaan De Henauw, Marcela González-Gross, Chantal Gilbert. Steering Committee: Anthony Kafatos (President), Luis A. Moreno, Christian Libersa, Stefaan De Henauw, Sara Castelló, Fréderic Gottrand, Mathilde Kersting, Michael Sjöstrom, Dénes Molnár, Marcela González-Gross, Jean Dallongeville, Chantal Gilbert, Gunnar Hall, Lea Maes, Luca Scalfi. Project Manager: Pilar Meléndez. Universidad de Zaragoza (Spain): Luis A. Moreno, Jesús Fleta, José A. Casajús, Gerardo Rodríguez, Concepción Tomás, María I. Mesana, Germán Vicente-Rodríguez, Adoración Villarroya, Carlos M. Gil, Ignacio Ara, Juan Fernández Alvira, Gloria Bueno, Aurora Lázaro, Olga Bueno, Juan F. León, Jesús Mª Garagorri, Idoia Labayen, Iris Iglesia, Silvia Bel, Luis A. Gracia Marco, Theodora Mouratidou, Alba Santaliestra-Pasías, Iris Iglesia, Esther González-Gil, Pilar De Miguel-Etayo, Cristina Julian, Mary Miguel-Berges, Isabel Iguacel. Consejo Superior de Investigaciones Científicas (Spain): Ascensión Marcos, Julia Wärnberg, Esther Nova, Sonia Gómez, Ligia Esperanza Díaz, Javier Romeo, Ana Veses, Belén Zapatera, Tamara Pozo, David Martínez. Université de Lille 2 (France): Laurent Beghin, Christian Libersa, Frédéric Gottrand, Catalina Iliescu, Juliana Von Berlepsch. Research Institute of Child Nutrition Dortmund, Rheinische Friedrich-Wilhelms-Universität Bonn (Germany): Mathilde Kersting, Wolfgang Sichert-Hellert, Ellen Koeppen. Pécsi Tudományegyetem (University of Pécs) (Hungary): Dénes Molnar, Eva Erhardt, Katalin Csernus, Katalin Török, Szilvia Bokor, Mrs. Angster, Enikö Nagy, Orsolya Kovács, Judit Répasi. University of Crete School of Medicine (Greece): Anthony Kafatos, Caroline Codrington, María Plada, Angeliki Papadaki, Katerina Sarri, Anna Viskadourou, Christos Hatzis, Michael Kiriakakis, George Tsibinos, Constantine Vardavas, Manolis Sbokos, Eva Protoyeraki, Maria Fasoulaki. Institut für Ernährungs- und Lebensmittelwissenschaften – Ernährungphysiologie. Rheinische Friedrich Wilhelms Universität (Germany): Peter Stehle, Klaus Pietrzik, Marcela González-Gross, Christina Breidenassel, Andre Spinneker, Jasmin Al-Tahan, Miriam Segoviano, Anke Berchtold, Christine Bierschbach, Erika Blatzheim, Adelheid Schuch, Petra Pickert. University of Granada (Spain): Manuel J. Castillo, Ángel Gutiérrez, Francisco B. Ortega, Jonatan R. Ruiz, Enrique G. Artero, Vanesa España, David Jiménez-Pavón, Palma Chillón, Cristóbal Sánchez-Muñoz, Magdalena Cuenca. Instituto Nazionalen di Ricerca per gli Alimenti e la Nutrizione (Italy): Davide Arcella, Elena Azzini, Emma Barrison, Noemi Bevilacqua, Pasquale Buonocore, Giovina Catasta, Laura Censi, Donatella Ciarapica, Paola D’Acapito, Marika Ferrari, Myriam Galfo, Cinzia Le Donne, Catherine Leclercq, Giuseppe Maiani, Beatrice Mauro, Lorenza Mistura, Antonella Pasquali, Raffaela Piccinelli, Angela Polito, Romana Roccaldo, Raffaella Spada, Stefania Sette, Maria Zaccaria. University of Napoli ‘Federico II’ Department of Food Science (Italy): Luca Scalfi, Paola Vitaglione, Concetta Montagnese. Ghent University (Belgium): Ilse De Bourdeaudhuij, Stefaan De Henauw, Tineke De Vriendt, Lea Maes, Christophe Matthys, Carine Vereecken, Mieke de Maeyer, Charlene Ottevaere, Inge Huybrechts. Medical University of Vienna (Austria): Kurt Widhalm, Katharina Phillipp, Sabine Dietrich, Birgit Kubelka, Marion Boriss-Riedl. Harokopio University (Greece): Yannis Manios, Eva Grammatikaki, Zoi Bouloubasi, Tina Louisa Cook, Sofia Eleutheriou, Orsalia Consta, George Moschonis, Ioanna Katsaroli, George Kraniou, Stalo Papoutsou, Despoina Keke, Ioanna Petraki, Elena Bellou, Sofia Tanagra, Kostalenia Kallianoti, Dionysia Argyropoulou, Stamatoula Tsikrika, Christos Karaiskos. Institut Pasteur de Lille (France): Jean Dallongeville, Aline Meirhaeghe. Karolinska Institutet (Sweden): Michael Sjöstrom, Jonatan R. Ruiz, Francisco B. Ortega, María Hagströmer, Anita Hurtig Wennlöf, Lena Hallström, Emma Patterson, Lydia Kwak, Julia Wärnberg, Nico Rizzo. Asociación de Investigación de la Industria Agroalimentaria (Spain): Jackie Sánchez-Molero, Sara Castelló, Elena Picó, Maite Navarro, Blanca Viadel, José Enrique Carreres, Gema Merino, Rosa Sanjuán, María Lorente, María José Sánchez. Campden BRI (United Kingdom): Chantal Gilbert, Sarah Thomas, Elaine Allchurch, Peter Burgess. SIK – Institutet foer Livsmedel och Bioteknik (Sweden): Gunnar Hall, Annika Astrom, Anna Sverkén, Agneta Broberg. Meurice Recherche & Development asbl (Belgium): Annick Masson, Claire Lehoux, Pascal Brabant, Philippe Pate, Laurence Fontaine. Campden & Chorleywood Food Development Institute (Hungary): Andras Sebok, Tunde Kuti, Adrienn Hegyi. Productos Aditivos SA (Spain): Cristina Maldonado, Ana Llorente. Cárnicas Serrano SL (Spain): Emilio García. Cederroth International AB (Sweden): Holger von Fircks, Marianne Lilja Hallberg, Maria Messerer. Lantmännen Food R&D (Sweden): Mats Larsson, Helena Fredriksson, Viola Adamsson, Ingmar Börjesson. European Food Information Council (Belgium): Laura Fernández, Laura Smillie, Josephine Wills. Universidad Politécnica de Madrid (Spain): Marcela González-Gross, Jara Valtueña, David Jiménez-Pavón, Ulrike Albers, Raquel Pedrero, Agustín Meléndez, Pedro J. Benito, Juan José Gómez Lorente, David Cañada, Alejandro Urzanqui, Rosa María Torres, Paloma Navarro.


