


Early childhood is a critical period when dietary intake patterns and eating habits are developed( Reference Skinner, Carruth and Wendy 1 – Reference Dwyer, Suitor and Hendricks 3 ). Adult caregivers play an important role in children’s socialization and in their development of behaviours, habits and attitudes, including those around food and eating( Reference Davison and Birch 4 , Reference Ritchie, Welk and Styne 5 ). Most research, however, has focused on parents, specifically their food parenting practices. Food parenting practices are parental behaviours (intentional or unintentional) that influence children’s attitudes, behaviours or beliefs around food and eating( Reference Vaughn, Ward and Fisher 6 ). This literature generally suggests that coercive practices (e.g. restriction, pressure to eat, food bribes) are associated with poorer dietary quality and eating habits, while autonomy-supporting and structure practices (e.g. encouragement, praise, nutrition education, modelling, food availability) are associated with better diet quality and eating habits( Reference Vaughn, Ward and Fisher 6 ).
In the USA, about 30 % of children under the age of 5 years are enrolled in some type of formal childcare programme, consuming up to two-thirds of their daily nutrients in this setting( 7 – 11 ). As a result, childcare providers have assumed much of the responsibility for child feeding( Reference Nicklas, Baranowski and Baranowski 12 , Reference Story, Kaphingst and French 13 ), but less is known about how their feeding practices may be shaping children’s eating habits. Studies with childcare providers suggest that they use a variety of practices, including coercive, autonomy-supporting and structure practices( Reference Ramsay, Branen and Fletcher 14 – Reference Elford and Brown 18 ). Provider feeding practices shown to promote healthier eating habits in children include sitting with children during meals( Reference Kharofa, Kalkwarf and Khoury 19 ), being enthusiastic role models( Reference Hendy 20 – Reference Ward, Blanger and Donovan 22 ), involving children in meal preparation( Reference Gubbels, Gerards and Kremers 23 ) and talking with children about healthy foods( Reference Gubbels, Kremers and Stafleu 24 , Reference Anundson, Sisson and Anderson 25 ). While the child feeding parenting literature has been used to inform the thinking around how providers’ practices might influence children’s eating habits, childcare providers may not use the same practices as parents and these practices may have a different impact on children when used in the childcare setting( Reference Vereecken, Huybrechts and Maes 26 ).
To better understand how providers’ feeding practices influence children’s dietary intakes and eating behaviours, researchers must be able to measure these practices( Reference Patrick, Hennessy and McSpadden 27 ). Unfortunately, tools assessing provider feeding practices are limited and have often relied on slightly modified parental feeding tools( Reference Dev, Carraway-Stage and Schober 28 – Reference Freedman and Alvarez 30 ). In addition, most studies conducted in childcare settings that have examined provider feeding practices have relied on single items, rather than constructs or scales, to measure these practices and assess their associations with the children’s diet( Reference Gubbels, Gerards and Kremers 23 , Reference Dev and McBride 29 ). Furthermore, while these studies advanced the assessment of provider feeding practices, they have not used a consistent theoretical framework as a guide, limiting the ability to make comparisons and conclusions across studies( Reference Vaughn, Ward and Fisher 6 ). Key characteristics of the childcare setting must be taken into consideration when trying to measure these practices or adapt existing parenting practices measures for use with providers. For example, providers’ use of feeding practices is likely influenced by the fact that they are responsible for feeding multiple children at once, and they likely also feel pressure from parents to make sure that children in their care eat a sufficient amount of food. Because of this measurement gap, the goal of the present paper was to describe the modification and validation of an existing instrument, the Environment and Policy Assessment and Observation (EPAO)( Reference Ward, Mazzucca and McWilliams 31 ), to better capture provider feeding practices. Specifically, we describe the identification of missing feeding practice constructs, development of new items and results from the psychometric testing of new scales.
Methods
The EPAO is designed to assess nutrition and physical activity environments of childcare centres using a combination of direct observation of a full day of childcare and review of formal documents( Reference Ward, Hales and Haverly 32 ). A version of this instrument was used as part of a larger cluster-randomized trial (Keys) evaluating the efficacy of an intervention designed to help family childcare home (FCCH) providers become healthy role models, provide environments to support healthy eating and physical activity in children, and implement more effective business practices( Reference Ostbye, Mann and Vaughn 33 ). An FCCH is a specific type of childcare setting that is relatively small (serving on average five children) which operates out of the provider’s own residence. Approximately 3 million children, from birth to age 5 years, are cared for by these providers( Reference Mamedova and Redford 8 ). As part of this larger study, a version of the Environment and Policy Assessment and Observation modified for the family home setting (EPAO-FCCH)( Reference Vaughn, Mazzucca and Burney 34 ) was developed and used to collect information pre- and post-intervention. The supplemental sub-study (described here) further modified this EPAO-FCCH to expand its assessment of provider feeding practices by meal time and assess the psychometric properties of these new scales.
EPAO modification
To enhance the measurement of provider feeding practices, modifications were made to the observation component of the EPAO. Specifically, additions were made to three sections: morning meal, lunch and afternoon snack. During the tailoring of the EPAO for FCCH, these sections had already been expanded to incorporate additional items assessing provider feeding practices such as role modelling, rewards, praise and encouragement( Reference Vaughn, Mazzucca and Burney 34 ) based on updated best practice recommendations for childcare( Reference Ward, Morris and McWilliams 35 , Reference Ward, Vaughn and Mazzucca 36 ). Reliability and validity of these food practice scales have also been demonstrated in studies with FCCH( Reference Vaughn, Mazzucca and Burney 34 ) and Head Start centres( Reference Fallon, Halloran and Gorman 37 ).
While these studies advanced the assessment of provider feeding practices, comparison against a comprehensive content map of parental feeding practices( Reference Vaughn, Ward and Fisher 6 ) suggested that there may be several constructs applicable to providers that were still not being assessed. This content map organizes feeding practices into three higher-order constructs: Coercive Control, Structure and Autonomy Support. Within each of these higher-order constructs, specific feeding practices are identified. ‘Coercive control practices’ reflect attempts to dominate, pressure or impose the will of the parents upon the child. ‘Structure-related practices’ reflect the consistent enforcement of rules and boundaries about eating, and the physical organization of the food environment. ‘Autonomy support practices’ provide sufficient structure within which the child can be involved in making food choices at a developmentally appropriate level, engaging in conversations with the child about reasons for rules and boundaries regarding food, and creating an emotional climate during these parent–child food interactions in which the child feels unconditionally loved, valued and accepted by parents. Using the content map, we were able to identify practices that were already well measured in the EPAO, those that were partially measured, and those that were not measured but applicable to childcare providers (Fig. 1).
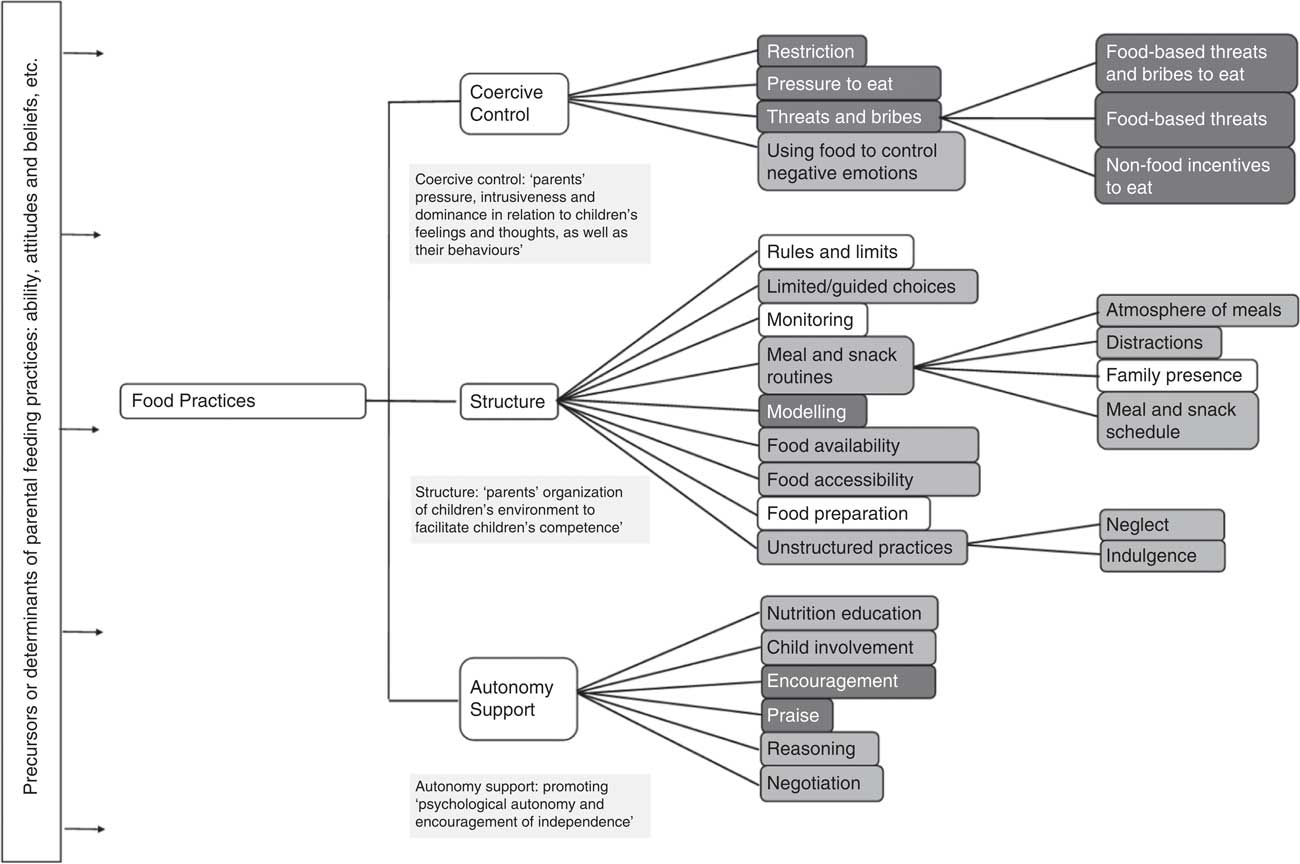
Fig. 1 Existing content map of feeding with existing and additional EPAO items: ![]() , measured by EPAO;
, measured by EPAO; ![]() , additions made by EPAO Supplemental Assessment of Feeding Practices (EPAO, Environment and Policy Assessment and Observation)
, additions made by EPAO Supplemental Assessment of Feeding Practices (EPAO, Environment and Policy Assessment and Observation)
While this content map provided a useful guide for identifying potential feeding practice constructs, we were cognizant that not all parental feeding practices would be applicable to childcare providers. To help inform our selection of the most relevant feeding practice constructs, we conducted observations in forty-eight FCCH, observing 200 meals (breakfast, lunch and snack) consumed by children( Reference Tovar, Vaughn and Fallon 38 ). These observations helped identify the feeding practices commonly used by providers as they interacted with children during meals (e.g. use of encouragement, reasoning and role modelling, as well as insistence, pressure and threats in response to children’s food refusals). At this time a literature review was also conducted to identify existing tools attempting to measure provider feeding practices and relevant items extracted( Reference Dev, McBride and Speirs 15 , Reference Hughes, Patrick and Power 39 ). In addition to the existing items (n 23), twenty-five new provider feeding practice items were identified, reviewed by research team members and added to the EPAO. Response options for all feeding items prompted data collectors to note whether the practices were not observed, observed one or two times, or observed three or more times. For each of the new items, a brief behavioural definition was also developed to facilitate data collection accuracy during observations (available upon request from the corresponding author). Face and content validity were assessed by three content area experts. These experts reviewed draft items and provided feedback on their content, relevance and potential modifications.
Pilot testing new items
To evaluate the feasibility of data collection with these new items, two pilot studies were conducted sequentially. The first pilot study involved video-recording and subsequent coding of feeding sessions in five FCCH in Rhode Island. Protocols for this pilot were approved by the Institutional Review Boards at the University of Rhode Island. FCCH providers were identified based on the list provided from the Department of Children, Youth and Families website. A recruitment visit was used to review the data collection protocol, collect provider consent, distribute parent consent letters and schedule data collection (capturing up to four meal occasions, with at least two lunches and one snack). Data collection from each FCCH was completed within three days. On the first day of data collection in each FCCH, a video recorder (Sony camcorder) was placed on a tripod stand near the table where children were eating. Set-up occurred prior to the first observed meal occasion so that providers could be shown how to use the camcorder (e.g. how to turn it on/off at the beginning and end of meals). FCCH providers were then responsible for recording all subsequent meals. Videos were then coded by A.T. (lead author) and a research assistant using the new EPAO items. These data were used to calculate the frequency of each practice across all meals and snacks for each FCCH. Video clips were also extracted from these recordings to help create a 90-min training for data collectors that could provide clear examples for all practices captured in the new EPAO items.
A second pilot study was then conducted to assess the feasibility of using the tool for real-time coding with a sample of seventeen FCCH in North Carolina, using a convenience sample of FCCH already participating in the Keys study. Protocols for this second pilot were approved by the Institutional Review Boards at the University of North Carolina at Chapel Hill, Duke University and the University of Rhode Island. EPAO data, including these new items, were collected in real time during two-day onsite visits. Prior to data collection, all data collectors were trained on the modified EPAO using the training video described above. Following data collection, an in-depth feedback session was conducted with the data collectors to inquire about any confusion about items or questions about how items should be operationalized. For six of the homes, two data collectors completed the EPAO-FCCH with new feeding practice items, thus allowing assessment of reliability. Results found that 80 % of the new items had substantial to high inter-rater agreement (κ=0·60–0·99).
Psychometric testing of provider food practice items
The EPAO Supplemental Assessment of Feeding Practices was incorporated into the follow-up data collection in the ongoing Keys study( Reference Ostbye, Mann and Vaughn 33 ). Given the timing of grant funds for this project, the final version of the tool was available for follow-up data collection with only 133 of the 166 FCCH participating in Keys. Per Keys protocols, a two-day onsite visit was conducted with each FCCH. The EPAO-FCCH and the Supplemental Assessment of Feeding Practices were completed on both days. Child dietary intake while at the FCCH (not what is consumed in their home) was also assessed on these days using the Diet Observation in Childcare (DOCC)( Reference Ball, Benjamin and Ward 40 ). According to DOCC protocol, one observer can accurately observe and record a maximum of three children. Typically, this included breakfast/morning snack, lunch and an afternoon snack. Data collectors estimated the quantity of foods and beverages served, added (i.e. second helpings), exchanged, wasted and remaining following the end of each meal and snack to calculate the total quantity served to and consumed by children. If additional detail was needed about foods or beverages served (e.g. preparation of mixed dishes), the data collector would request this information from the FCCH provider. Valid diet observation days had to capture lunch and at least one additional meal or snack, thus setting a minimum level of data required for each day given that the number of meals and snacks served can vary by FCCH and child (depending on the hours they are enrolled in care). If a child was absent or left early (before sufficient dietary data could be collected), an additional visit was conducted to repeat the diet observation for that child. DOCC data were analysed using the Nutrition Data System for Research (NDSR) software (Nutrition Coordinating Center, University of Minnesota, Minneapolis, MN, USA; http://www.ncc.umn.edu/products/) and used to calculate a daily Healthy Eating Index-2010 (HEI-2010) score( Reference Guenther, Casavale and Reedy 41 ) for each child. As per protocol, diet data for each child were first summed across the two observation days and then HEI-2010 score was calculated from this sum. HEI-2010 was designed to measure diet quality in terms of how well diets conform to the 2010 Dietary Guidelines for Americans( 42 ). The total HEI-2010 score represents the sum of twelve component scores (maximum component score shown in parentheses), including: total fruit (5), whole fruit (5), total vegetables (5), green and beans (includes dark green vegetables and cooked, dried beans and peas because intakes of these types of vegetables are furthest from the amounts recommended in the US Department of Agriculture Food Patterns) (5), whole grains (10), dairy (10), total protein food (5), seafood and plant proteins (5), fatty acids (10), refined grains (10), sodium (10) and empty calories (20). Total HEI-2010 scores can have a maximum value of 100 which indicates high diet quality( Reference Guenther, Kirkpatrick and Reedy 43 ). Prior studies have utilized the HEI-2010 to evaluate overall diets as well as specific meals for pre-schoolers and have shown that it is a valid method in this context( Reference Erinosho, Ball and Hanson 44 – Reference Romo-Palafox, Ranjit and Sweitzer 46 ). The index adjusts per 4184kJ (1000 kcal); hence it is not necessary to further adjust for the number of meals.
Data analysis
Data on provider feeding practices, which had been collected over two days and multiple meals and snacks each day, were summarized into weighted average scores. For each meal or snack, the occurrence of each food practice was originally coded as 0, 1–2 or 3+ times. For purposes of analysis, items were recoded as occurring 0, 1·5 or 3 times. To account for the different number of meals and snacks offered during the day and to account for longer meals (i.e. lunchtime), we then created a weighting factor for each ‘meal and snack occasion’, i.e. the average duration (minutes) of a meal/snack divided by the total duration for all meals and snacks that day. This weighting factor was then multiplied by the number of occurrences recorded during that meal/snack for a given food practice. Finally, these weighted occurrences at each meal and snack were summed over the entire day. For example, if there was a total of 43min of meals and snacks, the weighted daily score for one food practice such as ‘praised for eating new food’ would be calculated as follows: $\eqalignno{ & {\rm Morning}\;{\rm meal\,(}10\;\min /43\;\min {\rm )}{\times}1 \hskip-2pt\cdot\hskip-2pt 5\,({\rm times}) \cr & \quad {\plus}{\rm lunch\,(}25\;\min /43\;\min {\rm )}{\times}3\,({\rm times}) \cr & \quad {\plus}{\rm afternoon}\;{\rm snack\,(}8\;\min /43\;\min {\rm )}{\times}1\,({\rm time}){\equals}2 \hskip-2pt\cdot\hskip-2pt 28. \cr} $
This weighted daily score was calculated for each feeding practice each day, then averaged across the two observation days to obtain the weighted average score. These scores were calculated for all forty-eight feeding practices items, including the twenty-three pre-existing items and twenty-five newly developed items.
To inform an exploratory factor analysis (EFA), descriptive statistics and bivariate correlations were run on all forty-eight items. Regardless of significance levels, meaningful correlations were considered at an absolute value of r≥0·40. Consideration of redundancy of variance or the presence of multicollinearity was considered for bivariate correlations with r>0·80.
The EFA was then run with all forty-eight items included in the analysis. To allow for correlation across items and resulting factors, extraction was set for oblimin (oblique) rotation over an orthogonal structure. We also examined the Kaiser–Meyer–Olkin index, a test for sampling adequacy with values ranging from 0 to 1. The resulting index was 0·84, well above the 0·6 recommendation for sufficient interrelationship between variables required for an EFA. Bartlett’s test of sphericity was also significant with $\chi _{{(1128)}}^{2} $
=4324, P<0·001. Given that these constructs had not been tested before with childcare providers, no a priori number of factors was selected for the initial EFA. To determine the number of underlying factors inherent in the data, the initial EFA was examined using scree plots, eigenvalues greater than 1 and percentage of variance captured for each resulting factor. To determine which items loaded on specific factors a ‘simple structure’ approach was used, where the presence of a compound loading was determined if there was less than a ±0·20 β value spread across all factors. When compound loadings existed, those items were removed from the analysis. Marker loadings with absolute values≥0·40 were considered meaningful and the item was retained on its respective factor. To create the final factors, we averaged the weighted average scores from all items within that factor (sum of all item scores within each factor divided by the number of items).
$\chi _{{(1128)}}^{2} $
=4324, P<0·001. Given that these constructs had not been tested before with childcare providers, no a priori number of factors was selected for the initial EFA. To determine the number of underlying factors inherent in the data, the initial EFA was examined using scree plots, eigenvalues greater than 1 and percentage of variance captured for each resulting factor. To determine which items loaded on specific factors a ‘simple structure’ approach was used, where the presence of a compound loading was determined if there was less than a ±0·20 β value spread across all factors. When compound loadings existed, those items were removed from the analysis. Marker loadings with absolute values≥0·40 were considered meaningful and the item was retained on its respective factor. To create the final factors, we averaged the weighted average scores from all items within that factor (sum of all item scores within each factor divided by the number of items).
To test the predictive validity of the constructs, multilevel mixed-effects models were used to examine the association between the three provider feeding practices (independent variable) and child’s diet quality as captured by the HEI-2010 score (dependent variable). The three food practice variables were standardized to have a mean of 0 and an sd of 1, so their regression coefficients captured the effect on HEI-2010 score for a 1 sd difference in the practices. The models were estimated using the method of generalized estimating equations( Reference Ziegler 47 ) and models included a random intercept to account for nesting of children within FCCH. In the initial model, we included all provider feeding practices and an a priori selected set of covariates, specifically provider income, education, age, race, Child Adult Care Food Program (CACFP) participation, childcare quality rating and BMI, as well as child age, sex, BMI, hours spent in childcare and study arm (intervention v. control). Feeding practices and covariates that did not contribute significantly to the model (P<0·10) were removed in a final reduced model. After excluding missing values for the dependent and independent variables, the final model included 125 of the 133 FCCH (94 %).
Calculation of weighted average scores, descriptive analysis of feeding practice scores and reliability testing were completed in the statistical software package SAS version 9.4. The exploratory factor analysis was completed in IBM SPSS Statistics version 24. Predictive validity analysis was completed in R version 3.4.0.
Results
Of the 133 FCCH providers participating in the present study, all were female, mean age was 49·8 (sd 9·4) years, 71·8 % were African American, 72·1 % had an associate or college degree, and 91·6 % of their FCCH participated in CACFP. Of the participating children, 49·3 % were female and their mean age was 3·3 (sd 1·2) years. This is similar to FCCH providers nationally in that most are female and most participate in CACFP( Reference Morrissey and Banghart 48 ).
Frequency of feeding practices
When looking at simple presence v. absence, the positive feeding practices most frequently observed (seen in 90 % or more of homes) included: encouraging children to try the foods on their plates (96·2 %), talking with children about the foods they were eating (96·0 %), using appropriate size plates (94·6 %), not having a television that can be seen or heard during meals/snacks (93·1 %), making fruits and vegetables easier to eat (92·4 %) and having pleasant non-food conversations during meals/snacks (90·8 %; Table 1). The positive feeding practice least frequently observed (seen in less than 15 % of homes) included allowing children to serve themselves most/all food (0·0 %). The most common negative feeding practices included: enforcing table manners (88·6 %), rushing children to eat (56·5 %), when a child ate less than half of a meal or snack, the provider removed the plate without asking the child if s(he) was full (54·1 %) and ignoring or showing indifference to the children during the meal (49·6 %). The least frequent negative feeding practices included: eating unhealthy foods and beverages in front of children (i.e. sweet snacks (1·9 %), fast food (3·1 %), salty snacks (5·7 %) and sugary beverages (11·3 %)), using food as a reward/bribe (6·3 %) or to calm children’s emotions (10·7 %) and requiring the child to sit at the table until the plate is clean (10·7 %).
Table 1 Frequency of new and existing food practices assessed using the modified Environment and Policy Assessment and Observation (EPAO) instrument in 133 family childcare homes (FCCH) in Rhode Island and North Carolina, USA
* Denotes new item (from additional twenty-five) on the EPAO Supplemental Assessment of Feding Practices.
† Lead in to these questions is ‘How often did the provider…?’
Exploratory factor analysis
Scree plots indicated the potential for either a four- or five-factor solution. However, examination of the four- and five-factor solutions showed meaningful loadings on only three factors. Hence, a final three-factor solution was examined for goodness-of-fit ( $\chi _{{(987)}}^{2} $
=1593·6, P<0·001). Factor 1 appeared to capture ‘coercive control and indulgent feeding practices’ and emerged with nineteen items and loadings ranging from 0·92 to 0·57. Factor 2 appeared to capture ‘autonomy support practices’ and included ten items with factor loadings ranging from 0·68 to 0·40. It should be noted that one of the items had a low loading below the 0·40 cut-off (reason with children=0·397) but given its theoretical consistency with the factor, it was retained. Factor 3 appeared to capture ‘unhealthy role modelling’ and included four items with loadings ranging from 0·82 to 0·60. The final three-factor solution captured 43 % of total variance. Eigenvalues for the three factors were 13·84 for ‘coercive control/indulgent practices’, 3·94 for ‘autonomy support practices’ and 2·73 for ‘unhealthy role modelling’ (Table 2). Correlations among factors ranged from 0·20 to 0·46 (factor 1 and factor 2, r=0·46; factor 1 and factor 3, r=0·33; factor 2 and factor 3, r=−0·20). Approximately half of the homes (50·4 %) had a ‘high’ autonomy supportive score that was above the median (0·59); 7·0 % had a ‘high’ unhealthy role modelling score based on the median split (1·0) and more than half (40·9 %) had a ‘high’ coercive controlling score based on the median split (2·7).
$\chi _{{(987)}}^{2} $
=1593·6, P<0·001). Factor 1 appeared to capture ‘coercive control and indulgent feeding practices’ and emerged with nineteen items and loadings ranging from 0·92 to 0·57. Factor 2 appeared to capture ‘autonomy support practices’ and included ten items with factor loadings ranging from 0·68 to 0·40. It should be noted that one of the items had a low loading below the 0·40 cut-off (reason with children=0·397) but given its theoretical consistency with the factor, it was retained. Factor 3 appeared to capture ‘unhealthy role modelling’ and included four items with loadings ranging from 0·82 to 0·60. The final three-factor solution captured 43 % of total variance. Eigenvalues for the three factors were 13·84 for ‘coercive control/indulgent practices’, 3·94 for ‘autonomy support practices’ and 2·73 for ‘unhealthy role modelling’ (Table 2). Correlations among factors ranged from 0·20 to 0·46 (factor 1 and factor 2, r=0·46; factor 1 and factor 3, r=0·33; factor 2 and factor 3, r=−0·20). Approximately half of the homes (50·4 %) had a ‘high’ autonomy supportive score that was above the median (0·59); 7·0 % had a ‘high’ unhealthy role modelling score based on the median split (1·0) and more than half (40·9 %) had a ‘high’ coercive controlling score based on the median split (2·7).
Table 2 Results of the exploratory factor analysis of the modified Environment and Policy Assessment and Observation (EPAO) instrumentFootnote *,Footnote †,Footnote ‡
* Extraction method: maximum likelihood.
† Rotation method: oblimin with Kaiser normalization (oblique).
‡ Loadings above 0·40 are in bold.
Reliability (following exploratory factor analysis)
Each of the three factors demonstrated good internal consistency (Cronbach’s α>0·70). Values were as follows: ‘coercive control/indulgent practices’, α=0·97; ‘autonomy support practices’, α=0·78; and ‘unhealthy role modelling’, α=0·86 (Table 2).
Predictive validity of provider feeding practices on children’s diet quality
Children in this sample had an average diet quality, as demonstrated by a mean HEI-2010 score of 58·8 (sd 10·49). Correlations between HEI-2010 scores and each of the factors were as follows (factor 1 and HEI-2010, r=0·065; factor 2 and HEI-2010, r=0·07; factor 3 and HEI-2-10, r=0·29). Multilevel mixed-effects models found some significant associations between provider feeding practices and children’s diet quality. In the initial model (including all feeding practices), ‘coercive control/indulgent practices’ and ‘unhealthy role modelling’ were not significant. In addition, the covariates provider income, education, age, CACFP participation, quality rating and BMI, as well as the covariates child age and BMI, were not contributing significantly to the model. Hence, these were removed in the final reduced model. In the final model (Table 3), ‘autonomy support practices’ remained significantly associated with children’s HEI-2010 scores. A 1-unit increase in the use of ‘autonomy support practices’ was associated with a 9·4-unit increase in child HEI-2010 score. The covariates provider race, child sex, hours spent in child care and study arm, and the other two feeding constructs were also retained in the final model.
Table 3 Reduced multivariable regression results examining the association between provider food practices and child Healthy Eating Index-2010 score in 133 family childcare homes in Rhode Island and North Carolina, USA
Discussion
Little is known about how childcare providers’ feeding practices influence the diet and eating habits of young children in their care. This gap in knowledge is due in part to a lack of robust and comprehensive measurement tools, which we have tried to address in the present study using a sample of FCCH providers. Through our study, we identified feeding practices that were missing from current measurement tools, developed new items to capture these feeding practices and conducted psychometric testing with new items and scales. Results suggest that FCCH providers use a myriad of feeding practices while interacting with children during meal and snacks, and providers’ use of autonomy-supportive practices is associated with higher diet quality in children. Future studies should continue to examine the use and impact of provider feeding practices, especially in different types of childcare settings (e.g. childcare centres, Head Start centres). Although our data are cross-sectional and the causal direction of the associations cannot be established, results suggest that interventions aimed at increasing providers’ use of autonomy-supportive practices may be a promising strategy for encouraging healthier eating habits in young children.
Providers’ use of feeding practices
Our findings suggest that childcare providers use a variety of feeding practices, both positive and negative, which is consistent with previous literature in childcare. Similar to what providers report in qualitative studies, we observed that most childcare providers use positive feeding practices such as encouraging children to try new foods, providing nutrition education, creating a positive meal atmosphere and sitting with children during meals( Reference Lindsay, Salkeld and Greaney 49 , Reference Vandeweghe, Moens and Braet 50 ). However, other positive feeding practices considered as best practice and promoted in childcare standards of practice( Reference Benjamin Neelon and Briley 10 , 51 ) were observed less frequently, such as enthusiastically role modelling or assessing children’s hunger before serving seconds.
There was also variation in the negative practices observed. For example, insisting children eat certain foods or spoon-feeding children appeared to be common practice. However, pressuring children to eat more food than they wanted, using food as a bribe to eat less preferred foods and modelling of unhealthy foods were not observed as frequently, which is consistent with past self-reported feeding practices of childcare providers( Reference Ramsay, Branen and Fletcher 14 , Reference Anundson, Sisson and Anderson 25 , Reference Fallon, Halloran and Gorman 37 , Reference Elford and Brown 52 , Reference Maalouf, Evers and Griffin 53 ). Overall, the findings from the present study offer further evidence that there continues to be room for improvement in the feeding practices being used in childcare settings( Reference Dev, McBride and Speirs 15 , Reference Martyniuk, Vanderloo and Irwin 16 ).
Factors emerging from analysis
The present study’s EFA helps advance our understanding of how to conceptualize feeding practices in the childcare setting. Few previous childcare-based studies have used EFA to identify scales being measured by their instruments( Reference Gubbels, Sleddens and Raaijmakers 54 ). Results from our EFA suggested three factors: ‘coercive control/indulgent practices’, ‘autonomy support practices’ and ‘unhealthy role modelling’.
‘Coercive control/indulgent practices’ had the largest number of items as well as the highest eigenvalue and percentage of variance, although less than half of the providers had a high score. The practices included within this factor were consistent with both coercive controlling practices (e.g. using pressure, bribes and rushing child to eat) and with practices that are more permissive in nature (e.g. ignoring a child, talking on a cell phone or texting during the meal). Both types of practice may interfere with a provider being able to effectively engage with a child during meals and to help support her/his development of internal cues of satiety and hunger. The loading of items within what has been described as a higher-order factor is consistent with the recently developed content map for food parenting practices( Reference Vaughn, Ward and Fisher 6 ) although instead of two higher-order constructs, we observed only one. It is possible that within the childcare setting, where a provider is interacting with multiple children at one time, the type of permissive practices used are somewhat different from the practices used by a parent in the home setting.
The second factor, which captured ‘autonomy support practices’, was consistent with another higher-order construct described in the content map. Items loading on this factor assessed talking with children about foods they are eating (informal nutrition education), encouraging and praising children for trying new foods and role modelling healthy eating. Approximately half of the providers had a high autonomy supportive score.
Interestingly, the third factor captured more a specific practice rather than a higher-order construct, specifically ‘unhealthy role modelling’ including foods such as fast food, sweets and salty snacks. Although these practices were not high in frequency and very few providers had a high score, they appear to be an important construct within this context.
Overall, the factor structure of provider feeding practices appears to be very consistent with that of the parenting literature in that coercive controlling practices come together into one factor as do autonomy-supportive practices( Reference Yee, Lwin and Ho 55 , Reference Shloim, Edelson and Martin 56 ), although the exact terminology to name the factors may vary. A key difference is that the higher-order construct of structure did not emerge as a factor in our data. A few of the items intended to measure structure-related practices (e.g. enthusiastic role modelling of healthy foods, pleasant non-food conversations) loaded on the autonomy support factor instead. Other structure-related practices (e.g. having healthy foods visible (accessibility), letting child choose between healthy options (guided choices), talking/texting during meals (distractions during meals)) failed to load well on any factor. It is possible that because there is some inherent structure already in place in a childcare setting, these structure-related practices may not be as relevant as in the home setting. There were also several structure-related practices, such as monitoring and having rules and limits, that were not assessed because they were viewed as less relevant in the childcare environment.
Influence of providers’ feeding practices on children’s diet quality
In testing the predictive validity of the provider practices with child diet quality in FCCH, we found that ‘autonomy support practices’ was the only factor significantly associated with higher HEI-2010 score. Many of the practices captured by individual items have been shown to be associated with higher food acceptance or healthier food intakes; for example, enthusiastically role modelling, talking with the children about the foods they are eating, sitting with the children and using reasoning are associated with healthier foods, consistent with other studies conducted in childcare centres( Reference Kharofa, Kalkwarf and Khoury 19 , Reference Gubbels, Gerards and Kremers 23 – Reference Anundson, Sisson and Anderson 25 ). Our results advance the field by not only considering individual feeding practices but rather by examining how a group of practices/constructs can influence diet quality. Our findings are also consistent with the parenting literature in that supportive practices, such as parents’ use of an authoritative style, may allow children to better regulate their internal cues of satiety and hunger and hence have healthier diet quality and weight status( Reference Ward, Blanger and Donovan 22 , Reference Yee, Lwin and Ho 55 ). It is possible that in a childcare setting the use of autonomy-supportive practices is associated with diet quality while other practices are not, due to the setting. Unlike the home setting, children in childcare may respond more positively to certain practices while being less influenced by others. For example, in the home setting children may be less responsive to their primary caregiver’s use of supportive practices given the less structured setting, while in childcare they may be expected to listen and respond given the group setting.
Strengths, limitations and lessons learned
The present study had many strengths including a thorough process to modify an existing tool that included expert review and two pilot studies, creation and use of videos to train data collectors, and assessment of provider feeding practices and child diet intake via direct observation. There are, however, some limitations. In our efforts to be parsimonious in adding items into an observation protocol, we may have not fully captured all possible practices that impact child diet quality in this setting. For example, some feeding practices were captured with a single item (e.g. offering encouragement to try new foods, involving the child in meal preparation, distractions like texting during meals). The brevity with which some practices were measured may have contributed EFA results that seemed to identify more of these overarching constructs rather than distinct practices. Use of items loading significantly on only one of the three factors might overlook some important practices. We found three items that did not load on any factors but were significantly correlated to HEI-2010 score (i.e. encourage children to sit at the table, healthy foods are visible to children in the home, use of appropriate child size plates). Another challenge when measuring feeding practices was the need to standardize our scoring to account to variation in length of the childcare day and number of meals and snacks eaten at childcare. Our weighting of feeding practices based on time spent in eating occasions was an attempt to create this standardization, but alternative methods could be considered such as weighting based on eating occasion as a meal v. snack. Another limitation of the study is its reliance on the larger ongoing intervention trial for our sample and data collection. These FCCH are but a sample of FCCH in the area( Reference Johnson 58 ). FCCH willing to participate in an intervention study may represent a unique subset of FCCH, which may limit generalizability. In addition, it is possible that the intervention homes may have changed their feeding practices from baseline to follow-up; however, we controlled for this in our analysis. Future studies with larger samples should continue to explore how items that capture more environmental aspects might fit into other constructs. Finally, our results may not be generalizable to other childcare settings; FCCH are a specific type of childcare whereby a provider takes care of children in his or her home and may differ from a childcare centre, where the number of children and the policies that are in place may differ and have an impact on mealtime interactions.
Conclusions
Similar to the parenting literature, constructs which describe coercive controlling practices and those that describe autonomy-supportive practices emerged. We found that childcare providers’ use of autonomy-supportive practices in FCCH was associated with a higher HEI-2010 score. Similar to the parenting literature there is a continued need for efforts that focus training and education on positive practices rather than just eliminating negative ones such pressure and rewards(58). Given that diets of pre-schoolers in the USA continue to be suboptimal, teaching childcare providers about what they can be doing instead of what they should not be doing may help improve the children’s diet quality.
Acknowledgements
Acknowledgements: The authors would like to thank Megan Fallon for her assistance with coding the videos and for her contribution to the literature review. They would also like all participants who contributed to this study. Financial support: This work was supported by the National Institutes of Health, Bethesda, MD, USA (grant number R01HL108390) and early career diversity grant funds (A.T., grant number 3R01HL108390-03S1). The funders had no role in the design, analysis or writing of this article. Conflict of interest: None of the authors have any conflict of interest to disclose. Authorship: All authors contributed to the various stages of this study. A.T. contributed to the study design, performed some of the statistical analyses and drafted the manuscript. A.E.V. and S.E.B.N. contributed to the study design and helped draft the manuscript. T.O. and J.O.F. participated in discussion of the study design and revised the manuscript. K.W. conducted the exploratory factor analysis and helped revise the manuscript. T.L. conducted the multilevel analysis and helped revise the manuscript. R.B. helped manage data collection and read the manuscript. D.S.W. conceived of the initial idea for the study, contributed to the study design, revised the manuscript and contributed especially to the intellectual content. All the authors read and commented on the drafts and approved the final version for submission. Ethics of human subject participation: This study was conducted according to the guidelines laid down in the Declaration of Helsinki and all procedures involving human subjects were approved by the Institutional Review Board at the University of Rhode Island (first pilot study) and the Institutional Review Boards at the University of North Carolina at Chapel Hill, Duke University and the University of Rhode Island (second pilot study). Written informed consent was obtained from all subjects.


