


Introduction
The prevalence of non-communicable diseases (NCDs) such as diabetes and cardiovascular diseases has been increasing worldwide, and one of the factors reported to significantly influence their development is an unhealthy diet(1,2) . Therefore, it is necessary to improve dietary habits. Dietary intake at the population level has been regularly monitored in many countries using various dietary assessment methods, such as a dietary record, 24-h recall, and food frequency questionnaire (FFQ)(Reference Patel, Pho and McDuffie3–Reference Venables, Roberts and Nicholson8). The biggest challenge to a successful national nutrition survey is ensuring the representativeness of the sample population and accuracy of the collected data(Reference Ishikawa, Yokoyama and Takimoto9,Reference Huybrechts, Aglago and Mullee10) .
The National Health and Nutrition Survey in Japan is a nationally representative cross-sectional annual survey for more than 70 years (with the exception of 2020 and 2021 because of the restrictions imposed during the COVID-19 pandemic), and conducted by local public health centres under the supervision of the Ministry of Health, Labour, and Welfare(11). Details of the survey design have been described elsewhere(11,Reference Ikeda, Takimoto and Imai12) . Briefly, the NHNS consisted of a physical examination, a dietary survey, and a lifestyle questionnaire. Participants included households with family members aged ≥1 year in the 300 unit-blocks (approximately 5,700 households and 15,000 individuals) that were randomly selected from the unit-blocks of the Comprehensive Survey of Living Conditions, except for 2012 and 2016, when an expanded survey (approximately 23,750 households and 61,000 individuals) was conducted. However, the NHNS participants consist of more older adults (approximately 45%)(11), and it has been questioned whether these results can be representativeness of the national population.
Although the NHNS assessed household dietary intake rather than individual intake using dietary record for 1–3 d until 1994, individual dietary intake has been assessed since 1995, using one-day semi-weighed household dietary records by applying the proportion of foods shared among family members to estimate individual intakes(11). To explain in detail the current dietary record, the main recordkeepers (members who usually prepared meals in household) weighed and recorded not only all foods and beverages consumed by each household member but also the food waste and leftovers. Additionally, the main recordkeepers recorded the approximate proportions of food consumed by each household member when members shared foods. When family members are eating out and cannot measure their meals, the recordkeepers asked them for the portion size or quantity of foods consumed and any leftovers. These tasks are labor-intensive for recorders (especially those from multiple-member households and/or working age people) to report the dietary intake of each household member, as well as investigators who check the records. This is also one of the reasons why the participation rate in Japan is declining(13), as evidenced in other countries(Reference Ahluwalia, Dwyer and Terry14,Reference Ax, Warensjö Lemming and Becker15) , and one solution would be to reduce the participant burden by shortening the time required to report dietary intake(Reference Koch, Conrad and Hierath16,Reference Solbak, Robson and Lo Siou17) . Thus, it is important to regularly evaluate and revise the dietary assessment methods used in national surveys to reduce respondent burden, thereby increasing participation and improving the accuracy of the estimation of dietary information(Reference Gazan, Vieux and Mora18).
Another important issue is that, as mentioned above, the NHNS currently only assesses one-day dietary intake, making it unsuitable for use in comparing population habitual intake status with dietary reference intake (DRIs)(19); for assessment of nutrient intake inadequacy. Developing assessment methods of habitual nutrients intake is needed which complements the current dietary assessment method of estimating daily intake with reduced participant burden(Reference Schröder, Covas and Marrugat20). Also, in many nutritional epidemiological studies, the relationship between dietary intakes and health outcomes has been investigated because diet is one of the major lifestyle-related risk factors(Reference Shim, Oh and Kim21). However, it is not possible to assess the association between individual health status as measured by the NHNS Japan blood tests (complete blood count and blood biochemistry) and the intake of nutrients and foods assessed by NHNS, because it is inappropriate to assess the one-day dietary intake and health status(11). Therefore, there is an urgent need for a review of dietary assessment methods that can serve as a complementary to the current one-day dietary record in the NHNS that can provide further evidence on the adequacy of nutrient intakes and can generate habitual intake to assess the relationship to health outcomes.
Questionnaire-based dietary assessment methods, such as FFQs and dietary history questionnaires, are widely used because they can be easily administered and assess habitual dietary intake over an extended period (a month or year)(Reference Willett22). However, given that dietary habits vary among regions/countries and cultures(Reference Cade, Thompson and Burley23,Reference Wakai24) , FFQs and dietary history questionnaires that are appropriate for the target population should be used(Reference Teufel25). Several reviews have been conducted to identify dietary assessment questionnaires that can be used in epidemiological studies(Reference Sierra-Ruelas, Bernal-Orozco and Macedo-Ojeda26–Reference Cui, Xia and Wu28); however, for dietary intake status, most studies have focused on the ability to rank individual dietary intakes (where they are located in the quartile). Only a few studies have focused on the ability to estimate intake at group level (group mean intake), which is frequently used to report the overall picture in national nutrition surveys(11,29) . Thus, it is essential to review the existing dietary questionnaires that can be used in the NHNS to assess the current Japanese diet, including intake at group level.
Previous reviews have summarised findings on the basis of reported articles rather than summarizing the characteristics of each questionnaire separately(Reference Wakai24,Reference Saravia, Miguel-Berges and Iglesia27,Reference Ayoubi, Yaghoubi and Pahlavani30,Reference Kameda and Sudo31) , making it challenging to compare the features and utility of each questionnaire. This is because the medians or mean values of the statistics (e.g. correlation coefficients) may be influenced by the number of reported articles rather than by the characteristics of the questionnaire itself. A Scoping review is considered appropriate to identify the existence of validated FFQs and dietary history questionnaires that can be used in the NHNS.
In addition, it is extremely important to evaluate the quality of each article in review. To evaluate the quality of reviews on dietary assessment methods, the EURopean micronutrient RECommendations Aligned Network of Excellence (EURECCA), which was established as a tool for evaluating the quality of studies validating FFQ and adopted in review studies to evaluate the quality of the dietary intake validation studies(Reference Cui, Xia and Wu28,Reference Ayoubi, Yaghoubi and Pahlavani30) , is best suited(Reference Serra-Majem, Frost Andersen and Henríque-Sánchez32).
Further, reference methods for FFQ validation studies include studies using 24-h recalls and dietary records which are able to provide detailed dietary information, and biomarker-based studies. Validating questionnaires using biomarker studies are more objective and used as ‘gold standard’, but only a limited number of nutrients is available as recovery biomarkers(Reference Cade, Thompson and Burley23). On the one hand, 24-h recalls and dietary records are recommended as reference methods when examining the validity of the assessment of various nutrients using the FFQ and dietary history questionnaire at once(Reference Cade, Thompson and Burley23).
Therefore, the purpose of this scoping review was to identify dietary assessment questionnaires that have been validated against the 24-h recall or dietary record methods and can thus be used in the Japanese NHNS. This review may serve as a reference for future studies that also intent to explore dietary assessment tools used for assessing dietary intake among specific representative populations in other countries.
Methods
The review protocol was drafted based on the methodology and guidance for the conduct of systematic scoping reviews(Reference Peters, Godfrey and Khalil33) and the Preferred Reporting Items for Systematic Reviews and Meta-Analyses (PRISMA) — Scoping Review Extension(Reference Tricco, Lillie and Zarin34).
Data source and search strategy
A search was conducted to locate published studies from inception to May 31, 2022, using three databases (PubMed/Medline, Web of Science, and ‘Ichushi [Japanese database of health and medical science articles]’). The search was supplemented by a manual search of the reference lists of the included articles. To identify the FFQs or dietary history questionnaires that have been validated against a reference method (dietary record or 24-h recall methods) and that can assess dietary intake in the Japanese population, we included words related to ‘Japanese’, (‘FFQ’ or ‘dietary history questionnaire’), (‘dietary record’ or ‘24-h recall’), and ‘validation’. Detailed terms are shown in Supplementary Table 1.
Inclusion and exclusion criteria
The inclusion criteria in this scoping review were manuscripts that 1) are peer-reviewed original research articles (full-text); 2) are published in English or Japanese; 3) describe studies conducted among the Japanese population; and 4) validate the daily intake of nutrients or food groups against a dietary record or 24-h recall.
We excluded the following references: 1) reviews, conference proceedings, and other non-original papers; 2) studies exclusively conducted among Japanese individuals living in foreign countries; 3) studies on animals; 4) no access to the full-text article; 5) studies involving only infants under 1 year of age (because the NHNS does not include participants under 1 year of age(11)); 6) studies involving only those who consume special diets, such as liquid diets; 7) studies assessing validity using only biomarkers; 8) studies in which the time interval between the conduct of questionnaires and reference methods exceeded 1 year; 9) studies examining the validity of specific nutrients or food groups (rather than the whole diet); 10) questionnaires assessing the intake of nutrients or food groups not reported in the NHNS; and 11) studies conducted among a specific population (e.g. students and parents attending a single school or university, athletes, only pregnant women in hospitals) rather than the general population.
Selection of articles
After the search, all records retrieved from the relevant databases were exported to Microsoft Excel and duplicates were removed. The selection of articles was conducted in two steps. In Step 1, two researchers of the review team (M.M., X.Y., F.O., and R.A.) independently screened titles and abstracts for eligibility, and disagreements were resolved through consultation with a third reviewer (K.M.). Subsequently, the full texts of the articles extracted from the title and abstract screening were screened by a member of the review team, and one member’s perusal results were reviewed by another member of the review team. Additionally, the two researchers of the review team manually searched the reference lists of review articles to identify additional articles. Of the articles excluded from Step 1, those that evaluated validation of the nutrients or food groups not reported in the NHNS were re-evaluated and advanced to Step 2, even though they were found not to have been validated for the whole diet.
In Step 2, two members of the review team independently reviewed all articles and selected main articles according to the following three priorities: 1) studies involving healthy Japanese adults; 2) studies evaluating validity in terms of both nutrients and food groups reported in the NHNS in the same population (if the validity in terms of both nutrients and food groups was not evaluated in a single article, each article was considered as a main article); and 3) studies with the earliest publication date, if the validation of nutrients and food groups intakes was evaluated in multiple populations using the same method. In addition, articles other than those identified were included as additional articles (e.g. articles reporting validity in other populations, such as older adults or children in a unique life stage, and in terms of other nutrients). Disagreements were resolved through consultation with the third reviewer. The reason for implementing Step 2 is that some of the validation study articles evaluated several nutrients in a small group of people of some different ages from the first validation study article. If all these articles were included in the review, the number of validation study articles on the questionnaire could affect the evaluation. Therefore, we decided to classify main papers and additional articles according to the above criteria.
Data extraction and synthesis
Independent data extraction from each article was conducted by a review team member using a standardized table (Excel sheet) specifically developed for synthesis in this review. The following data were extracted: 1) journal information including publication year and first author; 2) participant characteristics including sex, age, and sample size; 3) survey name (if any); 4) characteristics of the questionnaires including name (abbreviations, if any), reference period, tool type (paper or web-based), administration method (self-administered or interview), number of food items, and time required for completion; and 5) details of validation studies. In addition, for detail of validation studies, the following data were extracted: a) survey year; b) reference dietary assessment method; c) number of days’ intake assessed using the reference method; d) order of implementation of questionnaire and reference dietary assessment method; e) whether the reference method was properly conducted by nutrition experts (e.g. probing for additional or missing information after collection of dietary records); f) statistics employed to assess validity between questionnaires and reference methods for energy, nutrients, and food groups — including energy adjustment method in mean value calculation, type of correlation coefficient (CC) used (Pearson or Spearman), CC adjustment method (crude, adjusted such as for energy, or deattenuated or intraclass), CC value, and agreement (classification or Bland–Altman plot). Additionally, intake at the group level (mean or median) was extracted from only main articles.
For nutrients, we sorted our data according to the nutrients reported in the NHNS(11); however, if additional articles reported on validity in terms of only nutrients not reported in the NHNS, they were also sorted. For food groups, we sorted the major categories of food groups (i.e. Grains; potato; sugar and sweeteners; beans; seeds and nuts; vegetables; fruits; mushrooms; seaweed; fish and shellfish; meat; egg; dairy; fat and oils; confectionaries; beverages; seasonings; and spices) reported in the NHNS, and food groups that may require monitoring because they are reported to have a significant effect on the development of NCDs and death, which include red meat, processed meat, and milk(2). Additionally, as rice is a staple food of the Japanese population, accounting for approximately 75% of grain intake(13), rice was added to the sorted list.
Using the extracted information, for the identified main articles, the percentage difference in mean or median intake for each questionnaire was calculated using the following formula:
(mean or median dietary intake calculated by questionnaires — mean or median dietary intake calculated by reference methods)/mean or median dietary intake calculated by reference methods × 100.
We also counted the number of nutrients within ± 20% of the difference in the mean or median intake in the main studies as per the criteria used in previous studies(Reference Lombard, Steyn and Charlton35,Reference Luevano-Contreras, Durkin and Pauls36) . Furthermore, for the identified main articles, we calculated the means of the CCs for all nutrient (only reported in the NHNS) or food group intakes (reported in the NHNS or that have a significant influence on the global burden of disease and mortality(2)) for each questionnaire selected in this study.
Quality assessment
All articles were independently evaluated for quality by two members of the review team. Study quality was assessed using a modified version of the EURRECA(Reference Serra-Majem, Frost Andersen and Henríque-Sánchez32), with some modifications to fit the purpose of this review. The reason for using the modified version for quality assessment in this review is that the original version was specific to dietary assessment of micronutrient intake(Reference Serra-Majem, Frost Andersen and Henríque-Sánchez32), whereas the present study covered all nutrients. The quality assessment included the following five domains: 1) sample and sample size; 2) statistics used to assess validity; 3) data collection; 4) seasonality; and 5) supplements.
For the first two domains, the original criteria were used: 1) sample (0.5 points when the sample was not homogeneous for characteristics such as sex and age) and sample size (0.5 points when the sample size exceeded 100) and 2) statistics used to assess validity for three items: a) comparison means, medians, and differences between two methods (1 point), b) correlation between two methods (crude [0.5 points], energy-adjusted [1 point], or deattenuated or intraclass [1.5 points]), and c) assessment for agreement or misclassification (0.5 points).
For data collection, the original criterion “face to face interview(Reference Serra-Majem, Frost Andersen and Henríque-Sánchez32) was further strengthened and scored in the following two categories: 1) the accuracy was set at 1 point when the content of dietary assessments was verified by a nutritionist or nutrition expert, because it has been reported that most questionnaires are designed to be self-administered and that the differences between self-administration and interview methods vary among nutrients(Reference Cade, Thompson and Burley23); 2) the order of implementation of questionnaires and reference dietary assessment methods was added as a criterion because it has been reported that a validity study can be conducted more accurately if the reference dietary assessment method is conducted after the questionnaire (0.5 points when the questionnaire was conducted before the reference dietary assessment method)(Reference Cade, Thompson and Burley23).
Seasonal difference in intake have been reported for certain nutrients and food groups, such as vitamin C and potato, but many nutrients have no significant effect when validity is examined over a single season as opposed to over an entire year(Reference Fahey, Sasaki and Kobayashi37). Therefore, seasonal differences were not considered in this review, which focuses on nutrients as a whole, not just micronutrients. Moreover, in terms of the supplements domain, we decided not to adopt it as a criterion in the present study, because the nutrient content of supplements is not listed in the Japanese Food Composition Tables and it is difficult to accurately capture nutrient intake from supplements. The highest and lowest quality score was six and zero, respectively.
The quality of each study was considered as poor (< 2 points), acceptable (2 to < 3 points), good (3 to < 4 points), and excellent (≥ 4 points) in a modified version based on previously reported criteria(Reference Serra-Majem, Frost Andersen and Henríque-Sánchez32). If two or more questionnaires were validated using the same method (e.g. participants, reference dietary assessment method, etc.) within a single article, they were presented as results of a single article review.
Results
Study selection
Figure 1 shows the results of the study selection. A total of 409 articles were extracted from three electronic databases. After excluding duplicates (n = 96) and articles which did not meet the inclusion criteria from the titles and abstracts (n = 239), 74 articles (37 questionnaires) were subjected to full-text reading (Steps 1 and 2). In Step 1, articles that did not meet the inclusion criteria were excluded (n = 56; 27 questionnaires); however, articles that validated the nine questionnaires that proceeded to Step 2 were re-added (n = 7) and additional articles that were found through hand searching were also added (n = 7, including another questionnaire). As a result, 32 articles(Reference Tokudome, Goto and Imaeda38–Reference Maruyama, Kokubo and Yamanaka69) which evaluated the validity of the following 11 questionnaires were included in this scoping review: ‘47-item short food frequency questionnaire (47-item FFQ)’(Reference Tokudome, Goto and Imaeda38–Reference Imaeda, Goto and Sasakabe41), ‘self-administered diet history questionnaire (DHQ)’(Reference Sasaki, Yanagibori and Amano42–Reference Fujiwara, Murakami and Sasaki45), ‘brief-type self-administered diet history questionnaire (BDHQ)’(Reference Kobayashi, Murakami and Sasaki43–Reference Asakura, Haga and Sasaki48), ‘Meal-based Diet History Questionnaire (MDHQ)’(Reference Murakami, Shinozaki and Kimoto49–Reference Murakami, Shinozaki and Livingstone51), ‘FFQ in JACC’(Reference Ogawa, Tsubono and Nishino52,Reference Date, Fukui and Yamamoto53) , ‘44-item food frequency questionnaire (JPHC FFQ at baseline)(Reference Tsubono, Sasaki and Kobayashi54,Reference Tsubono, Kobayashi and Sasaki55) ’, ‘JPHC FFQ at 5-year follow-up (JPHC_5y)’(Reference Tsugane, Kobayashi and Sasaki56–Reference Mori, Sawada and Ishihara64), ‘66-item food frequency questionnaire for JPHC-NEXT follow-up survey short-FFQ (Short-FFQ JPHC-NEXT)’(Reference Yokoyama, Takachi and Ishihara65), ‘food frequency questionnaire for JPHC-NEXT follow-up survey long-FFQ (FFQ in JPHC-NEXT)’(Reference Yokoyama, Takachi and Ishihara65–Reference Kato, Takachi and Ishihara67), ‘short version of the Shizuoka Prefecture version of the Food Intake Frequency Questionnaire (Short-version FFQ)’(Reference Akahori, Nagata and Hioki68) and ‘food frequency questionnaire (Maruyama FFQ)’(Reference Maruyama, Kokubo and Yamanaka69). In Steps 2, 14, and 18, articles were classified as main articles(Reference Tokudome, Goto and Imaeda38,Reference Imaeda, Goto and Sasakabe41,Reference Kobayashi, Murakami and Sasaki43,Reference Kobayashi, Honda and Murakami44,Reference Murakami, Shinozaki and Kimoto49–Reference Ogawa, Tsubono and Nishino52,Reference Tsubono, Kobayashi and Sasaki55–Reference Sasaki, Kobayashi and Tsugane57,Reference Yokoyama, Takachi and Ishihara65,Reference Akahori, Nagata and Hioki68,Reference Maruyama, Kokubo and Yamanaka69) and additional articles(Reference Nakahata, Takada and Imaeda39,Reference Watanabe, Nanri and Yoshida40,Reference Sasaki, Yanagibori and Amano42,Reference Fujiwara, Murakami and Sasaki45–Reference Asakura, Haga and Sasaki48,Reference Date, Fukui and Yamamoto53,Reference Tsubono, Sasaki and Kobayashi54,Reference Karita, Sasaki and Ishihara58–Reference Mori, Sawada and Ishihara64,Reference Sunami, Sasaki and Suzuki66,Reference Kato, Takachi and Ishihara67) , respectively.

Fig. 1. Flowchart of the study selection to identify questionnaire-based dietary assessment methods validated among Japanese adults for use in the National Health and Nutrition Survey. FFQ, food frequency questionnaire.
Quality assessment
The results of the quality assessment are shown in Table 1. The range of total quality score of the 32 articles was 3–5.5 points (main articles: 3.5–5 points), with eight articles (including 2 main articles) classified as ‘good’, while the remaining articles were classified as ‘excellent’. The samples of four of the additional articles were classified as homogeneous. Moreover, the sample sizes were fewer than 100 participants in six articles. All but one of the selected references used multiple analysis methods, with correlation being the most frequently used statistical method (main [n = 14], additional [n = 17]) followed by group-level comparison (main [n = 14], additional [n = 16]). Seven main and nine additional articles administered questionnaires prior to the reference method.
Table 1. Study quality as assessed by modified EURECCA tool in a scoping review of validating dietary questionnaires used in Japan

FFQ, Food frequency questionnaire; 47-item FFQ, 47-item short food frequency questionnaire; DHQ, Self-administered diet history questionnaire; BDHQ, Brief-type self-administered diet history questionnaire; MDHQ, Meal-based Diet History Questionnaire; JPHC FFQ at baseline, 44-item food frequency questionnaire; JPHC_5y, JPHC FFQ at 5-year follow-up; FFQ in JPHC-NEXT, Long-FFQ in the Japan Public Health Centre-based prospective Study for the Next Generation (JPHC-NEXT); Short-FFQ in JPHC-NEXT, 66-item food frequency questionnaire for the Japan Public Health Centre-based prospective Study for the Next Generation (JPHC-NEXT) follow-up survey; Short version FFQ, Short version of the Shizuoka Prefecture version of the Food Intake Frequency Questionnaire; Maruyama FFQ, Maruyama food frequency questionnaire
Questionnaire characteristics
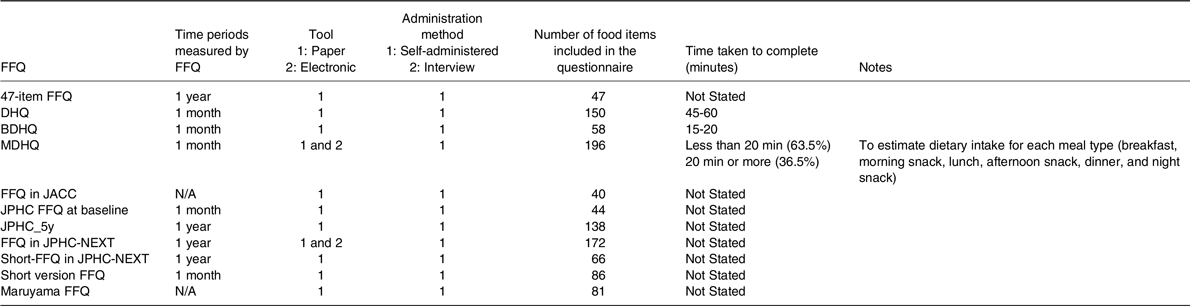
Table 2 shows the characteristics of the 11 questionnaires (32 validation study articles) identified in this scoping review. All questionnaires were self-administered. The time periods measured by FFQ was 1 month for five of the questionnaires (DHQ, BDHQ, MDHQ, JPHC FFQ at baseline, and Short-version FFQ) and 1 year for four questionnaires (47-item FFQ, JPHC_5y, FFQ in JPHC-NEXT, and Short-FFQ in JPHC-NEXT), while two questionnaires (FFQ in JACC and Maruyama FFQ) did not state the time periods. All questionnaires were available in paper form, with two of them also available in electronic form (MDHQ and FFQ in JPHC-NEXT). The number of food items ranged from 40 (FFQ in JACC) to 196 (MDHQ). Only three questionnaires (DHQ: 45–60 min, BDHQ: 15–20 min, MDHQ: < 20 min for approximately 65% population) indicated the time taken to complete (15–60 min).
Table 2. Characteristics of included validation studies in a scoping review of dietary assessment questionnaires used in Japan; survey administration
FFQ, Food frequency questionnaire; 47-item FFQ, 47-item short food frequency questionnaire; DHQ, Self-administered diet history questionnaire; BDHQ, Brief-type self-administered diet history questionnaire; MDHQ, Meal-based Diet History Questionnaire; JPHC FFQ at baseline, 44-item food frequency questionnaire; JPHC_5y, JPHC FFQ at 5-year follow-up; FFQ in JPHC-NEXT, Long-FFQ in the Japan Public Health Centre-based prospective Study for the Next Generation (JPHC-NEXT); Short-FFQ in JPHC-NEXT, 66-item food frequency questionnaire for the Japan Public Health Centre-based prospective Study for the Next Generation (JPHC-NEXT) follow-up survey; Short version FFQ, Short version of the Shizuoka Prefecture version of the Food Intake Frequency Questionnaire; Maruyama FFQ, Maruyama food frequency questionnaire
Characteristics of the validity studies for questionnaires
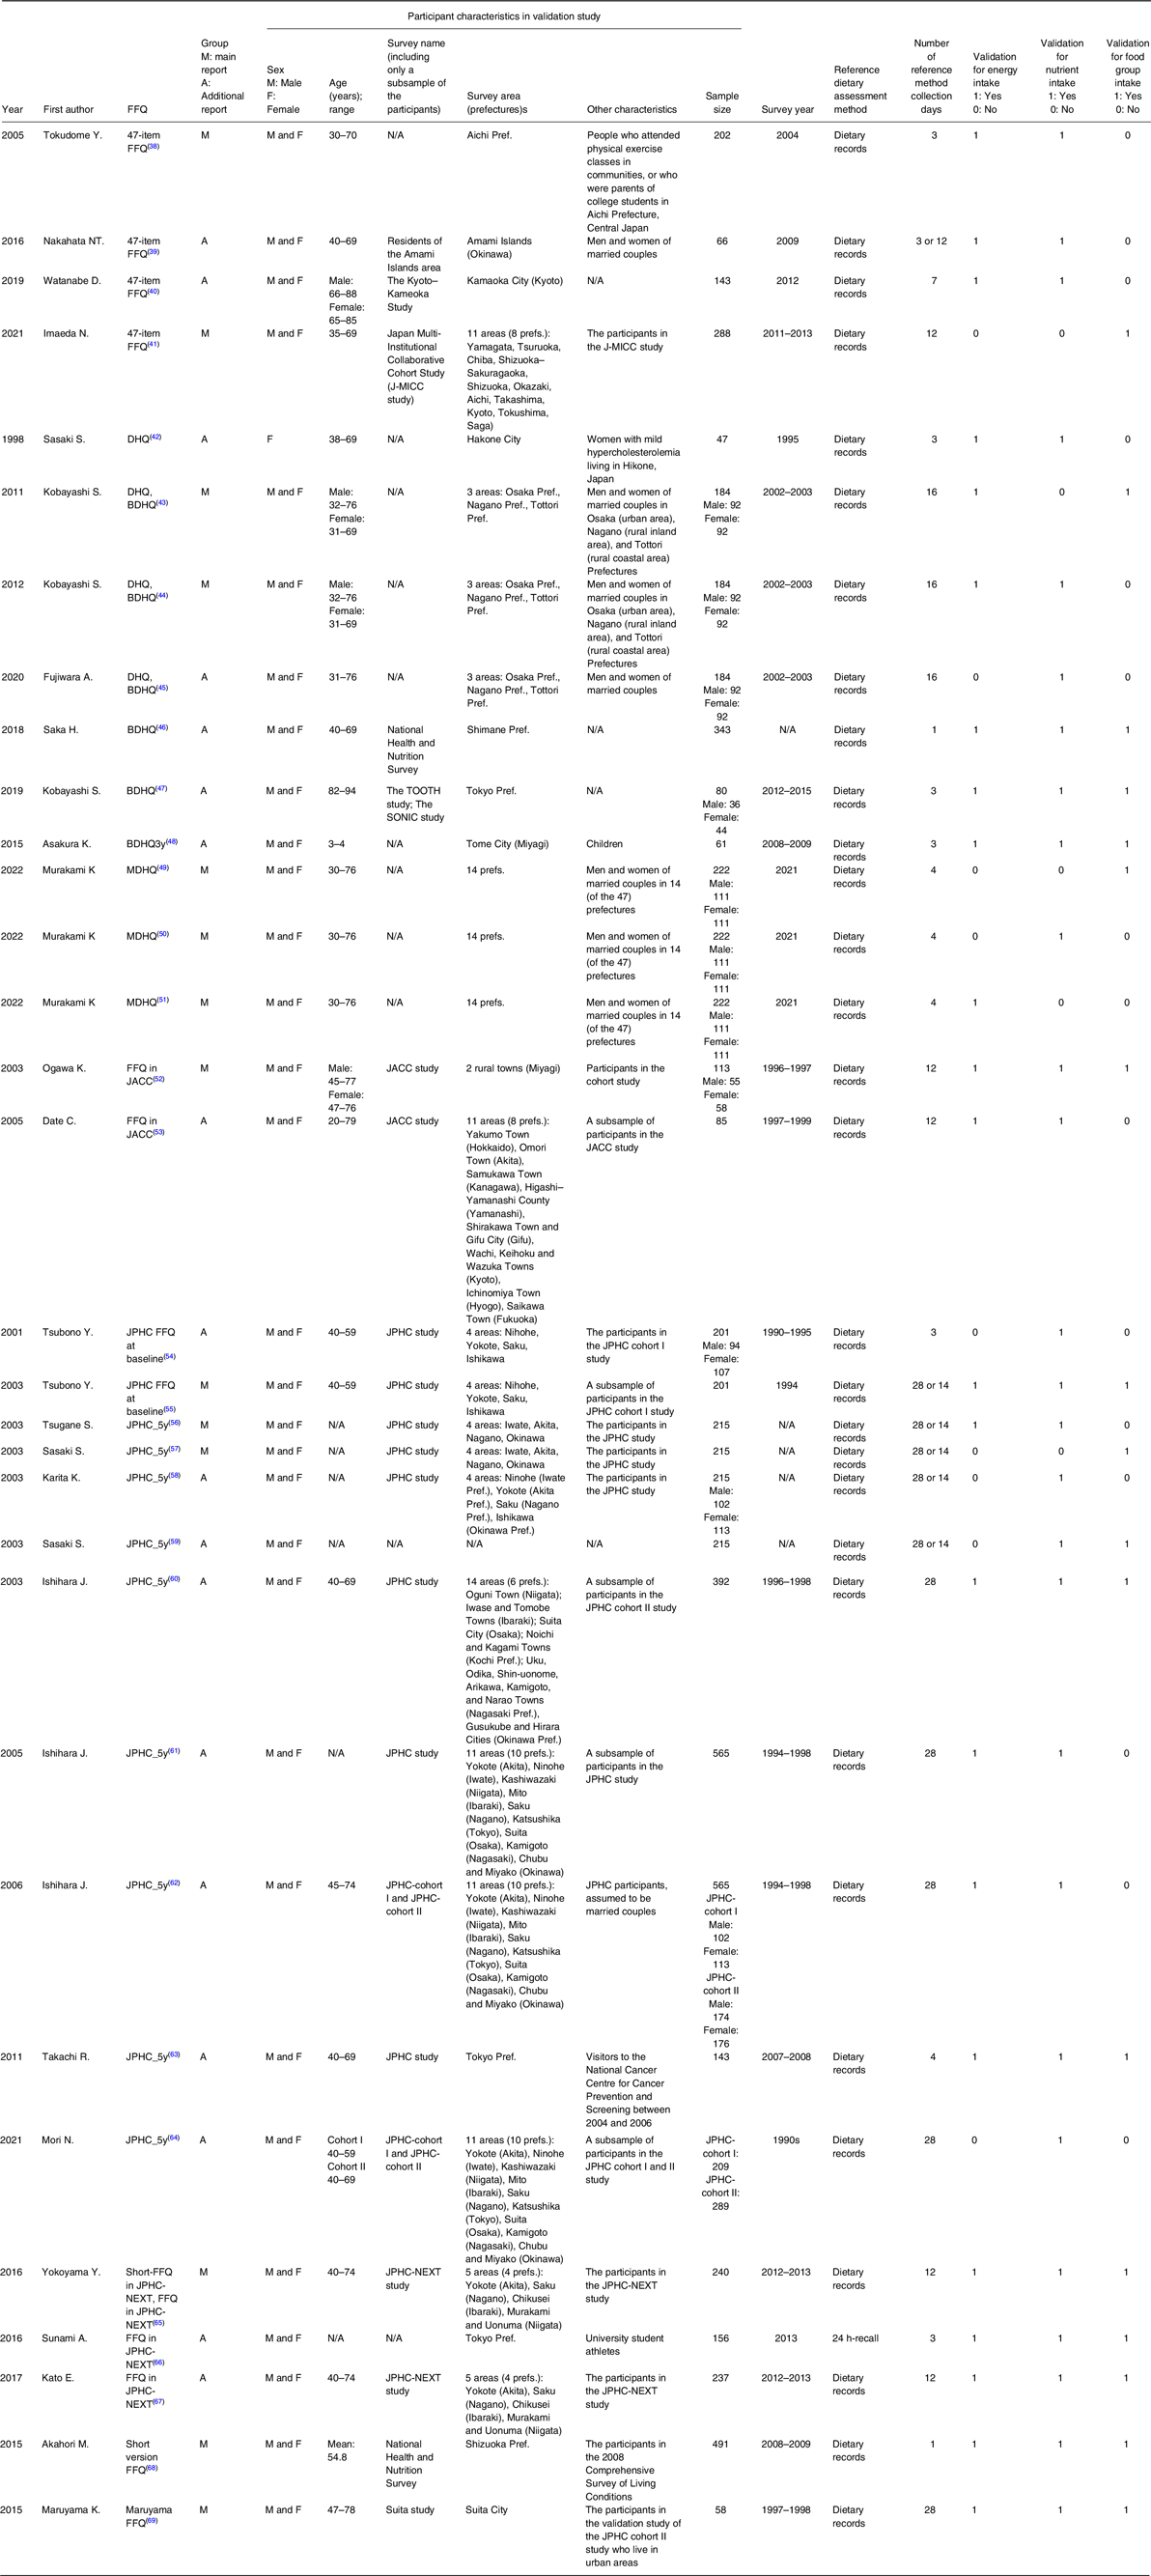
Table 3 shows the characteristics of the validity studies for questionnaires. Participants in the main papers ranged in age from 30 to 76 years, most studies incorporate a subset of participants representing the middle years of 40 to 75 years old participating in the cohort study in which the FFQs are used. This trend was similar in the additional articles, although the 47-item FFQ, DHQ, BDHQ, MDHQ, and FFQ in JACC included young adults (<40 years), the 47-item FFQ and BDHQ included older adults (≥ 80 years), and the BDHQ included young children (3–4 years). Additionally, the number of prefectures from which participants were sampled for validity studies (indicated by the minimum value if there were several studies) ranged from 1 prefecture (Short version FFQ and Maruyama FFQ) to 14 prefectures (MDHQ). In all the studies, the reference dietary assessment method was the dietary record method, except for an additional article using the 24-h recall method. The number of days of intake assessed using the reference methods ranged from 1 to 28 d. Approximately 90% of the articles used 3 or more days dietary records as reference, and one-day dietary record was used as a reference method in two articles.
Table 3. Characteristics of included validation studies in a scoping review of dietary assessment questionnaires used in Japan; study details
FFQ, Food frequency questionnaire; 47-item FFQ, 47-item short food frequency questionnaire; DHQ, Self-administered diet history questionnaire; BDHQ, Brief-type self-administered diet history questionnaire; MDHQ, Meal-based Diet History Questionnaire; JPHC FFQ at baseline, 44-item food frequency questionnaire; JPHC_5y, JPHC FFQ at 5-year follow-up; FFQ in JPHC-NEXT, Long-FFQ in the Japan Public Health Centre-based prospective Study for the Next Generation (JPHC-NEXT); Short-FFQ in JPHC-NEXT, 66-item food frequency questionnaire for the Japan Public Health Centre-based prospective Study for the Next Generation (JPHC-NEXT) follow-up survey; Short version FFQ, Short version of the Shizuoka Prefecture version of the Food Intake Frequency Questionnaire; Maruyama FFQ, Maruyama food frequency questionnaire
Outcomes of the validity studies
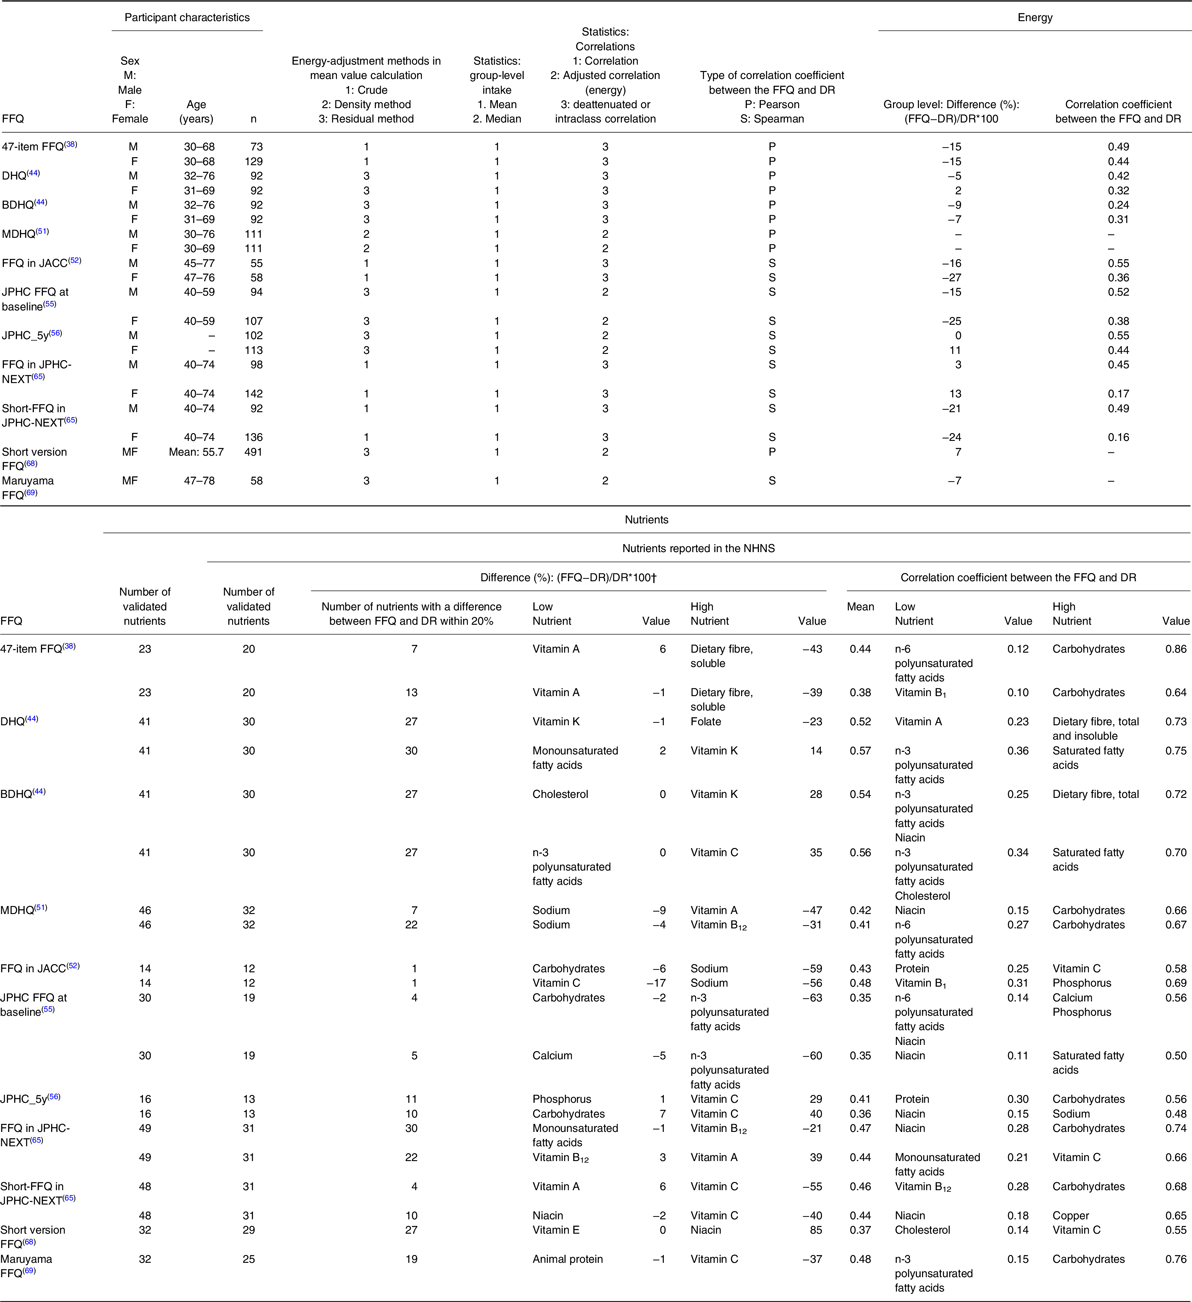
Tables 4 and 5 show the results of the evaluation of validity in terms of nutrient and food group intake in the main articles, respectively. For details of the validity of the FFQ, the results in terms of nutrient and food group intake are shown in Supplementary Tables 2 and 3, respectively. For nutrients, the number of nutrients reported in the NHNS that were validated in each questionnaire ranged from 12 (FFQ in JACC) to 32 (MDHQ). Among these nutrients, the number of group-level comparisons within 20% against reference methods ranged from 1 (FFQ in JACC) to 30 (DHQ and FFQ in JPHC-NEXT), and the mean proportion of nutrients with a group-level comparison within 20% was 58%. The highest number of group-level comparisons exceeding 20% against reference methods was 27 nutrients in Short-FFQ in JPHC-NEXT. Carbohydrates consistently had a high agreement in group-level comparison against reference methods using all 11 questionnaires, with mean differences in group-level comparison ranging from −22% to 11%.
Table 4. The results of the validity assessment of dietary questionnaires to estimate nutrient intakes among Japanese adults in main articles
FFQ, Food frequency questionnaire; DR, dietary record; NHNS, National Health and Nutrition Survey; 47-item FFQ, 47-item short food frequency questionnaire; DHQ, Self-administered diet history questionnaire; BDHQ, Brief-type self-administered diet history questionnaire; MDHQ, Meal-based Diet History Questionnaire; JPHC FFQ at baseline, 44-item food frequency questionnaire; JPHC_5y, JPHC FFQ at 5-year follow-up; FFQ in the Japan Public Health Centre-based prospective Study for the Next Generation (JPHC-NEXT), Long-FFQ in JPHC-NEXT; Short-FFQ in JPHC-NEXT, 66-item food frequency questionnaire for the Japan Public Health Centre-based prospective Study for the Next Generation (JPHC-NEXT) follow-up survey; Short version FFQ, Short version of the Shizuoka Prefecture version of the Food Intake Frequency Questionnaire; Maruyama FFQ, Maruyama food frequency questionnaire
† Differences reported in absolute values
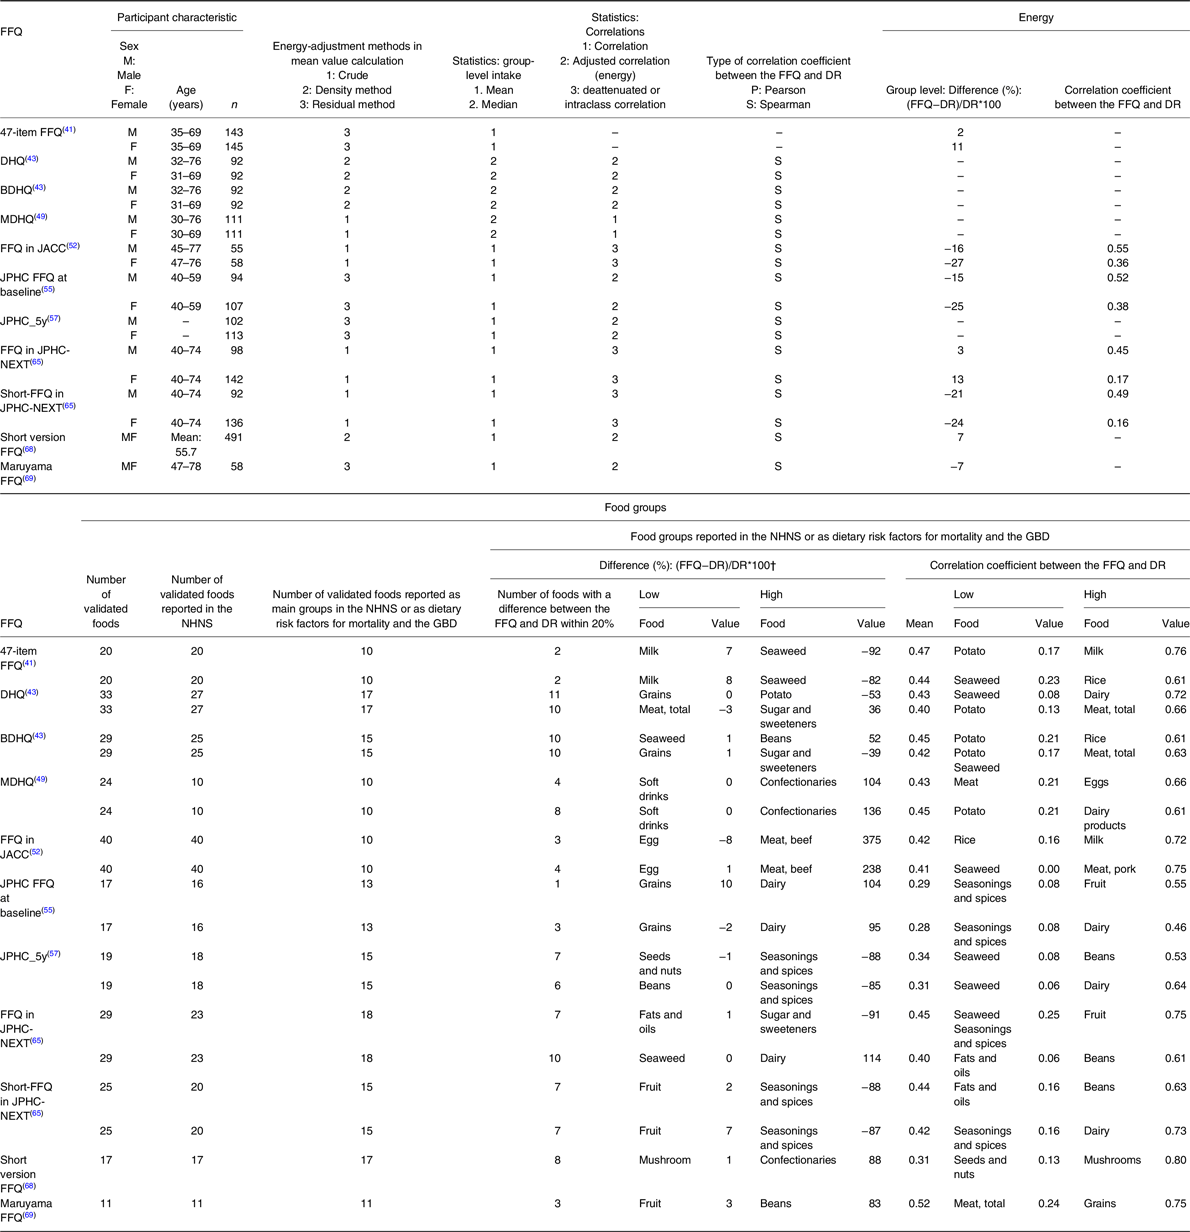
Table 5. The results of the validity assessments of dietary questionnaires to estimate food group intakes among Japanese adults in main articles
FFQ, Food frequency questionnaire; DR, Dietary record; GBD, Global burden of disease; NHNS, National Health and Nutrition Survey; 47-item FFQ, 47-item short food frequency questionnaire; DHQ, Self-administered diet history questionnaire; BDHQ, Brief-type self-administered diet history questionnaire; MDHQ, Meal-based Diet History Questionnaire; JPHC FFQ at baseline, 44-item food frequency questionnaire; JPHC_5y, JPHC FFQ at 5-year follow-up; FFQ in JPHC-NEXT, Long-FFQ in the Japan Public Health Centre-based prospective Study for the Next Generation (JPHC-NEXT); Short-FFQ in JPHC-NEXT, 66-item food frequency questionnaire for the Japan Public Health Centre-based prospective Study for the Next Generation (JPHC-NEXT) follow-up survey; Short version FFQ, Short version of the Shizuoka Prefecture version of the Food Intake Frequency Questionnaire; Maruyama FFQ, Maruyama food frequency questionnaire
† Differences were evaluated in absolute values.
The range of the mean CCs of nutrient intake was 0.35 (JPHC FFQ at baseline) to 0.57 (DHQ). The mean proportion of nutrients with a CC of 0.5 or higher, which implies that a tool is reliable for measuring dietary intake using the relevant dietary questionnaire(Reference Lombard, Steyn and Charlton35), was 37%. Poly unsaturated fatty acids tended to have low CCs. For nutrients., both the DHQ (group-level comparison: approximately 95%, CCs: approximately 70%) and BDHQ (group-level comparison: approximately 90%, CCs: approximately 70%) had high values for both group-level comparison and CCs, whereas the FFQ in JPHC-NEXT, Short-FFQ in JPHC-NEXT, and Maruyama FFQ tended to have high CCs but low group-level comparison results.
The number of food groups reported as a main group in the NHNS or as a dietary risk in terms of the global burden of disease and mortality that were validated in each questionnaire ranged from 10 (47-item FFQ, MDHQ, and FFQ in JACC) to 18 (FFQ in JPHC-NEXT). Among these food groups, the number of group-level comparisons within 20% against reference methods ranged from one (JPHC FFQ at baseline) to 11 (DHQ). The mean proportion of food groups with a group-level comparison result within 20% was 43%. The highest number of group-level comparisons exceeding 20% against reference methods was 37 food groups in FFQ in JACC. Additionally, the range of the mean CCs for food group intakes was 0.28 (JPHC FFQ at baseline) to 0.52 (Maruyama FFQ). The mean proportion of food groups with a CC of 0.5 or higher was 31%. The CCs for grains including rice, fruit, and dairy were high (mean CC: 0.51, 0.53, and 0.61, respectively), while the CCs for seaweed, seasonings, and potato were low (mean CC: 0.22, 0.17, and 0.25, respectively) in all 11 questionnaires. For food groups, the BDHQ (group-level comparison: approximately 70%, CCs: approximately 45%) had high values for both group-level comparison and CCs. These trends were similar in the additional articles — the validity results reported in these articles are shown in Supplementary Table 4.
Discussion
This scoping review sought the existence of questionnaires to assess dietary intakes of the Japanese population, with a view to assess their suitability for the Japanese NHNS. To our knowledge, this is the first scoping review to identify questionnaires, as opposed to identification of article-based, that estimate dietary intake in healthy adults within a country — this allows us to compare questionnaires and identify a suitable tool for the intended purpose given that the validity of a dietary questionnaire can be influenced by the number of validation studies that have been conducted. Among 32 articles that were of good quality, we identified 11 dietary questionnaires. However, validity in terms of nutrient and food group intake varied among the questionnaires, and there was a range of mean intake values (group-level comparison) and CCs that were used as indicators within each questionnaire.
To date, there have been two article-based reviews of FFQs in Japan. One was reported in 2009, in which 21 articles were extracted (including articles reporting on the same FFQ)(Reference Wakai24). The other reviewed 50 articles published until 2017(Reference Kameda and Sudo31). The number of articles cannot be compared because the second review included studies that used biomarkers as the reference method(Reference Kameda and Sudo31); nonetheless, fewer studies used a dietary record or 24-h recall as the reference dietary assessment method (n = 15) than in the current review (n = 32). This may be owing to the publication of seven articles after 2017 and the different search formulae used. The present study used a search formula that broadly captured terms related to ‘validity’ and ‘questionnaire’. This enabled us to identify more studies that assessed validity against dietary record and 24-h recall reference methods. The most important difference was that the two previous reviews aimed to review validation studies of FFQs developed in Japan, whereas the current review aims to identify FFQs that can be used for the NHNS in Japan (calculating representative values of nutrient intakes for Japanese aged 1 year and older).
The present review included studies conducted among Japanese adults, the primary target population of the NHNS. Most participants in the validity studies were middle-aged or older, because many of the questionnaires (6 of 11) were developed for use in cohort studies that targeted middle-aged or older individuals, and the validity studies were conducted among a subsample of the main cohort study(Reference Ogawa, Tsubono and Nishino52,Reference Tsubono, Kobayashi and Sasaki55–Reference Sasaki, Kobayashi and Tsugane57,Reference Yokoyama, Takachi and Ishihara65,Reference Maruyama, Kokubo and Yamanaka69) . The number of items in the questionnaires ranged from 40 to 196, and for only three questionnaires, the time required for completion was reported. Given that the time required for completion may be one factor indicative of the burden on participants, future reports are anticipated. Additionally, there is no articles which described the necessity of supports by the interviewers that is labor-intensive for investigators (data not shown), thus the future study should assess it.
Use of the dietary record method in most validity studies reflects its common use in Japan, and may be related to it being the tool used in the Japanese NHNS, which is contrary to many other countries that use the 24-h recall in their national nutrition surveys(Reference Koshida, Okada and Okada70). The dietary record and weighed food record are recommended as the first-choice reference method when validating dietary questionnaires(Reference Cade, Thompson and Burley23), indicating that the results of the validity studies extracted in this study are rather reliable.
Group-level comparison was performed and CCs calculated in all main and most additional articles in this review (not reported in additional articles: group-level comparison, n = 4; CCs, n = 1). CCs, which measure the strength and direction of an association between two different measurements at the individual level, are most commonly used as indicators of validity in studies of dietary questionnaires(Reference Lombard, Steyn and Charlton35). However, as CCs do not measure the degree of agreement between the two methods, the assessment of indicators that reflect agreement between two measurements at the group level (“group-level comparison” and “Bland–Altman plot”) is also important(Reference Lombard, Steyn and Charlton35). These results may explain the good quality and excellent validation design of the studies on dietary questionnaires extracted in the present review.
The dietary questionnaires extracted in this scoping review were all reported to be valid (especially in terms of ranking ability for nutrients and foods intakes); nevertheless, results varied by nutrient and food group, similar to reports on questionnaires in other countries(Reference Sierra-Ruelas, Bernal-Orozco and Macedo-Ojeda26,Reference Nouri, Ghazizahedi and Mohajeri71) . Despite the ease of understanding intake frequency by participants for both fruit and dairy, the inconsistency evident within the dairy group less clear. Fruit and dairy have the potential to indicate higher CCs because the intake frequency is easier to understand(Reference Ayoubi, Yaghoubi and Pahlavani30). On the other hand, as a factor that causes differences in agreement of group level comparison, fruits are easier to set portion sizes and answer (e.g. 1/2 apple)(Reference Kameda and Sudo31), whereas dairy, especially milk which accounts for the majority of Japanese dairy intake(13), may be consumed in small amounts (e.g. used for cooking) or large amounts (e.g. in beverages)(Reference Cade, Thompson and Burley23).
Additionally, for grains, including rice, many articles had correlation coefficients higher than 0.5 and group level comparison within 20% in the present study. Most of the FFQs request more detail on grains items including rice as the staple food of the Japanese population(Reference Shinozaki, Murakami and Asakura72). Higher agreement in carbohydrate intake was found between validation studies, which may be related to more details collected through the questionnaire(Reference Cade, Thompson and Burley23). With grains (especially rice) making up 60% of the Japanese dietary intake(13), this reflects the importance of collecting greater details of frequently-consumed items for more accurate outcomes. On the other hand, the validity results for seaweed, seasonings, and potato intake did not show good agreement in group-level comparisons or CCs. These foods require cooking and have multiple uses; thus, they are consumed in all three major dietary patterns of the Japanese population (healthy [characterized by higher intakes of mushrooms, seaweeds, vegetables, pickles potatoes, fruits, and pulses], prudent [characterized by higher intakes of mushrooms, seaweeds, vegetables, potatoes, fruits, and pulses] and Japanese [characterized by higher intakes of mushrooms, seaweeds, potatoes, vegetables, pickles, pulses, seasonings, fruits, and fish and shellfish] patterns)(Reference Murakami, Shinozaki and Fujiwara73), but with low daily intake(13). Additionally, it has been reported that the Japanese diet is characterized by the use of various ingredients, seasonings, and cooking methods, which may influence responses on food intake frequency(Reference Shinozaki, Yuan and Murakami74). These factors may complicate the estimation of portion size(Reference Chambers, Godwin and Vecchio75) in FFQs that require recall(Reference Lombard, Steyn and Charlton35,Reference Daniels, Glorieux and Minnen76) , which in turn may affect the estimation of nutrient and food group intakes. Simultaneously, the lower CCs of seasonings and spices compared to those obtained in Western countries (0.6–0.7)(Reference Cui, Xia and Wu77) and Iran (0.39)(Reference Ayoubi, Yaghoubi and Pahlavani30) may be a result of the higher complexity of the Japanese diet found to contain more ingredients than Western or Iranian diets(Reference Shinozaki, Yuan and Murakami74).
Four FFQs (FFQ in JACC, FFQ in JPHC-NEXT, Short-FFQ in JPHC-NEXT, and Maruyama FFQ) tended to have high CCs and low group-level comparison. This may be due to the fact that the ability to categorize populations (quartiles or quintiles) by nutrient and food group intake was a priority in order to examine the association between dietary intake and outcomes in the development of questionnaires used in cohort studies(Reference Cade, Burley and Warm78).
Another factor is that the validation of these dietary questionnaires was conducted in a subsample of the main cohort, and the fact that the FFQs were conducted after the dietary records may have affected the CCs(Reference Cade, Thompson and Burley23). If the FFQ is administered after the dietary record method, there is concern that subjects may respond to the FFQ under the influence of their most recent dietary record(Reference Cade, Thompson and Burley23). It is important to carefully scrutinize publications related to questionnaire development and validation studies to determine whether the original purpose of the questionnaire meets the requirements of the new study(Reference Cade, Thompson and Burley23). Given that the NHNS requires the assessment of average dietary intake in the Japanese population, it will be necessary to select the dietary questionnaire that has the high values for group-level comparisons and CCs.
Considering the perspective of the dietary questionnaire used in the NHNS, the intake of salt, vegetables, and fruit — for which the government has set targets (Health Japan 21) because their intake is considered a challenge in the Japanese population(79) — is monitored in the NHNS results. Hence, ensuring accuracy in validity measurement in terms of these intakes is even more important. Considering the validity results for salt, vegetable, and fruit intake, group-level comparisons within 20% and CCs above 0.5 for studies of ‘Good’ quality, or close to but not exactly 0.5 for those of ‘Acceptable’ quality(Reference Lombard, Steyn and Charlton35), were obtained for the BDHQ and MDHQ. These results may provide one basis for consideration of the use of these tools in the current NHNS.
Moreover, the findings of validation studies (particularly summary values, figures, and numbers) should be carefully interpreted. For example, CCs increase as collection days increase in reference methods, indicating a higher agreement/correlation with a greater amount of data collected(Reference Cade, Burley and Warm78,Reference Potosky, Block and Hartman80) . Further, there is no consensus on assessing and interpreting the Bland–Altman plot in validation studies of dietary assessment questionnaires(Reference Lombard, Steyn and Charlton35). Bland–Altman analysis reflects the presence, direction, and extent of bias, as well as the level of agreement between two measures(Reference Lombard, Steyn and Charlton35); however, the decision about what is acceptable agreement is a clinical one; statistics alone cannot answer the question(Reference Bland and Altman81). This is partially reflected by the fact that all the dietary assessment questionnaires were considered ‘valid’ in each of the original articles. Thus, the present review should be considered a scientific basis (not an absolute answer) for selecting a suitable dietary assessment questionnaire for future research, including for the NHNS. In the future, it will be necessary to verify whether the 11 questionnaires identified in the present study can be used in the NHNS participants or sub-sample of them (not only in terms of validity and feasibility but also in terms of participation rates, and consistency with previous NHNS results). Additionally, although 11 questionnaires were extracted in the present study, the dietary patterns, energy, macro nutrient and salt intake among Japanese have changed over time(Reference Murakami, Livingstone and Sasaki82–Reference Matsumoto, Tajima and Fujiwara84). It will be necessary to periodically examine the feasibility of using the questionnaires to monitor changes in the dietary intake of the Japanese population through the NHNS.
The FFQ has been used in national surveys in several foreign countries(Reference Koshida, Okada and Okada70). For the characteristics of its use, not only the association between dietary intake and risk of NCDs(Reference Zhang, Tapera and Gou85) but also pesticide residue exposure status has also been examined(Reference Cimenci, Vandevijvere and Goscinny86). To date, pesticide residues have not been evaluated in the NHNS. In Japan, pesticide residues are mainly evaluated using blood and urine(Reference Taniguchi, Yamazaki and Nakayama87,Reference Tsuchiyama, Ito and Oya88) , and there are few studies on dietary exposure for representative Japanese populations(Reference Sawada, Iwasaki and Inoue89,Reference Sawada, Iwasaki and Inoue90) . The evaluation of pesticide residues using blood and urine do not provide estimation of long-term dietary exposure. If dietary questionnaires could be employed as part of the NHNS on a regular basis, the NHNS will provide important information that can be used to assess domestic food safety (e.g. long-term dietary exposure to pesticide residues), as well as basic data for establishing dietary guidelines and updating food composition tables.
The major strength of this review is that we were able to extract dietary questionnaires that can be used for intake assessment in healthy Japanese adults (the primary targets of the NHNS) from articles published in both English and Japanese.
However, this scoping review has several limitations. First, it is unknown whether these same validation results would be obtained when the dietary questionnaire is used in populations other than the population in which it was validated. When using the dietary questionnaire in the NHNS, a pilot study should first be conducted to validate the new questionnaire in the NHNS population. Further, it may be important to evaluate its validity in a (preferably randomly selected) subsample of participants in the same year conducting the NHNS. In terms of calibration capability, accuracy is increased when a dietary questionnaire is used in conjunction with a detailed dietary survey (dietary record or 24-h recall)(Reference Carroll, Midthune and Subar91). Therefore, it may be necessary to continue to use the dietary record method, even if only for a subsample rather than for all participants. The use of web-based dietary records or 24-h recalls, which are reported to reduce problems related to cost and participation rates, should be considered(Reference Thompson, Subar and Loria92,Reference Timon, van den Barg and Blain93) . Second, although the employed strategy in this scoping review was to use wide search terms, search multiple relevant databases, and manually search reference lists, we may not have captured all relevant articles. Third, in order to cover the overall intake of nutrients and food groups, validation studies based on biomarkers, which are often referred to as the gold standard but are only available for a limited number of dietary components, were omitted. It is necessary to select a dietary questionnaire after reviewing studies in which the validity of dietary questionnaires was examined against biomarkers. Fourth, the quality assessment was modified for this review. It should therefore be noted that it cannot be compared with other studies that have assessed quality using the EURECCA tool(Reference Cui, Xia and Wu28,Reference Ayoubi, Yaghoubi and Pahlavani30) . Finally, we did not examine the information about portion size in each questionnaire. However, it has been reported that there is little difference between the absence and presence of a specified portion size(Reference Cade, Thompson and Burley23).
Conclusions
This scoping review identified 11 dietary questionnaires that can assess the dietary intake of Japanese adults. All the extracted dietary questionnaires were reported to be valid; nonetheless, the group-level comparison and CC values — which are indicators of validity in terms of nutrient and food group intake — varied. When using an existing dietary questionnaire in the NHNS, the results and design of the validation study about the relevant tool should be considered, and a dietary questionnaire with high group-level comparison and CC values on the intended assessment items (especially those items for which NHNS data is used in evaluating target items) should be selected. In the future, the validation of the questionnaire needs to be assessed in NHNS participants.
Financial Support
This work was supported by the Ministry of Health, Labour and Welfare Comprehensive Research on Lifestyle Related Diseases including Cardiovascular Diseases and Diabetes Mellitus Program (grant number JPMH22FA2003). The Ministry of Health, Labour, and Welfare had no role in the design, analysis, or writing of this article.
Conflict of Interest
All authors had no conflicts of interest to declare.
Author Contributions
All authors designed the study. Review protocol, M.M., K.M., X.Y., F.O., R.A., and R.T.; review, M.M., X.Y., F.O., and R.A.; writing — original draft preparation, M.M.; writing — review and editing, K.M., X.Y., F.O., R.A., R.T., E.O., M.N., S.S., and H.T. All authors have read and agreed to the published version of the manuscript.
Supplementary material
To view supplementary material for this article, please visit https://doi.org/10.1017/jns.2024.1


 Open access