


Introduction
Ecosystem services are the contributions from nature to human well-being (Millennium Ecosystem Assessment, 2005). Their aggregate monetary value is estimated to far exceed global conservation costs (Balmford et al., Reference Balmford, Bruner, Cooper, Costanza, Farber and Green2002), and their non-monetary values support human health and prosperity (Myers & Patz, Reference Myers and Patz2009). Despite this, human-driven environmental changes continue to threaten and degrade the provision of ecosystem services, with adverse consequences for society and biodiversity (Larsen et al., Reference Larsen, Turner and Mittermeier2015). Effective design and implementation of governance systems and institutions to manage ecosystem services are therefore key to maintaining the benefits they deliver for current and future generations (Carpenter et al., Reference Carpenter, Mooney, Agard, Capistrano, DeFries and Diaz2009).
Management can affect who benefits from ecosystem services and by how much (Fisher et al., Reference Fisher, Kulindwa, Mwanyoka, Turner and Burgess2010). For example, interventions can target the ecological provision of services (e.g. by removing threats to them, or facilitating ecosystem recovery) or mediate the magnitude of benefits available for people (Ferraro et al., Reference Ferraro, Hanauer, Miteva, Nelson, Pattanayak, Nolte and Sims2015). Management interventions can also modify demand for ecosystem services (e.g. by providing economic substitutes; Yahdjian et al., Reference Yahdjian, Sala and Havstad2015) and the human use of them (e.g. by establishing property and access rights; Vatn, Reference Vatn2010; Horcea-Milcu et al., Reference Horcea-Milcu, Leventon, Hanspach and Fischer2016; Wieland et al., Reference Wieland, Ravensbergen, Gregr, Satterfield and Chan2016). Such interventions are not discrete measures implemented in isolation, but form complex interactions with each other and the environment (Norgaard, Reference Norgaard2010; Reyers et al., Reference Reyers, Biggs, Cumming, Elmqvist, Hejnowicz and Polasky2013). Interventions should therefore be kept flexible, so that they can be adapted in the context of specific situations and respond to changes that may arise over time (Carpenter et al., Reference Carpenter, Mooney, Agard, Capistrano, DeFries and Diaz2009; Levin et al., Reference Levin, Xepapadeas, Crépin, Norberg, Zeeuw and de Folke2013; Mann et al., Reference Mann, Loft and Hansjürgens2015).
Management decisions are further complicated when ecosystem services provide benefits to multiple groups of people (Brooks et al., Reference Brooks, Smith, Holland, Poppy and Eigenbrod2014; Horcea-Milcu et al., Reference Horcea-Milcu, Leventon, Hanspach and Fischer2016). Beneficiary groups may differ in the benefits they derive from services, exist at different spatial, temporal or institutional scales, and have different values, needs and vulnerabilities (Turner et al., Reference Turner, van den Bergh, Söderqvist, Barendregt, van der Straaten, Maltby and van Ierland2000; Hein et al., Reference Hein, van Koppen, de Groot and van Ierland2006; Fisher et al., Reference Fisher, Turner and Morling2009). Failing to recognize such differences when managing ecosystem services for one group may have unintended negative consequences for others (Hein et al., Reference Hein, van Koppen, de Groot and van Ierland2006; Fisher et al., Reference Fisher, Bradbury, Andrews, Ausden, Bentham-Green, White and Gill2011; Duraiappah et al., Reference Duraiappah, Asah, Brondizio, Kosoy, O'Farrell and Prieur-Richard2014). We know little about how beneficiary groups differ and respond to management, but such knowledge is necessary to ensure an equitable distribution of the benefits provided by ecosystem services amongst stakeholders (Daily et al., Reference Daily, Polasky, Goldstein, Kareiva, Mooney and Pejchar2009; Daw et al., Reference Daw, Brown, Rosendo and Pomeroy2011). Disaggregation of beneficiaries is not yet a common practice in ecosystem services research (Daw et al., Reference Daw, Brown, Rosendo and Pomeroy2011). However, some studies (e.g. Brooks et al., Reference Brooks, Smith, Holland, Poppy and Eigenbrod2014) emphasize the importance of capturing the diversity of values across stakeholder groups, to incorporate management issues at a local scale. Failure to analyse separately the benefits obtained by different groups ignores the complex interactions between ecosystems and beneficiaries (Horcea-Milcu et al., Reference Horcea-Milcu, Leventon, Hanspach and Fischer2016).
Recreational ecosystem services provide a useful study case to examine differences among beneficiaries because multiple groups often exist (Daniel et al., Reference Daniel, Muhar, Arnberger, Aznar, Boyd and Chan2012). One group may represent people who recreate and benefit from improved physical and mental well-being (Hartig et al., Reference Hartig, Evans, Jamner, Davis and Gärling2003; Shanahan et al., Reference Shanahan, Bush, Gaston, Lin, Dean, Barber and Fuller2016). Another could be the tourism industry that gains financial benefits from trip expenditures (Sen et al., Reference Sen, Harwood, Bateman, Munday, Crowe and Brander2014; Balmford et al., Reference Balmford, Green, Anderson, Beresford, Huang and Naidoo2015). For example, in systems with recreational hunting opportunities there may be hunters, who benefit from recreational experiences and game meat (Auger, Reference Auger2006; Knoche & Lupi, Reference Knoche and Lupi2007; Ljung et al., Reference Ljung, Riley, Heberlein and Ericsson2015), and residents, who live in areas where hunting occurs and thus benefit from hunters’ financial activities (Arnett & Southwick, Reference Arnett and Southwick2015).
Recreational hunting is a controversial issue in conservation (Dickson et al., Reference Dickson, Hutton and Adams2009). On the one hand, hunting has played an important role in the extinction of species (e.g. the dodo Raphus cucullatus) or in bringing species to near extinction (e.g. the American bison Bison bison). On the other hand, recreational hunting can be seen as a tool to regulate wildlife populations, and can provide significant economic benefits in rural areas where other opportunities are limited. Regardless of the controversies, hunting is a valuable recreational activity in North America, contributing > USD 33 billion to the USA economy each year in the form of trip expenditures (Arnett & Southwick, Reference Arnett and Southwick2015).
Within the USA, the state of Vermont is well known for its extensive forest and rural areas (Burlington, the largest city of the state has an estimated population of 42,240; U.S. Census Bureau, 2017). Recreational hunting in Vermont is a common outdoor activity with considerable economic impact. Much of the revenue generated from recreational hunting comes from big game hunting, which includes moose Alces alces, black bear Ursus americanus, white-tailed deer Odocoileus virginianus and turkey Meleagris gallopavo. In this study we focus on moose hunting. We investigate how the allocation of permits to hunt moose affects who benefits from this recreational ecosystem service. We identify two groups of beneficiaries: hunters and residents. We consider as residents all people living within each of the geographical Wildlife Management Units (WMUs) into which the state of Vermont is divided for hunting purposes. Although both hunters and residents benefit from hunting opportunities, differences in who they are and how they derive benefits may cause management interventions to affect them differently.
Here, we use demographic data together with records of moose hunting in Vermont to examine the effects of management decisions on these two beneficiary groups. We ask how the allocation of hunting permits by the government (through the Vermont Fish & Wildlife Department) affects (1) the total number of hunters, and therefore the benefits enjoyed by this group, (2) the benefits received by residents, and (3) the spatial distribution of the benefits for each group. Our findings show that annual variation in the allocation of permits affects the two groups differently and has consequences for the regional economy. There are no records indicating hunters’ places of residence, but we know from the U.S. Fish & Wildlife Service that for every moose hunting season since 1993, 10% of permits were assigned to hunters living outside Vermont (in 2013 this was 14%).
Methods
Moose hunting in Vermont
The Vermont Fish & Wildlife Department aims to maintain a healthy, viable moose population, maximize quality hunting opportunities for hunters and capture the financial benefits of hunting for rural businesses (Vermont Fish & Wildlife Department, 2006, 2009). Each year, harvest objectives are determined for each individual WMU based on moose population numbers and health, which are estimated from the previous seasons’ harvest rates and moose biological data. Permits are allocated to the WMUs based on these harvest objectives and issued to hunters via a lottery system. Prospective hunters enter the lottery (indicating a preferred WMU) and lottery winners are then able to purchase a hunting permit. A permit enables the hunter to harvest one moose during the season.
Although moose management in Vermont began in 1896, when a law was passed to grant complete protection to the species, modern management only began in 1992, when a Moose Management Plan was adopted (Vermont Fish & Wildlife Department, 2018a). Since the first official moose hunting season in 1993, there have been three phases of permit allocation (Vermont Fish & Wildlife Department, 2006, 2009). During the first phase (T1; 1993–2004), the aim was to establish a sustainable hunting season, during which permits were allocated to an increasing number of WMUs, prioritizing those with a high moose density in north-east Vermont. Moose density was so high in some areas that regenerating vegetation was being over-browsed and tree seedlings were completely eliminated, to the detriment of both moose and land owners. In recognition of this situation, an increased number of permits was allocated during the second phase (T2; 2005–2010), particularly in the north-east, to reduce moose density to a more sustainable level. By the third phase (T3; 2011–2014), moose populations had been reduced and the number of permits was returned close to T1 levels (Fig. 1). However, moose populations continued to decline in the north-east (the region with a higher moose density) and thus permits were further reduced and allocated to WMUs outside the north-east.
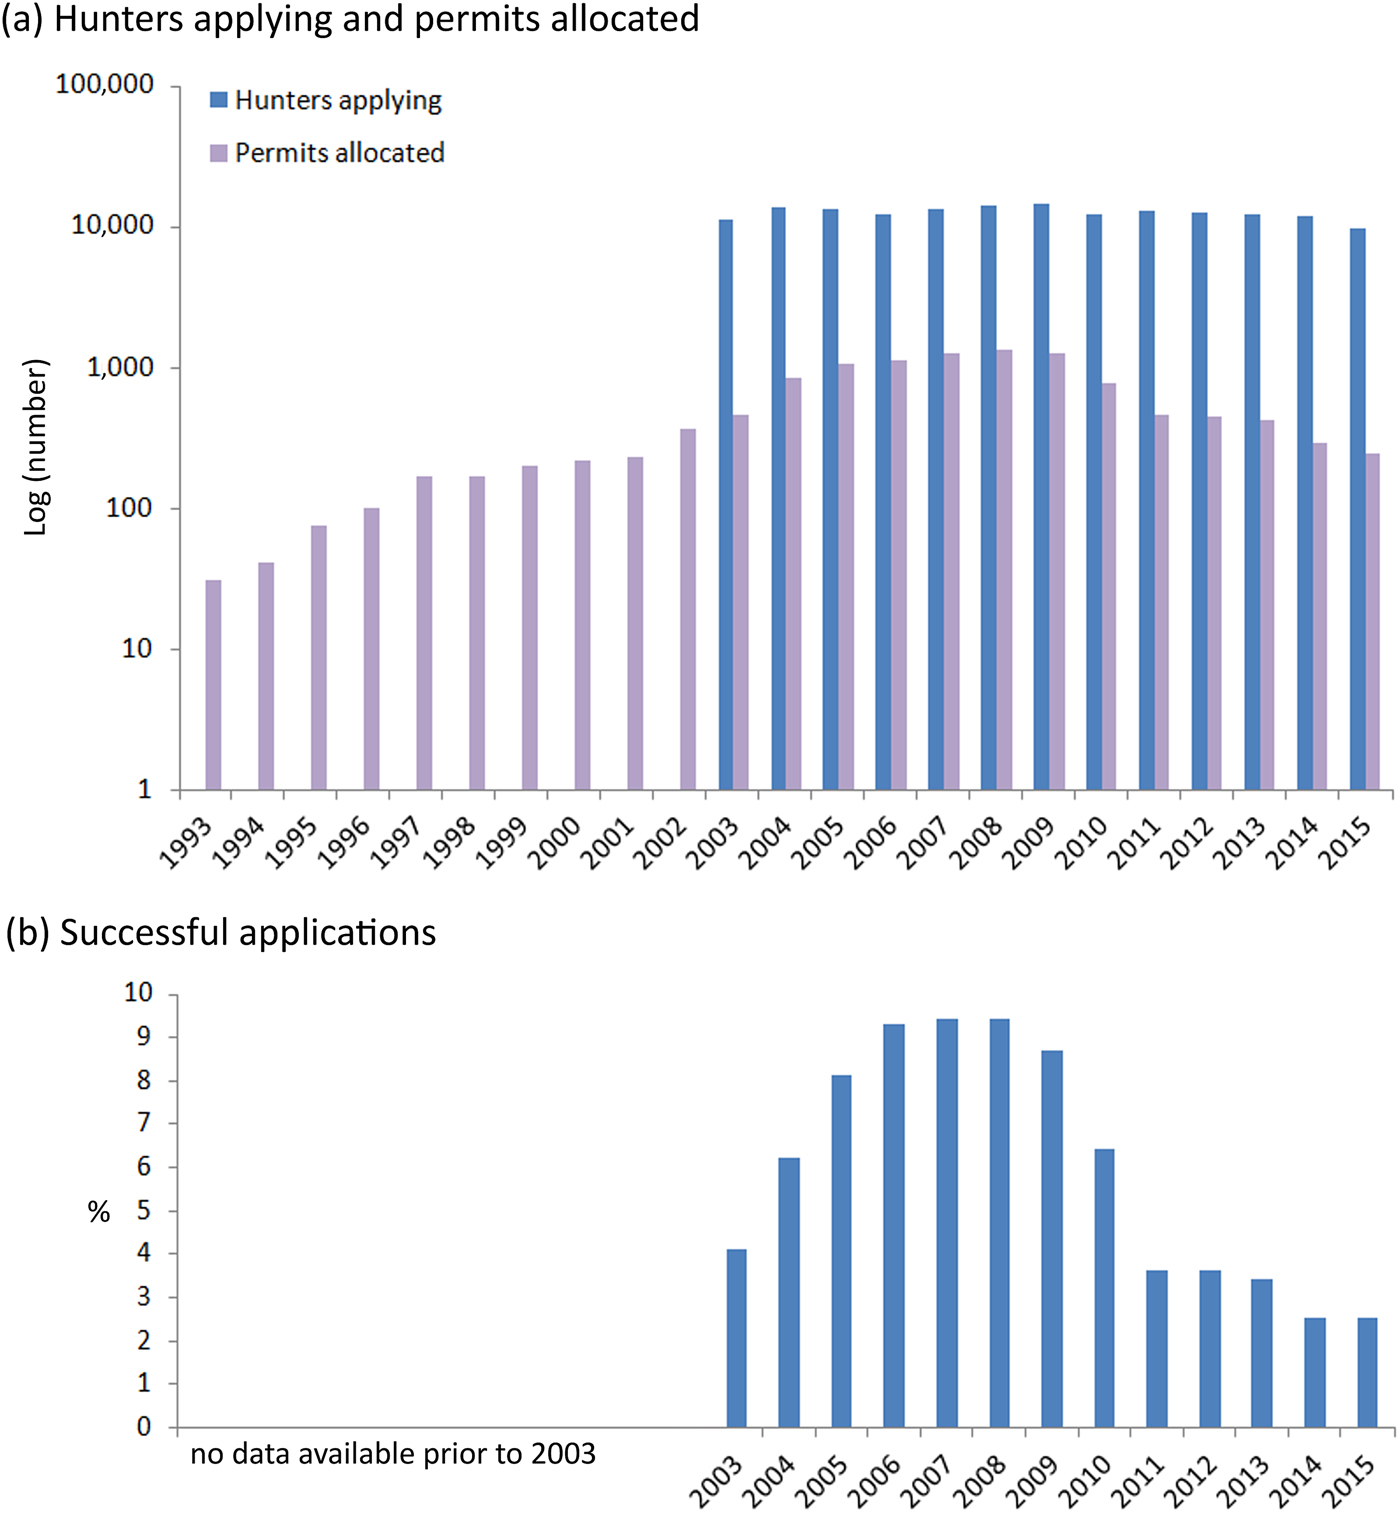
Fig. 1 (a) Annual number of moose hunting permits issued and hunters applying for a permit (note there are no records on number of hunters applying for a permit prior to 2003). (b) Per cent of successful applications for hunting permits.
During T3 the costs of entering the lottery and purchasing a permit increased, although by less than 20%. In 2016 the cost of a lottery ticket was USD 10 and that of a hunting permit was USD 100. Additionally, from 2007, unsuccessful applicants accumulated a bonus point each year. Each point added another occurrence of the applicant's name to the lottery in following years to increase their odds of winning. Demand for moose hunting, as indicated by lottery ticket sales, remained relatively stable over time and exceeded the total number of permits allocated by at least a factor of 10.
Data collection
To address our first question, regarding the number of hunters, we obtained annual data for 1993–2015 on the number of permits allocated per WMU and the number of hunters applying for a lottery ticket (for the latter, records are available for 2003–2015) from the Vermont Fish & Wildlife Department. For our second question, related to benefits for residents, we obtained population data and corresponding demographic indicators (e.g. household income) aggregated as mean values per municipality from U.S. Census Bureau (2018). We also obtained mean annual expenditure per big game hunter in Vermont (U.S. Fish & Wildlife Service, 2014). For the third question, regarding spatial distribution of benefits, we obtained data related to the geography of municipalities from Vermont Center for Geographic Information (2018), and data from State of Vermont Agency of Natural Resources (2018). These were combined with the data received from the Vermont Fish & Wildlife Department to geographically allocate the information related to WMUs.
Data and statistical analyses
The data and statistical analyses were conducted in three steps, using R 3.5.0 (R Core Team, 2017) and ArcGIS 10.1 (ESRI, 2012). To address our first question, we compared the total number of moose hunting permits allocated in Vermont with the total number of hunters applying for a lottery ticket in each year during 2003–2015. Secondly, we analysed the contribution that hunting brought to the residents within the WMUs where permits were allocated, by comparing the annual estimated expenditure of all hunters per WMU with the median household income in the respective WMU. Thirdly, we combined the geographical data, to visualize and examine the spatial distribution of benefits brought by moose hunting. To test how even the spatial distribution of allocated permits was in the three time periods (T1, T2 and T3), we used log-likelihood ratio tests (e.g. null hypothesis H 0: distribution of permits amongst WMUs in T1 did not equal that of T2). We used the log-likelihood ratio test (also known as the likelihood ratio test, G test, or G 2 test) to determine how far from the null hypothesis (H 0) the observed data is, and how independent the two datasets are of each other (McDonald, Reference McDonald2014).
Results
The number of hunting permits tripled between T1 (1993–2004) and T2 (2005–2010) and declined in T3 (2011–2014). The number of hunters applying for a lottery ticket remained relatively constant over time. The decline in the number of permits issued annually from 2011 onwards decreased the number of hunters authorized to hunt. During this period, 2.5–9.4% of applicants received a permit from the lottery allocation (Fig. 1).
The 2011 National Survey of Fishing, Hunting and Wildlife-Associated Recreation (U.S. Fish & Wildlife Service, 2014) estimated that 14% of hunters’ expenditures in Vermont are associated with travelling (e.g. lodging, transportation). Therefore, we assume that although some of the hunters might be residents in the WMUs where they hunt, some hunters come from other locations. Thus, we infer that the group ‘hunters’ and the group ‘residents’ are not composed of the same people.
To examine the impact of hunters’ contributions to residents’ livelihoods, we obtained the median household income (in USD/year) for the periods 2005–2009 and 2010–2014 from the U.S. Census Bureau data and aggregated it by WMU (data originated from multi-year surveys spanning these time periods, which is why they are different from periods T2 and T3 for data from the U.S. Fish & Wildlife Service). Based on the estimate that big game hunters in Vermont spend a mean of USD 1,842/year, including food and lodging (USD 127), transportation (USD 187) and equipment (USD 1,512; U.S. Fish & Wildlife Service, 2014), and considering that 5,945 moose hunting permits were issued in Vermont during 2005–2009 and 2,367 permits during 2010–2014, the estimated total hunters’ expenditure for these two periods was USD 10,950,690 and USD 4,360,014, respectively. Combining the median household income with the number of households in each WMU provides an estimate of the total WMU economy. Based on this, we calculated the per cent contribution of moose hunting to the economy in each WMU during 2005–2009 and 2010–2014 (Table 1).
Table 1 Contribution of big game hunting expenditures to each WMU economy during 2005–2009, and 2010–2014.
The geographical distribution of permits amongst WMUs was uneven, and allocation changed over time (Fig. 2). More than 50% of permits were allocated to three WMUs in north-east Vermont during T1 and T2, but the distribution was more homogeneous in T3, as shown by the log-likelihood ratio tests (T1: G = 4,687.1; T2: G = 10,333; T3: G = 943.5).
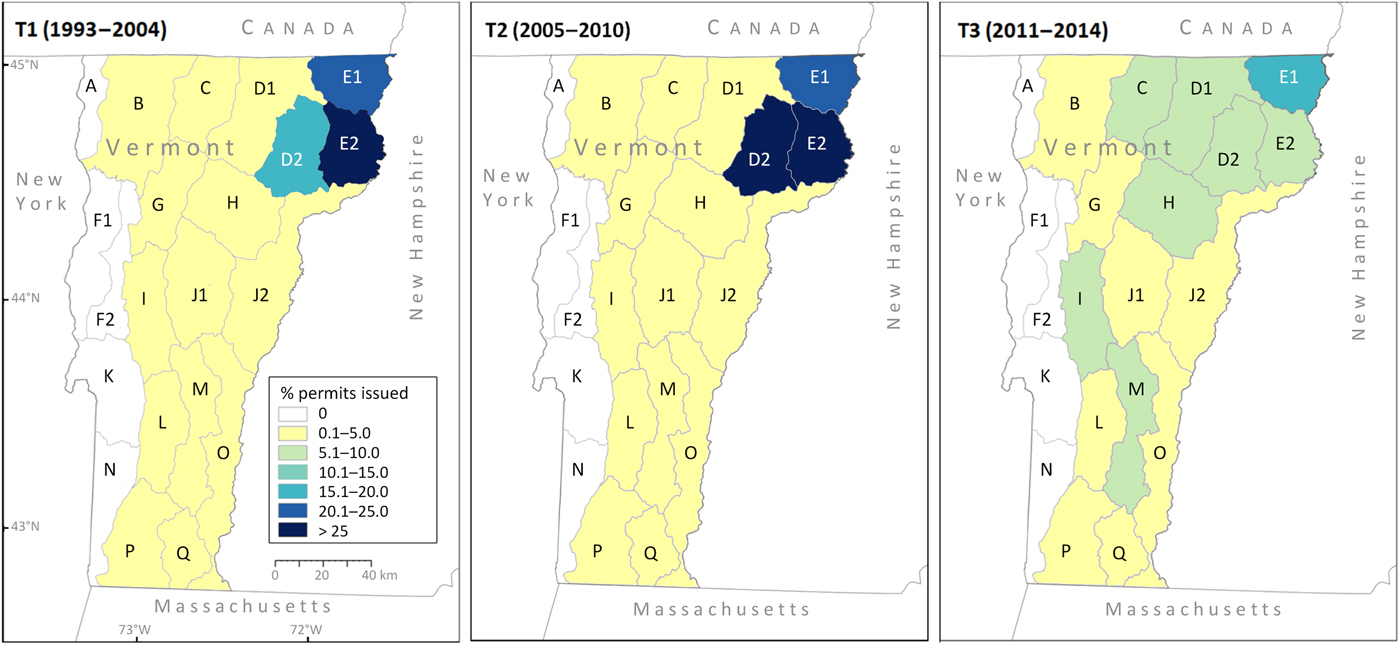
Fig. 2 Spatial distribution of moose hunting permits in % of all permits issued in Vermont, for the three time periods considered (note there were no values in the 10.1–15.0% category).
To examine how the geographical distribution of permits affects the economy of the residents in each WMU, we combined (Fig. 3) the results from Table 1 with the geographical distribution of permits (Fig. 2). During T2 more permits were allocated to WMUs with lower household income (e.g. in WMU E2, in the north-east of the state, hunting permits contributed 2.74% to the local economy, a comparatively high percentage). However, during T3 the permits were more homogeneously distributed amongst WMUs, and therefore did not focus the benefits on residents in the WMUs with a lower household income. For example, WMU E2 is one of Vermont's WMUs with the lowest mean household income: its share of allocated permits decreased from > 25% in T2 to 5–10% in T3. This resulted in a lower contribution of moose hunting to the WMU's economy (from 2.74% in T2 to 0.53% in T3). Similarly, the economy of WMU E1 declined from T1 to T2, and the share of permits allocated to this WMU also decreased during this period, from 20–25% in T2 to 15–20% in T3. Consequently, the contributions of moose hunting to the economy of this WMU dropped from 3.49% in T2 to 2.28% in T3.

Fig. 3 Median household income in USD/year aggregated by WMUs. The per cent contribution of hunters’ expenditures to the economy of each WMU is given in parentheses.
Discussion
Natural resource management decisions mediate who benefits from ecosystem services and by how much. However, for some services, interventions that secure services for one group may negatively affect others (Daw et al., Reference Daw, Brown, Rosendo and Pomeroy2011; Fisher et al., Reference Fisher, Bradbury, Andrews, Ausden, Bentham-Green, White and Gill2011). Here, we examined the impacts of moose hunting permit allocation (i.e. the formal institution mediating people's access to hunting opportunities) on hunters (those who benefit from hunting experiences and moose meat) and residents (those who live in municipalities in hunting areas, and therefore potentially benefit from hunter's expenditures). We found that changes in the allocation of hunting permits over time affected the two groups differently.
Since 2008 the number of permits issued per year has declined progressively, even when a sustainable moose population size, established by the Vermont Fish & Wildlife Department (2012), was reached in 2011. Considering that the number of permits per year is a function of moose population data (e.g. a result of reproduction and offtake), that the number of permit applications has remained relatively constant at c. 12,000 (Fig. 1), and that the annual number of moose hunting permits declined until it reached a record low of 13 permits in 2018 (Vermont Fish & Wildlife Department, 2018b), we conclude that the present strategy for moose management in Vermont (which traditionally relied on hunters to control moose population) is no longer effective. At the current rate of moose population decline, soon either moose hunting will be completely forbidden, or moose hunters will no longer have prey.
The number of permits allocated affected the number of people who benefited from moose hunting. We found the number of hunters was positively related to the number of permits issued, an expected result given that permit applications surpassed permit availability every year (Fig. 1). In contrast, an increase in the number of permits did not necessarily increase the number of people receiving benefits from the hunters’ expenditure, because a large number of permits could be assigned to few WMUs containing municipalities with small human population sizes, instead of being distributed amongst more populated WMUs. These differing effects on hunters and residents were explained by the scale at which each group derived benefits (Turner et al., Reference Turner, van den Bergh, Söderqvist, Barendregt, van der Straaten, Maltby and van Ierland2000; Hein et al., Reference Hein, van Koppen, de Groot and van Ierland2006). Individual hunters benefited from being awarded a permit, whereas residents benefited when permits were allocated to their WMU. This demonstrates the interactions between beneficiary groups, i.e. benefits to residents depend on those to hunters.
The spatial distribution of permits amongst WMUs also affected who benefited from moose hunting (Fig. 2). Our results indicate that permit allocation, and subsequent changes in permit numbers and spatial distribution, have an influence on who benefits from moose hunting. Since permits are being more homogeneously allocated across the state, WMUs containing municipalities with a lower social-economic status are no longer the main beneficiaries. Beyond our analysis, failing to incorporate demographic data of residents into management decisions risks inequitable distribution of costs and benefits amongst this group (Daily et al., Reference Daily, Polasky, Goldstein, Kareiva, Mooney and Pejchar2009; Daw et al., Reference Daw, Brown, Rosendo and Pomeroy2011).
In addition to affecting who benefits from hunting, we also expected an effect of permit allocation on how each group benefited. Hunters benefit from recreational experiences and harvested moose meat. If we were to quantify these benefits as the number of harvested moose, increasing the number of permits would increase total benefits, although benefits per hunter would remain constant. However, if different indicators were used, such as the weight of moose meat harvested or hours spent hunting, increasing permit numbers may have a different effect on hunters (Brooks et al., Reference Brooks, Smith, Holland, Poppy and Eigenbrod2014). Although we did not quantify this, we would expect increasing permit numbers to increase benefits to residents of WMU areas, but if the number of residents increased at the same time, the potential benefits enjoyed per resident would decrease. Future research should establish relationships between permits and benefits to both hunters and residents; in Vermont this task is currently limited by poor data availability.
Our results illustrate implications for managing moose hunting in Vermont. Hunters and residents derived benefits from moose hunting in different ways. We also found that changes in the allocation of hunting permits over time affected each group differently and that managing moose hunting for one group did not always benefit the other. For example, allocating more permits increased the number of hunters but not necessarily the number of people who benefited as residents of WMUs in which hunting occurred (Figs 2 & 3); whereas allocating permits more homogenously across Vermont increased the total number of benefiting residents, but not those from groups with a lower socio-economic status (Fig. 3). According to the Vermont Fish & Wildlife Department (2009), a primary goal of current management plans is to benefit both hunters and residents. However, our results suggest that managing ecosystem services to benefit both hunters and residents requires explicit consideration of both groups, including how they interact with each other and how they respond to management.
Many recreational services have multiple groups of beneficiaries (Daniel et al., Reference Daniel, Muhar, Arnberger, Aznar, Boyd and Chan2012), and managing ecosystem services to ensure equitable distribution of benefits amongst different groups is challenging (Daily et al., Reference Daily, Polasky, Goldstein, Kareiva, Mooney and Pejchar2009). A necessary, albeit difficult, first step is to identify the full suite of human beneficiaries for each ecosystem service, and to divide them into meaningful groups (Daw et al., Reference Daw, Brown, Rosendo and Pomeroy2011). Here, we investigated two groups (hunters and residents), but others may exist. For example, the Vermont Fish & Wildlife Department benefits from hunting permit revenue. Another example would be the tourist sector, which draws benefits from the tourists who expect to see live moose. In addition, there are different ways of grouping beneficiaries, e.g. male vs female (Porter et al., Reference Porter, Mwaipopo, Faustine and Mzuma2008), private vs public interests (Polasky et al., Reference Polasky, Nelson, Pennington and Johnson2011), or in-state vs out-of-state (Auger, Reference Auger2006; Sonter et al., Reference Sonter, Watson, Wood and Ricketts2016). Finally, some groups may be negatively affected by the provision of a given ecosystem service (Lyytimäki, Reference Lyytimäki2015) and costs to these groups should also be considered. In the context of recreational hunting, this may include farmers who suffer crop damage from an abundance of game species (Knoche & Lupi, Reference Knoche and Lupi2007).
Given the many possible ways of grouping beneficiaries of ecosystem services, future research should test when differences between beneficiary groups are important to consider and develop indicators to distinguish between such groups. We suggest three guiding questions for this process: (1) Do beneficiaries derive benefits through different pathways? (2) Do groups of beneficiaries occur at different scales or have different demographic profiles? (3) Do they respond differently to management interventions? We also recommend that assessments consider all beneficiaries of ecosystem services first, before aggregating them by beneficiary groups. This approach differs from current practice, which values benefits first and disaggregates benefits among beneficiaries second. The current practice risks missing important interactions and potential trade-offs between beneficiary groups.
Conclusions
Ecosystem services are often managed to secure the benefits they provide to people. However, for services that benefit multiple groups of people, managing the benefits for one group may also affect others. Our case study on recreational moose hunting in Vermont, USA, provides evidence that management decisions must consider multiple beneficiary groups to equitably distribute the costs and benefits of ecosystem services. We show how a singular natural resource management decision (allocation of moose hunting permits) can have heterogeneous effects on different beneficiary groups (hunters and residents), and how these groups derive benefits through different processes.
We have used hunting as an example of a recreational ecosystem service with multiple beneficiary groups that could be affected differently by management decisions. However, other ecosystem services may have a similar setting, in particular recreational services derived from activities practised in nature such as ecotourism, mountain biking or wildlife watching. Because these activities are practised in areas that are often rural and economically depressed, they have the potential to become an important economic engine for the region. We therefore argue that further research is needed to examine whether similar relationships occur for other ecosystem services, and to determine when grouping beneficiaries in different ways is pertinent.
Acknowledgements
We thank staff at the Vermont Fish & Wildlife Department, particularly Cedric Alexander, Scott Darling, Tony Smith and Kim Royar, for supplying moose harvest GIS data and insight on big game management in Vermont. We also thank T. Donovan and S. Pearman-Gillman from the University of Vermont and J. Johnson from the University of Minnesota for support and helpful discussions during project development. LJS received support from an USDA McIntire-Stennis award #2014-32100-06050 to the University of Vermont.
Author contributions
Study design, data analysis and writing: all authors; data collection: NG and LGS.
Conflict of interest
None.
Ethical standards
This research abides by the Oryx guidelines for ethical standards.


