


Accurate and reliable data on prevailing food habits are prerequisites for comparisons with national nutrition recommendations, and also for the formulation of sound food-based dietary guidelines (FBDG), the ‘translation’ of nutrient recommendations into foods(1–Reference Sandström3). Despite this, no system of regular national surveys of children and adolescent diets is in place in Sweden. A dedicated national survey among children was carried out in 2003 by the Swedish Food Administration(Reference Barbieri, Pearson and Becker4), and before that children were included in a general national diet survey in 1989(Reference Becker5) and in a multi-centre study in 1980–1981(Reference Hagman, Bruce and Persson6). Sweden is not unusual in its lack of a national dietary surveillance system for children. An analysis of intakes around Europe in 2004 found that a national children’s survey was either lacking or quite out of date in many countries(Reference Lambert, Agostoni and Elmadfa7). Well-conducted dietary studies at the regional or even local level can therefore be of use in supplementing the information available at the national level.
Several studies have suggested that intakes of saturated fat and sucrose are consistently higher than recommended among Swedish children(Reference Barbieri, Pearson and Becker4, Reference Garemo, Lenner and Strandvik8) and adolescents(Reference Samuelson9–Reference Sjöberg, Hallberg and Höglund12). As a result of the national survey, which was based on 2495 children aged 4, 8 and 11 years, it was recommended that children of these ages should essentially follow the existing Nordic FBDG for adults(13); specifically, they should choose skimmed milk instead of standard and reduced-fat milk, choose lower-fat cheeses instead of high fat, choose leaner meats over high-fat meat products, replace a meat dish with a fish dish once a week, choose fluid fats in cooking instead of hard fats, and also halve the amount of confectionery, baked goods and snacks eaten. Water should also replace some of the soft drinks consumed(Reference Barbieri, Pearson and Becker4).
The European Youth Heart Study (EYHS) is a study of CVD risk factors, of which diet is an established one, in healthy children and adolescents(Reference Riddoch, Edwards and Page14). From initial exploratory work on the Swedish participants of EYHS, we suspected high intakes of saturated fat and sucrose in the study population of 9- and 15-year-olds (unpublished results). We were therefore interested to see whether adherence to these FBDG would be sufficient to bring the intakes of the children in our sample in line with the recommendations. We also examined the effect the guidelines might have on the diets of adolescents, an age group that was not included in the aforementioned national survey.
The aims of the present study were: (i) to compare the energy and macronutrient intakes in a sample of Swedish children and adolescents to the Nordic nutritional recommendations; (ii) to describe the major food sources of energy and selected macronutrients (total fat, saturated fat and sucrose) in this sample; and (iii) to estimate the effect adherence to current FBDG would have on population-level intakes of saturated fat and sucrose.
Subjects and methods
Subjects
Over 2000 (n 2313) Swedish Grade 3 children (9 years old) and Grade 9 adolescents (15 years old) were invited to participate in EYHS, conducted in 1998–1999. The subjects were from classes selected from forty-two schools in Southern Stockholm and Örebro, and 1137 students consented to participate. Permission was obtained from the local ethics committees (Huddinge University Hospital no. 474/98 and Örebro City Council no. 690/98). A parent or legal guardian provided written consent; the subject provided verbal consent. A description of the sampling procedure together with a detailed non-participation study has been published, which identified no clear reason for non-response and concluded that the sample was generally representative(Reference Hurtig-Wennlöf, Yngve and Sjöström15). All data collection was performed on the school premises. A questionnaire completed by parents provided, among other things, information on the highest level of education achieved. Mother’s education was used to check for differences in dietary intakes between subjects, which could be attributable to differences in socio-economic status. In a follow-up study of these subjects, it was low maternal education (<9 years), rather than income or either paternal eduction or income, that predicted continued participation(Reference Grjibovski, Bergman and Hagströmer16).
Dietary assessment
The subjects completed a single 24 h recall, performed by a nutritionist who had undergone study-specific training. The younger children completed a 1 d qualitative food diary, with the assistance of their parents on the day before the interview, to aid as a prompt in case of difficulties with recall. A food atlas with pictures of common foods in various portion sizes was available during the interview, along with standard household units to help estimate quantities accurately. Data from the recall were analysed using dietary analysis software (StorMats, version 4·02; Rudans Lättdata, Västerås, Sweden) based on the Swedish Food Administration’s nutritional database (version 99·1; www.slv.se). When a mixed dish was reported, standard recipes from the Swedish Food Administration were assumed where no other information was available. Each food was allocated to a food group based on nutritional or dietary similarities and intakes are presented at the food group level. Most groups are self-explanatory, with the following clarifications: the ‘milk, fil, yoghurt’ group includes both sweetened and unsweetened varieties; fil is a Nordic soured-milk product similar to yoghurt; ‘soft drinks’ refer to sugar-sweetened soft drinks; ‘light drinks’ are reduced-sugar or artificially sweetened drinks; ‘fruit juices’ refer to concentrated or fresh juices; ‘other sweet foods’ include desserts, including a small number of milk-based desserts, ice cream, sweet soups, jams and added sugar; ‘cereals’ refer to breakfast cereals (both sweetened and unsweetened); fried potatoes are included in the ‘chips, crisps’ group. A further division of some food groups was made as follows: ‘full-fat’ milk, fil and yoghurt had a fat content ≥2·5 %, ‘high-fat’ cheese had a fat content of > 17 %; ‘low-fibre’ bread was white bread and/or had a fibre content of < 7 %; ‘high-fat’ spreads and oils had >40 % fat; ‘burgers, sausages’ were mostly processed and had a median fat content of 13 % (inter-quartile range (IQR) 9–23 %) compared to 6 % (IQR 5–17 %) for all other meats and meat dishes. As data were collected in schools, dietary interviews were conducted between Monday and Friday, which meant that no dietary intake data were available for Fridays or Saturdays.
Sources of macronutrients
To determine the contribution of food groups to macronutrient intake, the population proportion method was used. This measure is less influenced by within-person variation than the individual proportion method and more closely approximates the true group mean when surveys of short duration are used(Reference Krebs-Smith, Kott and Guenther17). The formula is:
where Fi is the amount of the nutrient contributed by a particular food group for the ith individual; Ti is the total amount of the food component from all foods for the ith individual; and n is the number of individuals in the population. In other words – to use the example of saturated fat and cheese – this is the sum of all saturated fat from cheese consumed by the population, divided by the sum of all saturated fat consumed by the population. The ten food groups contributing most to the intake of each nutrient are presented.
Calculation of compliers
To identify ‘compliers’ with the population goal, subjects are first ranked in ascending order according to the percentage of energy (%E) in their diet from the nutrient in question. The group mean is calculated starting with the smallest possible group (i.e. the first two subjects with the lowest intakes). Group membership is widened and the mean is re-calculated until the group mean is such that the addition of one more person would cause it to exceed the population goal(Reference Wearne and Day18). The percentage of subjects within the group is the percentage of compliers.
Simulations of adherence to food-based dietary guidelines
The scenarios simulated were as follows: (i) all high-fat cheese is replaced with low-fat cheese (≤17 % fat); (ii) all full-fat and reduced-fat milk is replaced by skimmed milk (≤0·5 % fat); (iii) the intake of sweets and chocolate, cakes and biscuits, chips and crisps and other sweet foods is halved; (iv) the intake of sugar-sweetened soft drinks is halved; and (v) the ratio of high-fat meat products (burgers and sausages) to other meat products is reversed (from 67:33 to 33:67).
The potential effect of these on intakes was calculated as follows: first, the proportion in which the foods were originally consumed was calculated. To continue with the example of saturated fat and cheese, the ratio of x:y was calculated where:
Second, target proportions based on the FBDG were chosen: a and b. To continue the cheese example, the target % intake of high-fat cheese is 0 (a) and that of low-fat cheese is 100 (b). The amount of saturated fat provided by that food group at its original proportion was multiplied by the new target proportion:
Third, the difference between the saturated fat intake based on the target intakes and the original intakes was calculated and the %E from saturated fat was adjusted accordingly.
For the simulations, it was necessary to make a number of assumptions: all subjects made the change in question, from one food type to another, but that portion sizes or the number of consumers did not change; any reduction in energy intake resulting from these changes was not compensated for by another source; the intake and mix of foods in a food subgroup remained constant.
Energy under-reporting
In order to identify subjects who may have under-reported their dietary intake, we calculated CI for plausible energy intakes required for weight maintenance based on BMR and estimated physical activity levels for age and gender, as described by Goldberg et al.(Reference Goldberg, Black and Jebb19), using values proposed by Black(Reference Black20). Subjects with energy intakes below the lower cut-off were considered possible under-reporters. Owing to the uncertainty in identifying under-reporters, particularly when only 1 d of dietary data are available(Reference Black21), we chose not to exclude these subjects. Instead, we analysed the data with and without them and considered the effect exclusion would have on the intakes of macronutrients and in determining the sources of macronutrients. Weight and height were measured without shoes, with the child wearing light clothing (underwear and T-shirt). A calibrated electronic scale and a portable Leicester stadiometer (both from Seca Inc., Hanover, MD, USA) measured weight to the nearest 0·1 kg and height to the nearest 5 mm, respectively. Overweight status was determined by comparing BMI (kg/m2) to international cut-offs established by Cole et al.(Reference Cole, Bellizzi and Flegal22), and BMR was estimated(Reference Schofield23).
Statistical analysis
Non-parametric Mann–Whitney U tests were performed to compare energy from macronutrients between possible under- and non-under-reporters, between subjects with mothers with university education and those without, and between normal weight and overweight/obese subjects. The level of statistical significance was set at P = 0·05. Analysis was conducted using the Statistical Package for Social Sciences statistical software package version 17.0 (SPSS Inc., Chicago, IL, USA).
Results
Compliance with population goals
Complete dietary recalls were performed for 1120 subjects – 551 children (52 % girls, mean age: 9·6 years) and 569 adolescents (55 % girls, mean age: 15·5 years). The %E from macronutrients shows that the intakes of saturated fat and sucrose were above the recommended levels (Table 1). With regard to maternal education and weight status, statistically significant differences were seen in 15-year-old girls, where those whose mothers had university-level education had significantly lower fat (29·9 v. 30·1 %E, P = 0·017) and higher carbohydrate (55·2 v. 52·5 %E, P = 0·004) intakes than their peers; and in 9-year-old boys, where overweight/obese boys had significantly higher fat (35·0 v. 32·5 %E, P = 0·004) and saturated fat (16·3 v. 14·9 %E, P = 0·001) intakes and lower carbohydrate (49·1 v. 51·5 %E, P = 0·024) intakes than their normal weight peers. No other significant differences were seen in any age or gender subgroup. More children than adolescents complied with the goal for sucrose, whereas more adolescents than children complied with the total fat and saturated fat goals. A fifth of all subjects and 8 % of 9-year-old boys complied with the goal for saturated fat.
Table 1 Dietary and background characteristics of the sample
NNR, Nordic Nutrition Recommendations (population goals); %C, percentage complying with NNR; %E, percentage of total energy; NA, not applicable.
*Energy intake below cut-offs as determined by Goldberg et al.(Reference Goldberg, Black and Jebb19) (see Methods section).
†Duration of maternal education is ≥9 years.
Sources of energy and macronutrients
The two food groups, milk, fil and yoghurt, and meat and meat dishes, were among the three biggest contributors to energy, total fat and saturated fat in the present sample, together with bread (energy), spreads and oils (total fat), and cheese (saturated fat; Tables 2–4). Soft drinks, sweets and chocolate and other sweet foods were the biggest sources of sucrose in the diet (Table 5). Foods that could be considered to have a low nutrient density accounted for almost one-fifth of energy, total and saturated fat and the majority of sucrose intakes (Fig. 1).
Table 2 Major food group sources of energy for all, and by age and gender

The order of ranking is determined by the ten main contributors to energy for ‘all’. Where a food group outside the top ten for ‘all’ is one of the ten main contributors in an age and gender subgroup, the contribution from that food group is also shown.
*Subgroups of a food group are not considered in the ranking.
Table 3 Major food group sources of total fat for all, and by age and gender
*Subgroups of a food group are not considered in the ranking.
Table 4 Major food group sources of saturated fat for all, and by age and gender
*Subgroups of a food group are not considered in the ranking.
Table 5 Major food group sources of sucrose for all, and by age and gender
*Subgroups of a food group are not considered in the ranking.
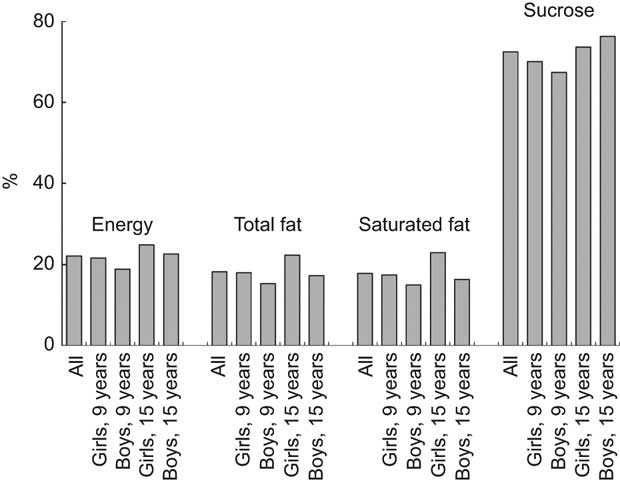
Fig. 1 Contribution of energy-dense, nutrient-dilute food groups to energy, total fat, saturated fat and sucrose intakes
Energy under-reporting
Excluding subjects identified as possible under-reporters (7·5 %) did not change the mean %E from any macronutrient significantly, except for 15-year-old boys where protein intakes in under-reporters were lower (P = 0·049, data not shown). The sources of energy, fat, saturated fat and sucrose also did not differ considerably (data not shown). Thus, we considered the effect of any under-reporting to be small and all subjects were included in the simulation analysis.
Effect of adherence to existing food-based dietary guidelines
The simulated effect of full adherence on saturated fat and sucrose intakes is provided separately for each scenario and also in combination (Table 6). The biggest reduction in saturated fat intake was obtained by switching all full- and reduced-fat milk to skimmed milk. Halving the intake of sweet foods and snacks (scenario 3) would also reduce saturated fat intakes and would have the biggest impact on sucrose intakes. A combination of all strategies would theoretically reduce the saturated fat intake by approximately 4·5 percentage points, and the sucrose intake by 3·5 percentage points.
Table 6 Effect of altering food intakes on the population mean of energy from saturated fat and sucrose
*Change in percentage points of energy from saturated fat/sucrose.
†Low-fat cheese contains ≤17 % fat; reduced-fat milk products contain ≤1.5 % fat; skimmed milk products contain <0.5 % fat.
‡Other sweet foods include desserts, ice cream, sweet soups, jam and sugar.
§From approximately 66 % of all meat consumed to 33 %.
Discussion
High intakes of saturated fat
The mean intakes of the subjects in our study were relatively close to the population goals for total fat, protein and carbohydrates, but did not meet the goals for saturated fat or sucrose intakes. This is in line with other recent Swedish studies in children and adolescents(Reference Garemo, Lenner and Strandvik8–Reference Samuelson, Bratteby and Mohsen10, Reference Sjöberg, Hallberg and Höglund12, Reference Sepp, Lennernas and Pettersson24), including the only recent national survey in children(Reference Barbieri, Pearson and Becker4), in which the high intakes of saturated fat and sucrose were highlighted as a cause for public health concern. Despite the broad range of ages covered by these studies and the variety of dietary assessment methods used, the intakes of saturated fat do seem to be consistently above the recommended level. Barbieri et al.(Reference Barbieri, Pearson and Becker4) also compared the intakes of their sample to the 1989 and the 1980–1981 large-scale Swedish studies(Reference Becker5, Reference Hagman, Bruce and Persson6) and showed that while the intakes of total fat and saturated fat have clearly decreased in the past two decades in the three age groups studied, the mean energy intakes remain above 30 % and 10 %, respectively. Bergström et al.(Reference Barbieri, Pearson and Becker4) observed a similar pattern in Swedish adolescents(Reference Bergström, Hernell and Persson11) and it would also seem to mirror the trend generally seen in Western Europe regarding persistently high intakes in children and adolescents(Reference Lambert, Agostoni and Elmadfa7).
This is of concern because of the importance of diet to health and chronic disease prevention(25) and the fact that childhood and adolescence are periods of growth, habit development and preparation for a healthy life(26). CVD remains one of the most common chronic diseases; it creates huge economic burden(Reference Leal, Luengo-Fernandez and Gray27) and is the culmination of lifelong exposure to chronic atherogenic risk(Reference Lewis28, Reference Lusis29), beginning in childhood(Reference Gidding, Dennison and Birch30–Reference Aboderin, Kalache and Ben-Shlomo32). The link between fatty acid intake and CVD is well-studied and while it is not the only dietary factor of importance(Reference Rivellese33), based on the available evidence, advice to restrict intakes of saturated fat is justified(Reference Woodside, McKinley and Young34).
Population goals and compliance
Some level of consensus on goals for macronutrient intakes exist at the global(25), European(Reference Kafatos and Codrington35) and Nordic levels(13), where it is recommended that saturated fat and sugars should each provide <10 %E. As these goals are upper limits only – in recognition of the fact that these nutrients are not considered essential in the diet and no lower requirement is necessary – an intake above these goals is notable.
Compliance with the population goal for saturated fat intakes was generally low, particularly among the younger boys, where only 8 % were compliant. Although adolescent girls complied most with the total fat goal, only a third complied with the saturated fat goal, suggesting that while they might be receptive to the low-fat message, guidance is still needed on the quality of fat consumed. Compliance with the goal for sucrose was generally higher, but was lowest in the adolescent girl group, possibly reflecting the ‘sugar–fat seesaw’(Reference McColl36) phenomenon in which as the intake of fat decreases in the diet, the intake of sugar often increases. The measure of compliance used in the present study is more lenient than reporting the proportion of individuals who met a certain cut-off, and allows for some normal day-to-day variation in dietary intake.
Sources of energy, fat and sucrose
The foods identified as the major sources of energy, fat, saturated fat and sucrose in these children and adolescents closely match those found in the national children’s survey(Reference Barbieri, Pearson and Becker4). They reflect the traditional diet in Sweden, where milk and milk products, bread, meat and potatoes feature prominently. They also highlight the influence of foods that could be considered to be energy-dense, nutrient-dilute: sugar-sweetened soft drinks, sweets and chocolate, chips and crisps, cakes and biscuits and other sweet foods. These types of foods are not well defined and can be referred to in the literature as ‘junk’ foods(Reference Garemo, Lenner and Strandvik8) or ‘extra’ foods(Reference Rangan, Randall and Hector37). In our sample, they contributed approximately 20 % of all energy, fat and saturated fat, and two-thirds of all sucrose consumed. In the national children’s study, comparable food groups (but excluding chips and crisps) also contributed 20 %E(Reference Barbieri, Pearson and Becker4).
Food-based dietary guidelines
FBDG have been proposed as one tool to facilitate dietary behaviour change(2, Reference Sandström3, Reference Smitasiri and Uauy38). FBDG are the ‘translation’ of nutrient recommendations in order for them to be more easily understood and relevant to the target population. In order to be attainable, they should take into account the cultural context of the population for which they are developed(2), which means that prevailing dietary habits must be understood. The steps proposed in the formulation of effective FBDG increase in complexity from identifying foods rich in the nutrient in question, to identifying good sources of the nutrient, given the prevailing food consumption pattern, and identifying differences between those consuming more and less of that nutrient(2, Reference Sandström3).
The FBDG developed for adults in the Nordic countries emphasise low-fat cheese, skimmed milk products, lean meat and whole-grain cereals over their full-fat and refined alternatives, and increased fish, fruit and vegetable consumption(13). After the children’s national nutrition survey in 2003, because the intakes of concern in children’s diets mirrored those of adults, those FBDG were considered appropriate to recommend to children as well, with the addition of guidelines on baked goods, soft drinks, snacks and ice cream(Reference Barbieri, Pearson and Becker4). Although FBDG specifically for children or adolescents have not been developed yet in Sweden, based on our results regarding dietary sources, we would concur that the biggest contributors to saturated fat and sucrose are addressed by these guidelines.
However, from the simulations presented here of adherence to those guidelines, significant and widespread changes are needed. No one FBDG alone was enough to bring about the required changes in both saturated fat and sucrose intakes. Switching all full- and reduced-fat milk products to skimmed milk would have the biggest effect on saturated fat intakes in both age groups. Unsurprisingly, halving the intake of sweets, chocolate, baked goods, chips and crisps and other sweet foods would have the biggest impact on sucrose intakes. A combination of all strategies would theoretically result in population mean saturated fat and sucrose intakes that meet the national population goals. A similar study by Matthys et al.(Reference Matthys, De Henauw and Bellemans39) also demonstrated in a sample of Belgian adolescents that a combination of strategies was necessary to bring saturated fat intakes below the population goal. Our results suggest that almost complete adherence by all children and adolescents is required. The effect such drastic changes could have on other nutrient intakes should be evaluated. Peterson and Sigman-Grant(Reference Peterson and Sigman-Grant40) found that in American children, lower-fat food choices (particularly skimmed-milk) did not negatively impact overall nutrient intake, although a follow-up study by Sigman-Grant et al.(Reference Sigman-Grant, Warland and Hsieh41) highlights that this was contingent on the diet being otherwise balanced. However, while a halving of sweets, chocolate, soft drinks and baked goods might be effective in reducing both saturated fat and sucrose, the acceptability of such advice to consumers must also be considered. Quantitative research such as this can identify potential targets for guidelines, but qualitative research into consumer attitudes is also an important step in the process of FBDG development(1, Reference Smitasiri and Uauy38). If the current diet and food environment is so incompatible with current recommendations, then other options such as modification of the food supply might be required if FBDG are to ever be realistic(Reference Anderson and Zlotkin42, Reference Roodenburg, Feunekes and Leenen43).
For the present study, we chose to focus on food substitution rather than portion size, consumers or consumption frequency. The duration of the dietary recall meant that we did not have information on frequency and that the information on consumers was not considered accurate(Reference Lambe, Kearney and Leclercq44). We could not simulate all FBDG (e.g. substituting a meat dish with a fish dish, because we did not have intake data for a full week, or substituting fluid fats for solid fats in food preparation). The simulations presented here are necessarily simplistic. For example, the aim with FBDG should not be to reduce energy intake. If saturated fat is reduced, the choice of substitution nutrient matters(Reference Jakobsen, O’Reilly and Heitmann45). The simulations described here resulted in lower energy intakes, but it was not possible to evaluate what effect replacing the energy by other sources could have. Changes to alter the intake of one nutrient can affect other related nutrients, e.g. when total fat intake goes down, the intake of all fatty acids tends to go down(Reference Gibney46). In our simulation, a switch to skimmed milk products would appear to have the unintended effect of increasing sucrose intakes very slightly. As the fat content of products is reduced, sugar is often the replacement component, or at least increases in proportion to fat content, something that leads to the previously mentioned ‘sugar–fat seesaw’ effect at the diet level(Reference McColl36).
Methodological considerations
The recommendation that < 10 %E should come from sugars refers to ‘free’(2) or ‘refined’ mono- and disaccharides(13), i.e. those added to food and not naturally present. As the primary dietary disaccharide is sucrose, followed by lactose, found mainly in milk products, we chose to present here data on sucrose intake only. As such, we may have underestimated the intake of sugars. Similarly, the recommendation for < 10 %E to come from SFA also includes trans fatty acids. Here, we only considered saturated fat and again may have underestimated the intake slightly. As previously mentioned, no adjustment was possible to compensate for the decrease in energy and so the proposed changes may have been overestimated. Although these data are several years old (collected in 1998–1999), our findings are consistent with the more recent national survey(Reference Barbieri, Pearson and Becker4), based on data gathered in 2003. In addition, the goals against which these intakes were compared have not changed since then. As we had data from a single 24 h recall, we presented all data at the group level. A 24 h recall is considered to capture intake relatively well at this level, assuming that the errors associated with it are random, not systematic(Reference Beaton, Burema and Ritenbaugh47). We examined the effect that under-reporting might have had on our results, an important consideration in any dietary study. As well as usual inter-individual intake differences from day to day, dietary intake may differ by day of the week, e.g. intakes of sweets and chocolate are often higher at the weekend(Reference Sepp, Lennernas and Pettersson24). We do not have data for intakes on Saturdays, and only 16 % of recalls referred to Sundays, which means it is possible that we have actually underestimated the true contribution of these foods. We did, however, gather data over an entire school year, meaning that the effect of seasonal variation in food intake should be negligible.
In conclusion, the dietary intake of Swedish children and adolescents in the study sample did not meet the population goals for saturated fat and sucrose, consistent with other studies. We have demonstrated that intakes can theoretically be brought into line with the goals if the currently recommended FBDG are adhered to. However, widespread compliance is necessary if saturated fat is to meet the goal, and the consumer acceptability of such guidelines needs to be considered.
Acknowledgements
The present study was supported by the Stockholm County Council. The authors have no conflict of interest to declare. E.P. performed the analysis and drafted the manuscript; J.W., J.K. and M.S. contributed to the writing of the manuscript. M.S. was also responsible for the study in Sweden and oversaw data collection. All authors contributed substantially to the revision of the manuscript, and also read and approved the final manuscript. The authors would like to acknowledge the participants, their families and schools for their participation. They are also grateful to the colleagues who performed the field work.


