


In order to prevent non-communicable diseases, societies need to engage in evidence-based decision-making(Reference Beaglehole, Ebrahim and Reddy1,Reference Brownson, Gurney and Land2) . For this purpose, robust and accurate information on population-level health behaviours, such as diet, is essential. Most commonly, large, nation-wide surveys are used to monitor diet, but these methods entail a wide range of challenges such as difficulties in assessing diet(Reference Willett, Lenart and Willet3–Reference Westerterp and Goris6) and declining participation rates(Reference Tolonen, Helakorpi and Talala7,8) . The surveys aim for a representative sample, but in reality, certain population groups, such as women, highly educated and those with favourable health, tend to have higher response rates (selection bias)(Reference Tolonen, Helakorpi and Talala7,Reference Nummela, Sulander and Helakorpi9) . In addition, the aforementioned methods are slow to respond to, for example, rapid changes due to food policy measures (e.g. imposing or revising food-related taxes). As a result, surveys may under- or over-represent certain population groups and the data might already be outdated once the results are published. To overcome these problems, novel approaches to dietary assessment are constantly being developed. One such alternative is the use of grocery purchase data as an indicator of food consumption.
Grocery purchase data collection can vary from home food inventories, which describe the availability of foods and beverages in the home at a single point in time, to collecting purchase receipts or recording all purchased foods and scanning food purchases in the store(Reference French, Shimotsu and Wall10). Compared with traditional dietary assessment methods (e.g. food records, 24-h dietary recalls), the collection of grocery purchase data, if at least partly automated, can be less burdensome for both participants and researchers and, in theory, could reach more than a million individuals or households(Reference Aiello, Schifanella and Quercia11). However, it is not clear whether grocery purchase data can be used to assess individual-level food consumption, as the purchased foods may be consumed by other individuals and not all foods are purchased from one retailer(Reference Nevalainen, Erkkola and Saarijärvi12).
To date, a substantial body of literature concerning the concordance between grocery purchases and food consumption has started to accumulate. However, the number of studies is still small and as diverse data collection methods have been applied, caution must be exercised when interpreting the results. Nevertheless, at least a moderate correlation seems to exist between grocery purchases and individual-level food consumption(Reference Eyles, Jiang and Ni Mhurchu13–Reference de Oliveira, de Moura Souza and Levy19), although weaker associations have also been reported(Reference Lund, Watson and Smed20). The aforementioned studies have, however, required active participation, as grocery purchases were reported by the participants, which may have led to both misreporting and unrepresentativeness in the samples. In our recent study, automatically accumulating loyalty-card data on beer purchase frequency was found to associate with self-reported beer-drinking frequency(Reference Lintonen, Uusitalo and Erkkola21), but to the best of our knowledge, loyalty-card data have not been used to study the validity of grocery purchases as an indicator of food consumption.
In the current study, we examined (1) the associations between the participants’ food consumption and grocery purchases using purchase data from 1- and 12-month periods and (2) whether the strength of the associations differed in certain sub-populations (e.g. men and women, families with and without children). To fulfil these objectives, we compared the food consumption frequencies and grocery purchases of 11 983 participants using an exceptional data set of automatically accumulated loyalty-card data on grocery purchases.
Methods
Study sample
In June 2018, S Group (S-Ryhmä, a major Finnish retail chain with a market share of 46 % in 2018(22)) loyalty-card holders received an email asking for their electronic informed consent to obtain their purchase data from 1 September 2016 to 31 December 2018. We did not contact card holders who had no declared email address, those prohibiting the retailer contacting them for any marketing or research-related issues and card holders under 18 years of age. Altogether 47 066 participants consented to participate in the study (see Fig. 1 for participant flow chart). A more detailed description of the study design and sample has been published earlier(Reference Vuorinen, Erkkola and Fogelholm23). Before handover to the research team, the data were pseudonymised. The University of Helsinki Review Board in Humanities and Social and Behavioural Sciences reviewed the study and found it to be ethically acceptable (Statement 21/2018).

Fig. 1. The flow of participants in the current study. * Reasons for exclusions: (1) under 18 year of age or (2) card holder had prohibited any contact with marketing or research-related material.
Food consumption assessment
In June 2018, the consenting participants were randomly assigned to fill in one of the three electronic questionnaires developed for the study. Thus, a third (n 15 756, 33 %) of them filled in a FFQ describing their food consumption during the past month. Of these participants, 11 983 (76 %) provided FFQ data. The FFQ was designed to measure the whole diet of the participants and was based on a previous FFQ used in the DAGIS study(Reference Korkalo, Vepsäläinen and Ray24). It included fifty-two food items and had six answer options: not at all, less than once a month, on 1–3 days in a month, on 1–2 days in a week, on 3–5 days in a week and daily or almost daily. These were further transformed into times/week (0, 0·12, 0·47, 1·5, 4 and 6, respectively) to allow summation of consumption frequencies. We selected twenty-two FFQ rows for further inspection and collapsed them into eighteen food consumption variables describing the consumption frequencies of (1) fresh vegetables; (2) cooked and canned vegetables; (3) peas, beans, lentils and soya; (4) fruits; (5) berries; (6) skimmed milk and sour milk; (7) vegetable oils (used in cooking); (8) butter and butter-fat blends (on bread); (9) margarines (on bread); (10) fish dishes and fish products; (11) red meat; (12) white meat; (13) processed meats (cold cuts and sausages); (14) rye bread; (15) white bread; (16) sugar-sweetened beverages (juices and soft drinks); (17) chocolates and (18) sweets. The aforementioned foods were chosen on the basis of their role as indicators of a healthy diet. Online Supplementary Table 1 shows the consumption frequencies for the original FFQ rows.
Grocery purchase data
The original purchase data consisted of 4234 grocery product groups, which had been created by the retailer. Of these, 3340 (79 %) were included in the food group classification created for the LoCard study (https://locard.fi/inenglish/). A professional nutritionist reclassified the grocery product groups received from the retailer into nutritionally meaningful food groups. Mixed dishes and rarely purchased product groups with no definite primary ingredient (altogether thirty-eight product groups) were left unclassified. The current study used the purchase data of 1301 product groups, which were assigned into thirty-nine food groups and further collapsed into eighteen variables to allow comparison with the FFQ. The variables describe the purchases of (1) fresh vegetables; (2) cooked and canned vegetables, mushrooms and vegetable dishes; (3) peas, beans, lentils, soya and plant-protein products; (4) fresh, canned and frozen fruit; (5) fresh and frozen berries; (6) skimmed milk and sour milk; (7) vegetable oils; (8) butter-fat blends; (9) margarines; (10) fish dishes, fish products and fresh fish; (11) cooked and fresh red meat, meat patties and balls, offal and red meat dishes; (12) cooked and fresh poultry, poultry offal, patties and dishes; (13) cold cuts, ham, bacon and sausages; (14) rye bread; (15) wheat bread; (16) sugar-sweetened juices, soft drinks and energy drinks; (17) chocolates and (18) sweets (see online Supplementary Table 2 for matching the grocery purchase categories and FFQ rows). In the analyses, we used purchase frequencies (number of days on which food items were purchased) and purchase volumes (in kg) from 1- and 12-month periods preceding the collection of the questionnaire data, including the FFQ data. Purchase frequencies and volumes are shown in online Supplementary Table 3, and Supplementary Fig. 1 differentiates between the FFQ and purchase data types used in the analyses.
Background information
We obtained information on the participants’ sex and age from the retailer’s database. Using an electronic questionnaire, the participants reported how many members belonged to their household at that time. In addition, they were asked to separately report how many of the household members were 0–6-year-olds, 7–17-year-olds, 18–24-year-olds, 25–64-year-olds and 65-year-olds or older. Following closely the conventional family structure categories by Statistics Finland(25,26) , the participants were classified into five family structure categories: single-adult households, one adult and a child/children, two adults, two adults and a child/children, or other (households with three or more adults and households with unknown family structure).
Four categories (primary school or lower, upper secondary school, Bachelor’s degree or equivalent, Master’s degree or higher) were used to assess the participants’ educational level. In addition, the participants reported their household monthly income using seven predefined options ranging from less than 1500–9000 €/month or more. To calculate scaled monthly household income, the mean income in each of the categories was divided by the square root of household size(27). Scaled monthly household income was then classified into five categories (less than 1000, 1000–1999, 2000–2999, 3000–3999 and 4000 €/month or more). The participants also estimated how large a proportion of their overall household’s food purchases was bought from the retailer providing the purchase data (20 % or less, 21–40 %, 41–60 %, 61–80 % or more than 80 %).
Statistical methods
The FFQ data (food consumption frequencies in times/week) were divided into quarters using quartile classification. For certain food groups, the responses aggregated strongly, and thus, tertile classification was used for consumption frequencies of fresh vegetables, cooked and canned vegetables, legumes, red meat, white meat, chocolate and sweets. Each of the grocery purchase variables was categorised to a comparable scale (e.g. 1–4 or 1–3) based on cut-points defined by the quartiles and tertiles of their distribution.
We used gamma statistics(Reference Agresti28) with 95 % CI to study the relative validity of the purchase data, that is, the association between the ordinal categories (thirds or quarters) of the two sources of data (FFQ and purchase data)(Reference Willett, Lenart and Willet3). The gamma statistic measures the strength of association when both variables are ordinal and its value ranges from –1 to +1. Based on the cut-offs set by BMJ, we regarded gammas as very weak (0·19 or lower), weak (0·20–0·39), moderate (0·40–0·59), strong (0·60–0·79) or very strong (higher than 0·80)(29). In order to examine internal consistency(Reference Revicki and Michalos30), we compared the different types of grocery purchase data (purchase frequency and purchase volume during the past 1- and 12-month periods) with the FFQ data, separately for the eighteen food groups. In subgroup analyses, we calculated the gammas and 95 % CI comparing the FFQ and 12-month purchase data separately for (a) men and women, (b) single-adult households and two-adult families with no children, (c) one- and two-adult families with children, (d) participants with low (upper secondary school or less) and high (Bachelor’s level or higher) education, (e) households with low (less than 1000 €) and high (4000 € or more) scaled monthly income and (f) participants with low (60 % or less) or high (more than 60 %) degree of loyalty. Complete case approach was used for the subgroup analyses. Furthermore, as participants were assigned to categories (thirds or quarters defined by quantile cut points) based on both food consumption frequencies and 12-month volume of grocery purchases, we calculated the proportion of participants classified into the same, adjacent (+/–1), subsequent (+/–2) or opposite categories to describe the agreement between the two methods. We investigated the distributions of the differences to assess whether the two methods could rank the participants in the same order. We used free statistical software R (R Foundation for Statistical Computing, http://www.R-project.org/) for the analyses.
Results
Altogether 11 983 participants (76 % of those randomised to fill in the FFQ) provided FFQ data and were included in the analyses. Their mean age was 48 years (sd 15 years, range 18–93 years) and two-thirds of them were women (Table 1). Approximately one-third of the participants lived with another adult and had no children in the household, whereas a quarter of the participants lived in a single-adult household. In addition, a quarter of the participants lived in a household with a child or children. Two-thirds of the participants (64 %) reported that they made more than 60 % of their grocery purchases from the data-providing retailer.
Table 1. Descriptive characteristics of participants who provided FFQ data (numbers and percentages, n 11 983)

* Households with three or more adults and households with unknown family structure.
† Mean household monthly income divided by square root of household size reported by participants.
Table 2 describes the gammas for each of the food groups using the four different types of purchase data. Overall, the gammas ranged from 0·12 (cooked and canned vegetables) to 0·75 (margarines). The strongest associations were observed for skimmed milk and sour milk as well as for margarines: the gammas for these ranged between 0·63–0·74 and 0·63–0·75 depending on the type of grocery purchase data used. For butter and butter-fat blends, legumes and sweets, we detected mostly moderate gammas (0·48–0·53, 0·36–0·47 and 0·45–0·52, respectively), whereas for cooked and canned vegetables, the gammas were very weak (0·12–0·15). Different types of purchase data gave fairly similar associations. On average, the 12-month purchase volume showed slightly stronger associations with food consumption variables than other types of purchase data.
Table 2. Associations between quarters and thirds (depending on distribution of variables) of food consumption frequencies and grocery purchase frequencies and volumes over past 1- and 12-month periods; numbers shown are gammas and 95 % confidence intervals, n 11 543–11 926. Both FFQ and purchase data were categorised into thirds unless otherwise indicated
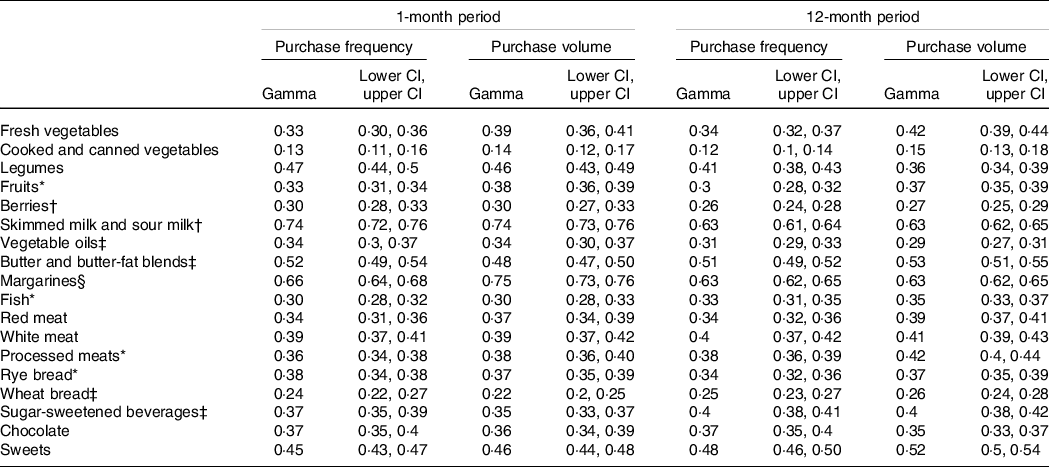
* Both FFQ and purchase data categorised into quarters.
† FFQ data categorised into thirds and quarters, thirds used for 1-month purchase data and quarters for 12-month purchase data.
‡ FFQ data categorised into thirds and quarters, thirds used for 1-month purchase frequency, quarters used for other purchase data.
§ FFQ data categorised into thirds and quarters, thirds used for 1-month purchase volume, quarters for other purchase data.
Figure 2 shows the comparison between different participant subgroups’ gammas. For most of the food groups, the gammas of men and women did not differ. However, women had higher gammas for red meat, legumes and processed meats, whereas men’s gammas were higher for fruits and vegetable oils. Not surprisingly, single-adult households had stronger gammas than two-adult families. However, the gammas of one- and two-adult families with children did not differ. Only a few differences were observed between levels of education, but for red meat, white meat and processed meats, participants with higher education had stronger gammas. Compared with the participants with a scaled household income of 4000 €/month or more, the participants with a scaled household income of 1000 €/month or less had higher gammas for fresh vegetables, legumes, fruits, and cooked and canned vegetables. For margarines, the gammas were stronger in the higher income group. Participants with more than 60 % of food purchases from the retailer had stronger gammas for all other food groups except for legumes, berries, and cooked and canned vegetables.
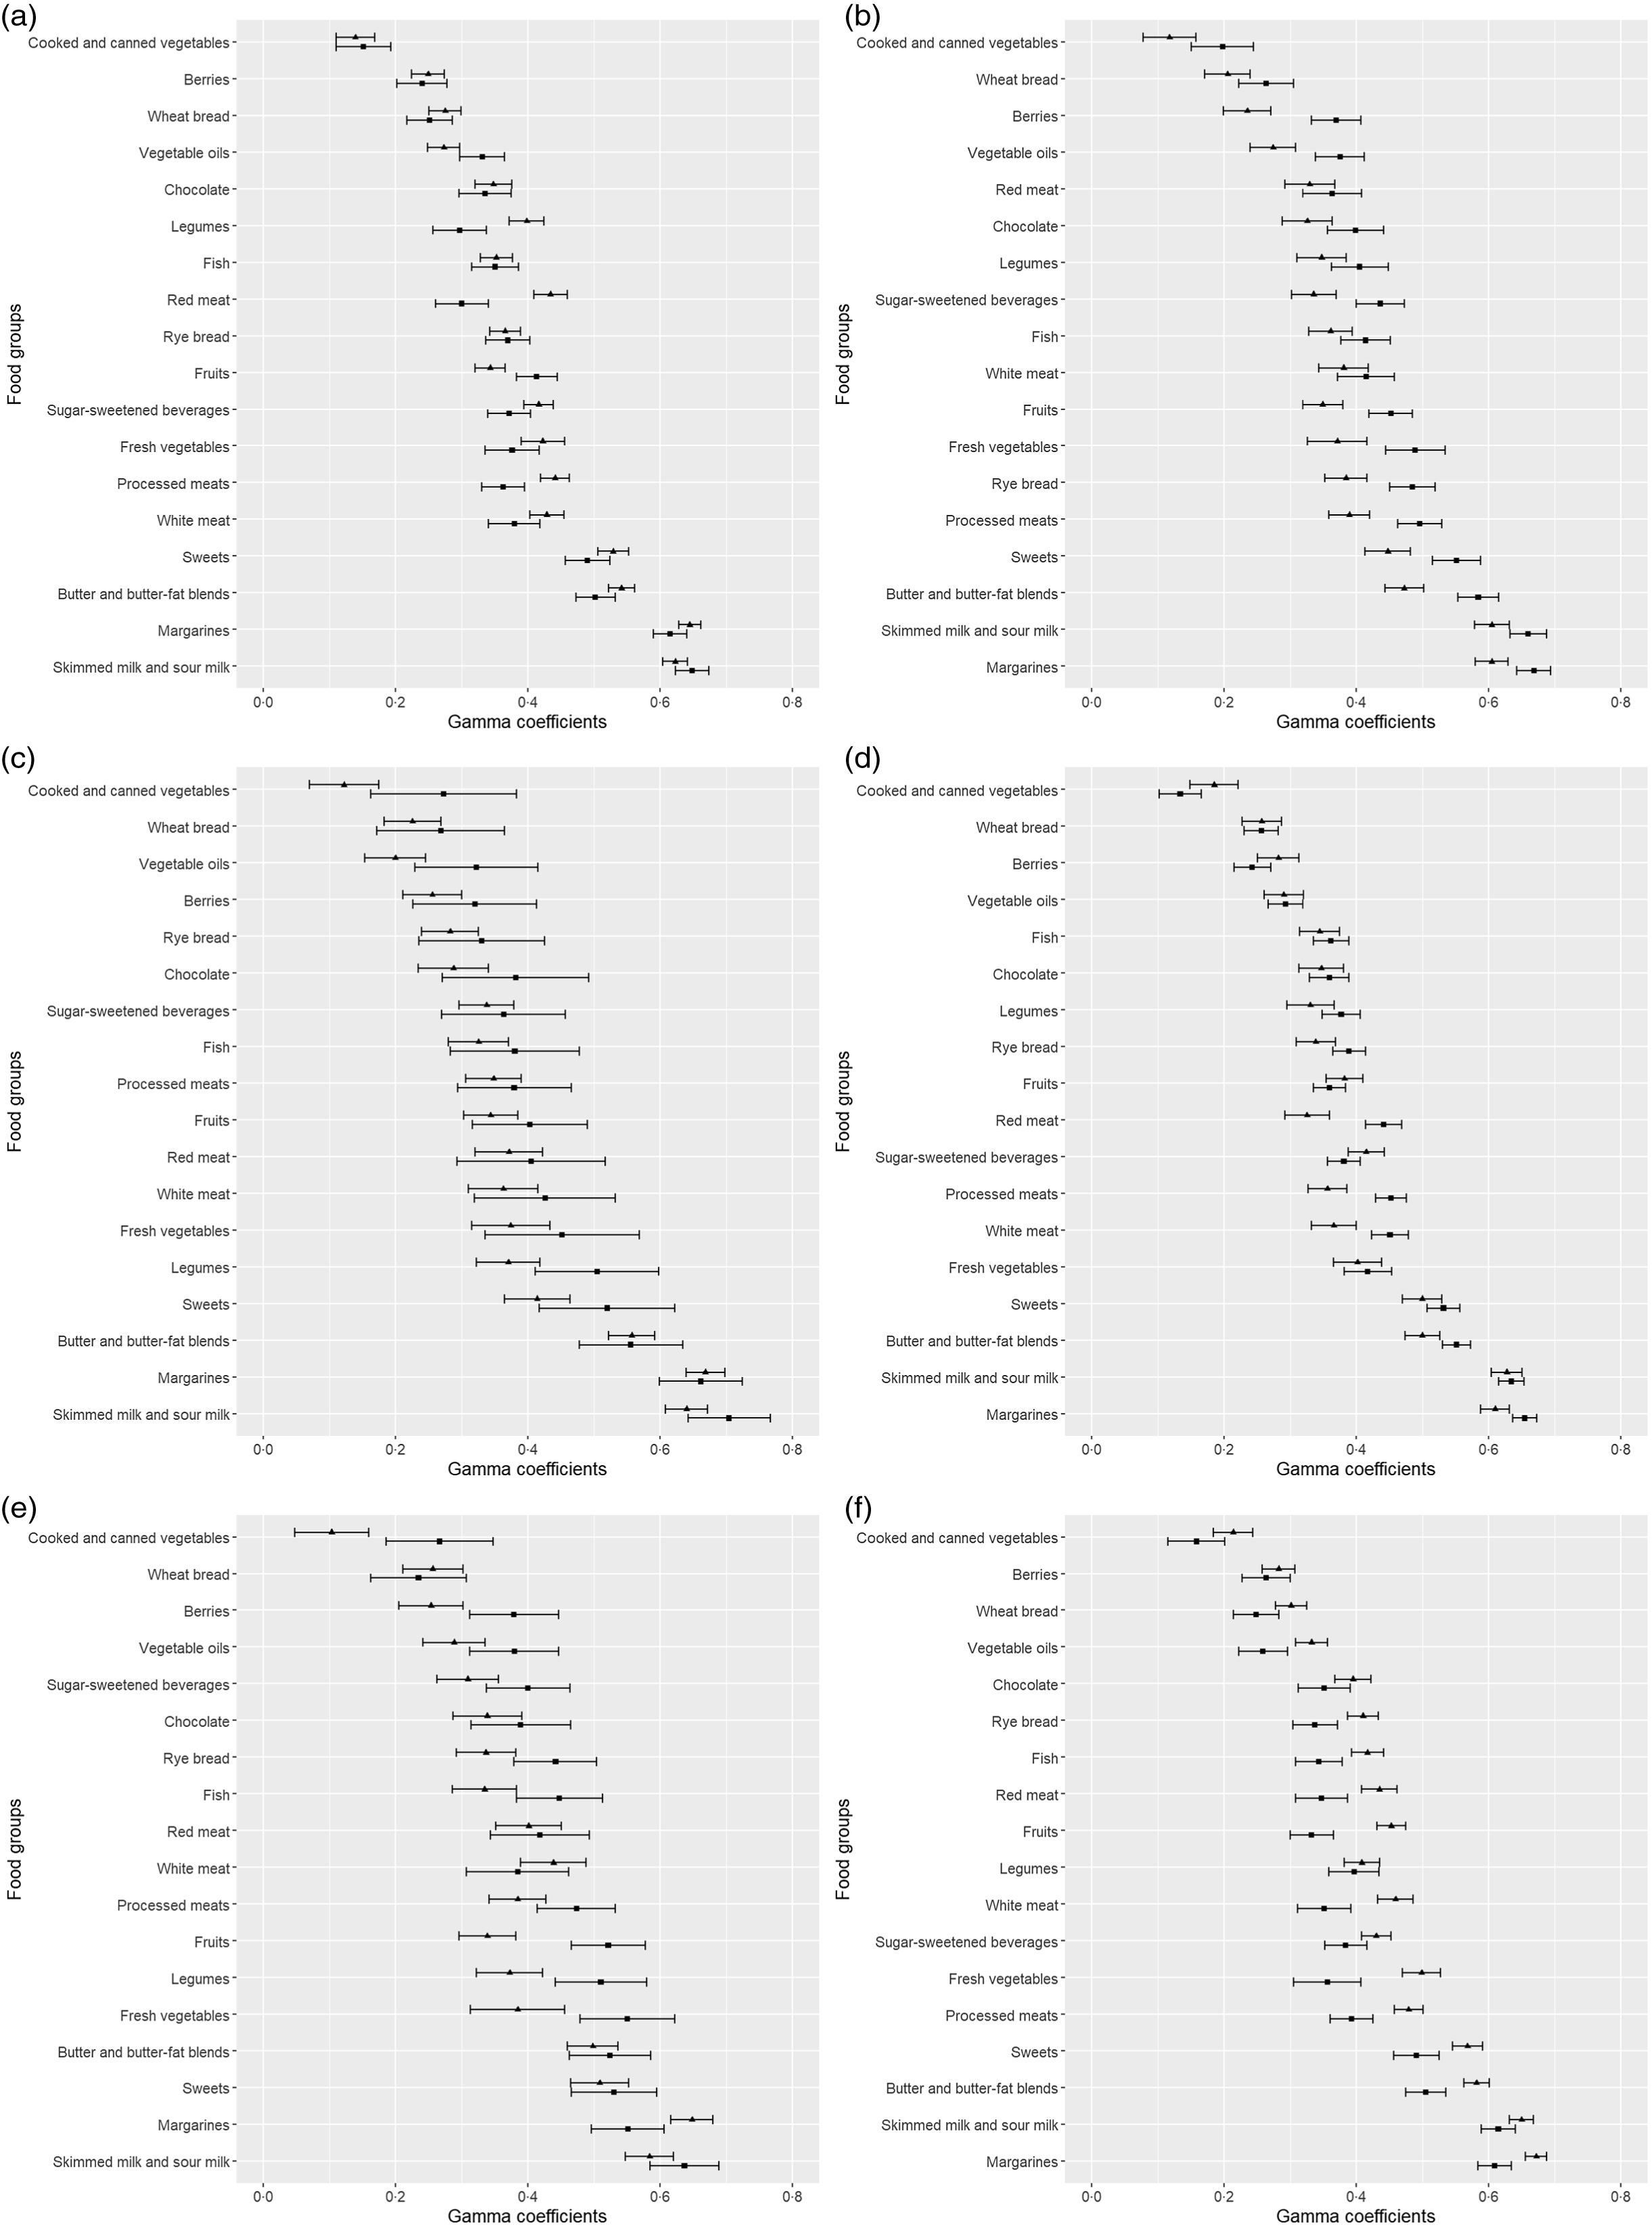
Fig. 2. The comparison of gammas between: men and women (a), single-adult households and two-adult families with no children (b), one- and two-adult families with children (c), participants with low and high education (d), participants with low and high scaled monthly income (e) and participants with low and high degree of loyalty (f). (a) Gender: ![]() , men;
, men; ![]() , women. (b) Family structure:
, women. (b) Family structure: ![]() , single household;
, single household; ![]() , two adults, no children. (c) Family structure:
, two adults, no children. (c) Family structure: ![]() , one adult and a child/children;
, one adult and a child/children; ![]() , two adults and a child/children. (d) Educational level:
, two adults and a child/children. (d) Educational level: ![]() , Bachelor’s degree or higher;
, Bachelor’s degree or higher; ![]() , upper secondary school or less. (e) Scaled monthly income:
, upper secondary school or less. (e) Scaled monthly income: ![]() , 1000 Euros or less;
, 1000 Euros or less; ![]() , 4000 Euros or more. (f) % of purchase from the retailer:
, 4000 Euros or more. (f) % of purchase from the retailer: ![]() , 60 % or less;
, 60 % or less; ![]() , more than 60 %.
, more than 60 %.
The proportion of participants classified into the same category using the FFQ and 12-month volume purchase data was 37–49 % for the food groups divided into thirds, and 31–49 % for the food groups divided into quarters (Fig. 3). Regarding sweets, red meat, skimmed milk and sour milk, margarines and processed meats, the two methods (FFQ data and purchase data) classified the participants relatively similarly (38–49 % of participants in the same category and 4–11 % in the opposite category). Largest discrepancies between the methods were observed for fresh vegetables, cooked vegetables, berries and vegetable oils (31–42 % of the participants in the same category, 12–21 % in the opposite category). For almost all food groups, the proportion of participants classified into the same or adjacent category was more than 70 %.

Fig. 3. Frequency distribution (in %) of participants classified into same, adjacent (+/–1), subsequent (+/–2) and opposite categories of FFQ and 12-month purchase volume data, n 11 543–11 926 (food groups divided into thirds on the left, food groups divided into quarters on the right). ![]() , in the same third;
, in the same third; ![]() , in the adjacent third (±1);
, in the adjacent third (±1); ![]() , in the opposite third (±2);
, in the opposite third (±2); ![]() , in the same quarter;
, in the same quarter; ![]() , in the adjacent quarter (±1);
, in the adjacent quarter (±1); ![]() , in the subsequent quarter (±2);
, in the subsequent quarter (±2); ![]() , in the opposite quarter (±3).
, in the opposite quarter (±3).
Discussion
This paper describes the relative validity of loyalty-card holders’ grocery purchase data as an indicator of food consumption. As the data accumulate automatically, the research process is minimally burdensome for the participants and enables recruitment of large samples, long-term follow-up and timely reactions following, for example, changes in pricing or food-related crises. Our study showed that the associations between food consumption and grocery purchase data were mostly reasonable, suggesting that loyalty-card data on grocery purchases can be used as a proxy for food consumption. To the best of our knowledge, this is the first study to compare automatically accumulating grocery purchase data and self-reported food consumption.
We found moderate associations (gammas ranging from 0·40 to 0·63) between grocery purchases and food consumption for skimmed milk and sour milk, margarines, butter and butter-fat blends, sweets, processed meats, fresh vegetables, white meat and sugar-sweetened beverages. The aforementioned foods are typically consumed at home as part of breakfast, dinner or evening snacks. Based on these results, it seems that the purchase volumes of these foods can, with caution, be used as a proxy for food consumption in future population-level studies, even though they cannot replace dietary assessment methods intended for extracting accurate individual-level data, such as food records or 24-h recalls. Previous studies have observed fairly similar associations using purchase records or participant-collected receipts: in a US study, the concordance between purchased and consumed vegetables was 0·39 (Lin’s concordance correlation)(Reference Appelhans, French and Tangney17), whereas a Danish study reported a Spearman correlation of 0·28 between participant-reported vegetable purchases and a dietary quality score(Reference Lund, Watson and Smed20). An earlier Swedish study reported acceptable differences (less than 20 %) between amounts of purchased and consumed foods for margarines, fish and fish dishes, and sweets, but not for vegetables, butter or milk(Reference Becker16).
The observed associations in our study were somewhat weak (gammas < 0·40) for legumes, fruits, berries, vegetable oils, fish, red meat, rye bread, wheat bread and chocolate, and the weakest (gamma 0·15) for cooked and canned vegetables. These results are not surprising, as for instance cooked and canned vegetables, legumes, berries, fish and red meat can be used as part of dishes, making it challenging to estimate consumption frequencies. Furthermore, larger households can have two or more food purchasers, whereas our data only covered the purchases of the main loyalty-card holder. Considering these issues, the obtained associations between purchased and consumed foods are reasonable and acceptable.
The comparison of concordances among different sub-populations yielded expected results. First, participants reporting a higher share of purchases from the retailer providing the purchase data had higher gammas. Similarly, the concordance was stronger for single-adult households than for two-adult families. The concordance for men and women was fairly similar across the food groups. Nevertheless, we observed higher gammas among women for red and processed meat, but concordance was lower for fruits. These findings could be partly related to social desirability bias: women might be more prone to responding in a manner consistent with societal norms(Reference Hebert, Ma and Clemow31), that is, to over-report their fruit consumption. In terms of education or income, we did not find clear distinctions. However, the participants with the highest income had lower gammas for certain foods, which could be explained by the fact that they might eat out more than the participants with the lowest income. A previous study from the UK also observed a higher concordance between purchased and consumed foods among low-income households and suggested that the finding was indicative of more careful buying to meet the family’s needs and less food waste(Reference Ransley, Donnelly and Khara15).
Most of the participants were classified in the same or adjacent category using the purchase volume and FFQ data. However, it is noteworthy that for foods generally considered healthy, such as fresh vegetables, cooked and canned vegetables, berries and vegetable oils, the two methods seemed to have distinct discrepancies. Difficulties in reporting could potentially explain the observed discrepancies: for example, vegetable consumption is particularly challenging to assess using an FFQ(Reference Cade, Burley and Warm32). In addition, social desirability(Reference Hebert, Ma and Clemow31), systematic misreporting and person-specific biases related to, for example, obesity may affect the FFQ data(Reference Slimani, Freisling, Illner, Lovegrove, Hodson and Sharma4,Reference Lissner33) and thus, purchase data may reflect the consumption of these foods more realistically. Moreover, it is customary in Finland to pick berries in the forest, and thus, the mismatch between the FFQ and purchase data may plausibly reflect reality.
The purchase data used in the current study were obtained from one retailer, and we only had data from one loyalty-card holder from each household. Thus, the data used in the study did not cover all the foods bought for the household. In Finland, two large chains dominate the food retail market and in 2018 had a combined share of 83 %(22). These two chains have slightly different profiles, and people might have tendencies to buy certain foods from the other chain, resulting in possible systematic bias in our purchase data. In addition, the data only covered purchases associated with the loyalty card. Hence, it is possible that not all purchases were recorded in the data. However, it is unlikely that the participants systematically neglected to use their loyalty cards when purchasing certain foods.
The current study is one of the first to use automatically accumulating loyalty-card data on grocery purchases and could serve as a starting point for future studies investigating food behaviour in large samples. The advantages of the method include the automatic nature and objectivity of the data collection: the participants are not expected to record their food purchases, and moreover, it is difficult to consciously or unconsciously misreport purchases. Previously, loyalty-card data have been used in studies investigating, for example, customer behaviour(Reference Sturley, Newing and Heppenstall34–Reference Lloyd and Cheshire36) and intervention effects(Reference Sharma, di Falco and Fraser37–Reference Franckle, Levy and Macias-Navarro42). An Australian study used loyalty-card data on food purchases to build an index describing the healthiness of food purchases(Reference Taylor, Wilson and Hendrie43), whereas a French study used similar data to study the associations between the healthiness of food purchases and alcoholic beverages(Reference Hansel, Roussel and Diguet44). Our group also used purchase data to show that unhealthy purchases tend to cluster: the foods most consistently related to alcohol purchases were sausages, soft drinks and snacks(Reference Uusitalo, Erkkola and Lintonen45). A recent UK study used loyalty-card data to study the relationship between food purchases and hypertension, high blood cholesterol and diabetes in an ecological design(Reference Aiello, Schifanella and Quercia11). Our study adds credibility to earlier studies by suggesting that at least a moderate association exists between grocery purchases and food consumption. Moreover, purchase data could be used to assess the potential effects of, for example, food policies and taxation in different age groups or areas with varying socio-demographic characteristics or educational levels, for which purposes individual-level data are not essential. Considering the imperfect match between household- and individual-level data, the relative validity criterion used in the current paper might even be regarded as unnecessarily strict.
The present study has several strengths. First, the sample is exceptionally large for a dietary assessment validation study, and we used different types of grocery purchase data (frequency and volume, 1- and 12-month periods). Similar findings irrespective of the type of purchase data suggest internal consistency. Furthermore, the findings concerning different subgroups were in accordance with our hypothesis. Second, the use of purchase data from the past 12 months evened out seasonal variation in the data. Obviously, the study also had notable limitations that need to be acknowledged. First, the study population was more educated than the general Finnish adult population: the percentage of participants with Master’s degree or higher education was 24 %, whereas the corresponding percentage in the population is 11 %(Reference Vuorinen, Erkkola and Fogelholm23). Second, we assessed food consumption with a relatively short FFQ that has not been validated. However, the food list in the FFQ was loosely based on a previous FFQ, which has been tested for relative validity (against food records)(Reference Korkalo, Vepsäläinen and Ray24) and reproducibility (test–retest reliability)(Reference Määttä, Vepsäläinen and Lehto46) among preschoolers. Furthermore, due to heavy aggregation in the FFQ and purchase data, we were forced to use thirds instead of quarters for some of the food groups, which could potentially mask important information.
Conclusions
The current study demonstrated that for most food groups, loyalty-card data on grocery purchases are a moderately valid marker of food consumption. The associations between grocery purchases and self-reported food consumption were strongest in single-adult households and among participants with a higher degree of loyalty. Future studies should consider purchase data a resource-saving, moderately valid and objective proxy for food consumption in large samples.
Acknowledgements
We thank the S Group for its collaboration. We are also grateful to the loyalty-card holders who provided consent for the use of their loyalty-card data in this research project.
This work was funded by The Finnish Food Research Foundation; The Finnish Foundation for Alcohol Studies; and EIT Food (‘Towards a smarter shopping list’ #20 041), the innovation community on Food of the European Institute of Innovation and Technology (EIT), a body of the EU, under the Horizon 2020, the EU Framework Programme for Research and Innovation.
The authors’ responsibilities were as follows: H. V., J. N., S. K., J. M., S. M., L. U., M. F. and M. E designed the study; J. N., L. U., M. F. and M. E. conducted the research; S. T. I. carried out the literature search; H. V. and J. N. analysed the data and performed the statistical analysis; H. V. wrote the paper; J. N. and M. E. had primary responsibility for the final content. All the authors reviewed and approved the final version of the manuscript.
H. V. has received a fee from the S Group. The collaboration included offering professional advice to influencers and writing a blog post with regard to interpretation of nutrition calculator in S Group’s mobile app. M. F. is a member of the S Group’s Advisory Board for Societal responsibility. The membership is without any compensation. The authors declare no other relationships or activities that could appear to have influenced the present work. The authors declare that they have no competing interests.
Supplementary material
For supplementary materials referred to in this article, please visit https://doi.org/10.1017/S0007114521004177


