


1. Introduction
Auxin is a central regulator of root development, playing critical roles in processes such as meristem maintenance and lateral root formation (reviewed in Atkinson et al., Reference Atkinson, Rasmussen, Traini, Voss, Sturrock, Mooney, Wells and Bennett2014). Root architecture varies among angiosperms and can be influenced by both nutrient and hormone signaling (Hochholdinger et al., Reference Hochholdinger, Yu and Marcon2018; Liu & von Wirén, Reference Liu and von Wirén2022). The current models for auxin perception and signaling encompass decades of studies (Powers & Strader, Reference Powers and Strader2020). Nuclear auxin perception occurs via a co-receptor complex composed of evolutionarily conserved F-box TRANSPORT INHIBITOR RESPONSE1/AUXIN SIGNALING F-BOX (TIR1/AFB) and AUXIN/INDOLE ACETIC ACID (Aux/IAA) proteins (Calderón Villalobos et al., Reference Calderón Villalobos, Lee, De Oliveira, Ivetac, Brandt, Armitage, Sheard, Tan, Parry, Mao, Zheng, Napier, Kepinski and Estelle2012; Dharmasiri et al., Reference Dharmasiri, Dharmasiri and Estelle2005; Kepinski & Leyser, Reference Kepinski and Leyser2004). Because TIR1/AFB proteins encode E3 ubiquitin ligase enzymes, this interaction leads to ubiquitination and degradation of Aux/IAA proteins (Kelley, Reference Kelley2018). Additionally, Aux/IAA proteins (29 family members in Arabidopsis and 31 in maize) are transcriptional repressors that actively repress AUXIN RESPONSE FACTOR (ARF) transcription factors in cooperation with the TOPLESS co-repressor family of proteins (Gallavotti et al., Reference Gallavotti, Long, Stanfield, Yang, Jackson, Vollbrecht and Schmidt2010; Szemenyei et al., Reference Szemenyei, Hannon and Long2008). Thus, in the absence of Aux/IAA proteins ARF transcription factors are able to transcriptionally regulate gene expression very rapidly. The ARF protein family (23 members in Arabidopsis and 31–36 members in maize) has been recently divided into three classes based on their structure and ability to either activate or repress gene expression (termed “activators” or “repressors”) (Galli et al., Reference Galli, Khakhar, Lu, Chen, Sen, Joshi, Nemhauser, Schmitz and Gallavotti2018; Mutte et al., Reference Mutte, Kato, Rothfels, Melkonian, Wong and Weijers2018).
Auxin-responsive gene expression in primary roots has been studied in Arabidopsis (Bargmann et al., Reference Bargmann, Vanneste, Krouk, Nawy, Efroni, Shani, Choe, Friml, Bergmann, Estelle and Birnbaum2013; Lewis et al., Reference Lewis, Olex, Lundy, Turkett, Fetrow and Muday2013; Nemhauser et al., Reference Nemhauser, Hong and Chory2006; Pu et al., Reference Pu, Walley, Shen, Lang, Briggs, Estelle and Kelley2019) and maize (Galli et al., Reference Galli, Khakhar, Lu, Chen, Sen, Joshi, Nemhauser, Schmitz and Gallavotti2018; Ravazzolo et al., Reference Ravazzolo, Boutet-Mercey, Perreau, Forestan, Varotto, Ruperti and Quaggiotti2021; Wang et al., Reference Wang, Sun, Wang, Yang, Xu, Yang, Xu and Li2021; Xing et al., Reference Xing, Pudake, Guo, Xing, Hu, Zhang, Sun and Ni2011). While maize root systems differ considerably in their anatomy and architecture from Arabidopsis roots (Hochholdinger et al., Reference Hochholdinger, Yu and Marcon2018; Hochholdinger & Zimmermann, Reference Hochholdinger and Zimmermann2008), there are a couple maize root mutants that have been linked to auxin either directly or indirectly, highlighting the central role that auxin plays in root development. For example, rootless undetectable meristem 1 (rum1) encodes an Aux/IAA protein that is required for embryonic and postembryonic root formation (von Behrens et al., Reference von Behrens, Komatsu, Zhang, Berendzen, Niu, Sakai, Taramino and Hochholdinger2011). In addition, the rootless concerning crown and seminal roots (rtcs) mutant encodes a LATERAL ORGAN BOUNDARY (LOB) transcription factor which is linked to auxin-regulated gene expression (Taramino et al., Reference Taramino, Sauer, Stauffer, Multani, Niu, Sakai and Hochholdinger2007; Xu et al., Reference Xu, Tai, Saleem, Ludwig, Majer, Berendzen, Nagel, Wojciechowski, Meeley, Taramino and Hochholdinger2015).
Given that root system development differs between maize and Arabidopsis (Hochholdinger, Reference Hochholdinger, Bennetzen and Hake2009; Hochholdinger & Zimmermann, Reference Hochholdinger and Zimmermann2008) and that auxin responses are known to be influenced by cellular context (Bargmann et al., Reference Bargmann, Vanneste, Krouk, Nawy, Efroni, Shani, Choe, Friml, Bergmann, Estelle and Birnbaum2013; Brunoud et al., Reference Calderón Villalobos, Lee, De Oliveira, Ivetac, Brandt, Armitage, Sheard, Tan, Parry, Mao, Zheng, Napier, Kepinski and Estelle2012; Novák et al., Reference Novák, Hényková, Sairanen, Kowalczyk, Pospíšil and Ljung2012; Truskina et al., Reference Truskina, Han, Chrysanthou, Galvan-Ampudia, Lainé, Brunoud, Macé, Bellows, Legrand, Bågman, Smit, Smetana, Stigliani, Porco, Bennett, Mähönen, Parcy, Farcot, Roudier and Vernoux2021), an increased resolution of auxin-mediated transcription in maize would be beneficial. The primary maize root is divided into three key developmental regions: the meristematic zone, the elongation zone and the maturation zone with specialized functions (Hochholdinger, Reference Hochholdinger, Bennetzen and Hake2009; Hochholdinger et al., Reference Hochholdinger, Yu and Marcon2018). The meristematic zone includes the distal tip of the primary root and is composed stem cells and the lateral root cap (Hochholdinger, Reference Hochholdinger, Bennetzen and Hake2009). While the lateral root cap provides protection and gravity perception (Matsuyama et al., Reference Matsuyama, Satoh, Yamada and Hashimoto1999), the meristem functions to sustain root organogenesis via a balance of self-renewal and differentiation (Jiang et al., Reference Jiang, Zhu, Diao, Huang and Feldman2010). The elongation zone is composed of differentiating root cells that are required for gravitropism and sensitive to exogenous auxin treatment (Ishikawa & Evans, Reference Ishikawa and Evans1993). Terminally differentiated cells, such as root hairs and tracheids, are found within the maturation zone and thus represent a high degree of complexity due to their myriad of functions (Hochholdinger, Reference Hochholdinger, Bennetzen and Hake2009). A high-resolution map of gene expression across these regions of the root has revealed extensive tissue specificity and plasticity (Marcon et al., Reference Marcon, Malik, Walley, Shen, Paschold, Smith, Piepho, Briggs and Hochholdinger2015).
An outstanding question in the field is how auxin-responsive gene expression is incorporated into maize root development. In this study, we profiled auxin-responsive gene expression with spatial and temporal resolution to further our understanding of how auxin influences transcriptional responses in maize roots. Specifically, we performed transcriptome analysis of the meristematic zone, elongation zone, cortex, and stele of 5-day-old primary maize roots following 30 and 120 min of exogenous indole-3-acetic acid treatment. This analysis demonstrates that auxin-responsive gene expression in roots exhibits both tissue and temporal specificity.
Biological networks can describe molecular connections underlying cellular processes and provide insight towards complex phenomena (Haque et al., Reference Haque, Ahmad, Clark, Williams and Sozzani2019; Marshall-Colón & Kliebenstein, Reference Marshall-Colón and Kliebenstein2019; Walley et al., Reference Walley, Sartor, Shen, Schmitz, Wu, Urich, Nery, Smith, Schnable, Ecker, Briggs, Krouk, Lingeman, Colon, Coruzzi, Shasha, Gardner, Faith, Bar-Joseph and Stitt2016). With respect to auxin signaling, several aspects of auxin action are well-suited to network analyses. For instance, the direct influence of auxin on transcription can be modeled through the reconstruction of gene regulatory networks (GRNs) that can be used to infer the structure of gene expression programs that underpin development. Using the auxin transcriptome data generated herein we generated novel auxin-dependent predictive GRNs that underlie maize root morphogenesis. These data expand our understanding of shared and unique properties of maize ARF transcription factors, identify key auxin marker genes in maize roots, and quantify auxin-regulated transcription across the developing maize root to inform further research on crop root development.
2. Methods
2.1. Plant material
Zea mays inbred B73 kernels were surface sterilized in 5% bleach for 15 min and rinsed three times with sterile deionized water. For every 10 kernels, three pieces of seed germination paper (Anchor Paper Company, 10 × 15 L 38# regular weight seed germination paper) were soaked in a solution of freshly prepared Captan fungicide (2.5 g/L). Ten kernels were placed ~5 cm from the top of the paper in the middle sheet, covered with the top sheet, and rolled into a cylinder lengthwise using the rolled towel method (Hochholdinger, Reference Hochholdinger, Bennetzen and Hake2009). Twelve paper rolls were placed in a 4 L Nalgene beaker containing 400 mL of 0.5X Linsmaier and Skoog (LS) (2.4 g/L) pH buffered basal salts (Caisson Labs). The rolled towels were placed in a Percival growth chamber set to 22ºC, long day (16 hr light, 8 hr dark) white light at 160 μmol·m−2s−1 light intensity. After 2 days the rolls were opened and the seeds were scored for germination. Any ungerminated kernels were removed and this was designated day one. After 2 days of growth the liquid media was poured off and replaced with fresh 400 mL of 0.5X LS. Five days after germination (5 DAG) the seedlings were removed from the towels prior to mock or auxin treatments followed by dissection.
2.2. Auxin treatments
10 mM Indole-3-acetic acid (IAA) stocks were prepared in 95% ethanol and stored at −20°C. Immediately before performing the auxin treatments, one liter of 10 μM IAA was prepared by diluting the 10 mM stock 1:1,000 into 0.5X LS media, resulting in a final concentration of 0.095% ethanol. As a corresponding “mock” control, one liter of 0.095% ethanol was prepared by diluting 95% ethanol 1:1,000. Seedlings were placed in 0.5X LS supplemented with 10 μM IAA (“auxin” treatment) or 0.095% ethanol (“mock” control) and incubated at room temperature for 30 and 120 min. For each biological replicate, 30–80 primary roots (approximately 2–4 cm in length) were hand dissected into meristematic zone, elongation zone, cortical parenchyma and epidermis (referred to as “cortex” hereafter), and stele according to previous methods (Marcon et al., Reference Marcon, Malik, Walley, Shen, Paschold, Smith, Piepho, Briggs and Hochholdinger2015; Saleem et al., Reference Saleem, Lamkemeyer, Schutzenmeister, Madlung, Sakai, Piepho, Nordheim and Hochholdinger2010; Walley et al., Reference Walley, Sartor, Shen, Schmitz, Wu, Urich, Nery, Smith, Schnable, Ecker, Briggs, Krouk, Lingeman, Colon, Coruzzi, Shasha, Gardner, Faith, Bar-Joseph and Stitt2016) to yield at least 100 mg of tissue per sample and replicate. Total tissue weights per tissue replicate varied from 100–600 mg. In total, three biological replicates were collected for each tissue and time point for the transcriptome analysis. Tissues were immediately flash frozen in liquid nitrogen and stored at −80°C until all replicates were harvested.
2.3. RNA extraction and transcriptome sequencing
Root tissues (100–500 mg per sample) were ground to fine powder in liquid nitrogen using a pre-chilled mortar and pestle. RNA was extracted from ~100 mg of tissue using Trizol (Invitrogen) and further purified using Qiagen RNeasy kit with on column DNase treatment (Reference Walley, Kelley, Nestorova, Hirschberg and DeheshWalley et al., 2010). Isolated RNA concentration and quality were checked using a Nanodrop, Qubit, and Bioanalyzer. Total RNA was used to generate QuantSeq 3’mRNA libraries using a Lexogen 3′ mRNA-Seq FWD kit and 48 unique indices (Moll et al., Reference Moll, Ante, Seitz and Reda2014). Libraries were run on an Illumina HiSeq 3,000 to generate 100 bp single-end (SE) reads.
2.4. RNA-seq analysis
FASTQ sequence files were deposited at the NCBI Sequence Read Archive (BioProject accession number PRJNA791716). Files were checked via FASTQC to obtain sequence quality information. The FASTQ files were then run through the following bioinformatic pipeline as suggested by Lexogen. First, adapters and low-quality tails were removed using bbduk from the BBTools suite (sourceforge.net/projects/bbmap/). Alignment to the B73 v4 genome (Jiao et al., Reference Jiao, Peluso, Shi, Liang, Stitzer, Wang, Campbell, Stein, Wei, Chin, Guill, Regulski, Kumari, Olson, Gent, Schneider, Wolfgruber, May, Springer and Ware2017) was performed using STAR (Dobin et al., Reference Dobin, Davis, Schlesinger, Drenkow, Zaleski, Jha, Batut, Chaisson and Gingeras2013) and indexing was executed using SAMTools (Li et al., Reference Li, Handsaker, Wysoker, Fennell, Ruan, Homer, Marth, Abecasis and Durbin2009). HTSeq (Anders et al., Reference Anders, Pyl and Huber2015) was used to generate count files which were then analyzed via PoissonSeq (Li et al., Reference Li, Witten, Johnstone and Tibshirani2012). Differentially expressed (DE) genes were identified between mock and time-matched treated samples in each tissue using a false discovery rate (FDR; adjusted p-value) of q < 0.1.
2.5. Gene regulatory network analysis
Transcription factor-centered GRNs were generated using Spatiotemporal Clustering and Inference of Omics Networks (SC-ION) version 2.1 (Clark et al., Reference Clark, Nolan, Wang, Song, Montes, Valentine, Guo, Sozzani, Yin and Walley2021). For clustering and network reconstruction within SC-ION, a trimmed mean of M values (TMM)-normalized counts matrix of all detected transcripts across all samples from the RNA-seq analysis was selected as the input file for both the target matrix and regulator matrix. To specify network candidate targets, a list of gene IDs corresponding to PoissonSeq-derived significant DE genes (q < 0.1) from comparisons between tissue types or in IAA versus mock treatments was used as the target list. Similarly, to classify candidate regulators, IDs of significant DE genes from the comparisons between tissue types or in IAA versus mock treatments, which were annotated as TFs according to Grassius (Yilmaz et al., Reference Yilmaz, Nishiyama, Fuentes, Souza, Janies, Gray and Grotewold2009) were used as the regulator list. Non-temporal clustering via Independent Component Analysis (ICA) (Nascimento et al., Reference Nascimento, Silva, Sáfadi, Nascimento, Ferreira, Barroso, Ferreira Azevedo, Guimarães and Serão2017) was selected and SC-ION was supplied a matrix consisting of TMM-normalized counts of transcripts averaged across biological replicate for each tissue type at 30 min. GRNs for each ICA cluster were then inferred using SC-ION’s implementation of the random forest algorithm, GENIE3 (Huynh-Thu et al., Reference Huynh-Thu, Irrthum, Wehenkel and Geurts2010). The SC-ION output table consisting of predicted regulator-target interactions as well as a numeric “weight” value for each pair indicating the confidence of their connection was imported into Cytoscape (Shannon et al., Reference Shannon, Markiel, Ozier, Baliga, Wang, Ramage, Amin, Schwikowski and Ideker2003) for GRN visualization. For the spatiotemporal GRN, the nodes (genes) were colored in Cytoscape according to their temporal IAA responsiveness (i.e., up or down at 30 or 120 min) and grouped by tissue cluster enrichment. To visualize the ARF transcription factor subnetworks, ARF-specific regulators and their first-neighbor targets were extracted from the SC-ION output table and imported into Cytoscape. The grouping of ARFs by clade membership and coloring of ARF nodes and their first neighbor targets was done within Cytoscape.
2.6. Gene ontology enrichment and UpSet analyses
Gene ontology (GO) enrichment analysis was performed using the Zea mays B73 inbred reference genome in PANTHER. A Fisher’s exact test type and an FDR correction using the Benjamini–Hochberg method with a cutoff of 0.05 was used to identify significantly enriched GO terms. Significant GO biological process terms were plotted on the y-axis against their genotype/treatments on the x-axis using multidimensional dot plots (Bonnot et al., Reference Bonnot, Gillard and Nagel2019). UpSet plots were generated using the UpsetR package in RStudio and ordered by frequency (Conway et al., Reference Conway, Lex and Gehlenborg2017). The “nintersects” argument was used to output the 20 (Figure 2 and Supplemental Figure S2) and 50 (Supplemental Figure S3) most populated intersections. Additional code was written to extract gene identifiers among shared lists of differentially expressed genes within an UpSet plot; data processing scripts are available from a GitHub repository: https://github.com/mmcreyno92/AuxinRootAtlas.
2.7. Hierarchical clustering and visualization by heatmaps
Hierarchical clustering of transcript abundance was independently performed in each tissue on genes that were DE in response to auxin and plotted as heatmaps using the Morpheus software from the Broad Institute (https://software.broadinstitute.org/morpheus/). The heatmaps show the row normalized transcript level. Row normalization was done by converting to Z-scores using the “subtracted by row mean and divided by row standard deviation” adjustment.

Fig. 1. Identification of auxin-responsive genes across four key regions of the primary maize root. (a) Picture of maize primary dissected root regions profiled in this study. Five-day-old primary maize roots were dissected into the four regions indicated. The distal 2 mm of the root tip corresponds to the meristematic zone (MZ). The elongation zone (EZ) is the proximal zone adjacent to the MZ root tip up to where the root hairs emerge. The differentiation zone, starting with the root hair zone, was mechanically separated into cortex (C) and stele (S) by snapping the root from the kernel and pulling the stele out from the cortex. Scale bar = 1 cm. (b) Differentially expressed genes within each root region at 30 min (t30) and 120 min (t120) were identified by comparing 10 □M indole-3-acetic acid (auxin) treated samples to mock-treated samples at q < 0.1. The x-axes represent the number of DE genes. (c) Heatmaps ordered by hierarchical clustering of the genes that are DE in response to auxin within each tissue profiled. Hierarchical clustering was independently carried out within each tissue.

Fig. 2. A comparison of differentially expressed genes in maize roots across four regions at two different time points in response to auxin. (a) UpSet plot of differentially expressed transcripts at 30 min (t30). (b) UpSet plot of auxin-responsive DE transcripts at 120 min (t120). Concordant and discordant comparisons are indicated in green and vermillion, respectively. Only the top 20 most populated intersections are visualized. Abbreviations: auxin, indole-3-acetic acid treatment compared with mock treatment; C, cortex; EZ, elongation zone; MZ, meristematic zone; S, stele, auxin.
3. Results and discussion
3.1. Auxin responsive transcriptome profiles in primary maize roots across space and time
Maize root growth and development have been linked to auxin using hormone application essays (Pilet & Saugy, Reference Pilet and Saugy1985) and genetic studies (von Behrens et al., Reference von Behrens, Komatsu, Zhang, Berendzen, Niu, Sakai, Taramino and Hochholdinger2011; Zhang et al., Reference Zhang, Behrens, Zimmermann, Ludwig, Hey and Hochholdinger2015; Reference Zhang, Marcon, Tai, von Behrens, Ludwig, Hey, Berendzen and Hochholdinger2016). In Arabidopsis, the transcriptional responses of root cells to auxin have been characterized (Bargmann et al., Reference Bargmann, Vanneste, Krouk, Nawy, Efroni, Shani, Choe, Friml, Bergmann, Estelle and Birnbaum2013) and provide foundational knowledge of how auxin impacts gene expression in a context-dependent manner. In maize, auxin-responsive gene expression has been characterized on whole seedlings (Galli et al., Reference Galli, Khakhar, Lu, Chen, Sen, Joshi, Nemhauser, Schmitz and Gallavotti2018), but auxin-driven gene expression patterns within the root are not well understood. The overall goal of this study was to characterize the auxin-responsive transcriptome within maize primary roots across four key cellular regions: the meristematic zone, elongation zone, and the cortex and stele within the differentiation zone (Marcon et al., Reference Marcon, Malik, Walley, Shen, Paschold, Smith, Piepho, Briggs and Hochholdinger2015; Paschold et al., Reference Paschold, Larson, Marcon, Schnable, Yeh, Lanz, Nettleton, Piepho, Schnable and Hochholdinger2014; Walley et al., Reference Walley, Sartor, Shen, Schmitz, Wu, Urich, Nery, Smith, Schnable, Ecker, Briggs, Krouk, Lingeman, Colon, Coruzzi, Shasha, Gardner, Faith, Bar-Joseph and Stitt2016) to determine how auxin can impact gene expression in roots (Figure 1a). Five-day-old B73 maize primary roots were treated with 10 μM IAA (“auxin”) or 0.095% ethanol (“mock” solvent control) for 30 and 120 min and then dissected into four regions (Figure 1a). This concentration of auxin was selected based on previous work that demonstrated auxin-dependent degradation of an Aux/IAA-based fluorescence reporter (DII-VENUS) occurred rapidly following 10 μM IAA treatments (Mir et al., Reference Mir, Aranda, Biaocchi, Luo, Sylvester and Rasmussen2017) and can lead to primary root inhibition (Supplemental Figure S1). These treatments were performed for 30 and 120 min in order to capture the temporal nature of auxin signaling, given that transcriptional response and Aux/IAA turnover occur rapidly within these timeframes of hormone exposure (Bargmann et al., Reference Bargmann, Vanneste, Krouk, Nawy, Efroni, Shani, Choe, Friml, Bergmann, Estelle and Birnbaum2013; Mir et al., Reference Mir, Aranda, Biaocchi, Luo, Sylvester and Rasmussen2017; Zhang et al., Reference Zhang, Marcon, Tai, von Behrens, Ludwig, Hey, Berendzen and Hochholdinger2016). Transcriptome profiling was performed on these tissues using the 3’ QuantSeq method with three biological replicates for each tissue/treatment/time. From this analysis, we identified 32,832 distinct transcripts in total across all tissues. Within the meristematic zone, relatively few auxin-responsive genes were observed (Figure 1b Supplemental Table S1). In contrast, hundreds of genes were induced or repressed following auxin treatment within the elongation zone, cortex, and stele. This result suggests that meristematic zone cells may be less sensitive to exogenous auxin effects, as endogenous levels of IAA are already high in this region of the root (Mir et al., Reference Mir, Aranda, Biaocchi, Luo, Sylvester and Rasmussen2017; Pilet & Saugy, Reference Pilet and Saugy1985). In addition, many of the observed auxin-regulated genes include AUXIN INDOLE-3-ACETIC ACID INDUCIBLE (Aux/IAA), GRETCHEN HAGEN (GH), SMALL AUXIN UPREGULATED (SAUR), and LATERAL BOUNDARY DOMAIN (LBD) family members, which is consistent with previous studies on auxin-mediated gene expression from Arabidopsis roots (Bargmann et al., Reference Bargmann, Vanneste, Krouk, Nawy, Efroni, Shani, Choe, Friml, Bergmann, Estelle and Birnbaum2013; Lewis et al., Reference Lewis, Olex, Lundy, Turkett, Fetrow and Muday2013). In Arabidopsis roots, early up-regulated clusters of co-expressed genes are enriched with these same auxin-response annotations (Lewis et al., Reference Lewis, Olex, Lundy, Turkett, Fetrow and Muday2013), which is consistent with the temporal effects observed here.
Within the cortex and stele more auxin-regulated genes are observed at 30 min compared with 120 min. In contrast, within the elongation zone, we observed more up-regulated genes at 120 min compared with 30 min. These patterns may reflect the altered chromatin state or transcription factor properties associated with cellular state as cortex and stele cells are further differentiated compared with elongation zone cells. A previous time course of auxin-responsive gene expression in Arabidopsis roots identified few transcriptional changes at 30 min and a marked bimodal distribution at 120 min (2 hr) (Lewis et al., Reference Lewis, Olex, Lundy, Turkett, Fetrow and Muday2013), which is consistent with this study.
3.2. Auxin-regulated gene expression in maize primary roots is region specific
Auxin-mediated gene expression is context dependent. To examine shared and uniquely regulated transcripts across the four sampled root regions we generated UpSet plots comparing auxin-responsive transcripts within each time point (Figure 2 and Supplemental Figure S2) as well as DE between tissues (Supplemental Figure S3). Given that there are numerous possible comparisons with four regions and two categories of DE (up or down) we selected the top 20 comparisons for visualization. At both 30 and 120 min after auxin treatment, relative to mock treatment, the majority of the observed DE genes are region specific. At 30 min after treatment auxin up- and down-regulated genes across regions include both concordant and discordant properties. For example, there are 22 genes that are up-regulated in the cortex at 30 min after auxin treatment that are down-regulated in the stele (Figure 2a). Thus, these transcripts are considered to be discordant because they display opposite expression patterns between neighboring tissues. In contrast, at 120 min after treatment, the observed DE genes in common between tissues are only concordant. For example, all shared transcripts between tissues at this timepoint display the same direction of expression across tissues. This result suggests that early auxin-mediated transcriptional changes may include both repression and activation at the same genes in a tissue-specific manner, while later effects (i.e., 120 min) of auxin may uniformly influence suites of genes irrespective of cellular context.
These comparisons provide the opportunity to identify robust auxin-responsive transcripts which are up-regulated irrespective of tissue or time point. For example, there are four transcripts that are auxin induced in the meristematic zone, elongation zone, cortex, and stele at 30 min and 13 such transcripts at 120 min. These transcripts include AUX/IAA-transcription factor 22 (IAA22/Zm00001d013707), Aux/IAA24 (Zm00001d018414), DIOXYGENASE FOR AUXIN OXIDATION 1 (DAO1/Zm00001d003311) and AUXIN AMIDO SYNTHETASE2 (AAS2/Zm00001d006753). Notably, these are all encoded by genes with annotated functions as auxin transcriptional repressors and enzymes that conjugate or degrade IAA. Thus, these upregulated genes may reflect pathway feedback. From this analysis, a set of auxin-responsive marker genes have now been identified which can facilitate future studies on auxin signaling in maize roots.
3.3. Distinct biological processes are enriched among auxin-regulated genes across root regions
To determine if particular biological processes are auxin-regulated in root regions we performed a GO enrichment analysis. Many of the observed enriched GO terms are congruent with a previous study that examined the transcriptome profile of these root zones in the absence of treatment (Paschold et al., Reference Paschold, Larson, Marcon, Schnable, Yeh, Lanz, Nettleton, Piepho, Schnable and Hochholdinger2014), but we also identified a number of novel GO terms associated with hormone signaling, cell cycle, and gene regulation (Figure 3, Supplemental Figure S4, Supplemental Table S2). In general, auxin-induced genes are associated with transcription, auxin-activated signaling pathway, and gibberellin metabolism. In contrast, auxin repressed genes are associated with cell cycle, cell division, and chromatin silencing. Specifically, several Cyclins that promote cell cycle progression are repressed in the stele following a 30 min auxin treatment (Figure 3 and Supplemental Table S2), which is in line with a previous study linking low levels of auxin signaling with cell cycle progression (Mir et al., Reference Mir, Aranda, Biaocchi, Luo, Sylvester and Rasmussen2017).

Fig. 3. Auxin-responsive genes between root regions are enriched in several gene ontology (GO) terms related to biological processes. Significant GO terms of interest in auxin down-regulated genes (“down”) and auxin up-regulated genes (“up”) are indicated on the y-axis. Only tissues with enriched GO terms are shown. False discovery rate (FDR) is color-coded from blue (0.00) to red (0.05). Size of the dot indicates the number of enriched genes within each GO term. Abbreviations: C, cortex; EZ, elongation zone; MZ, meristematic zone; S, stele, t30 = 30 min, t120 = 120 min.

Fig. 4. A spatiotemporal auxin-responsive gene regulatory network in maize primary roots. The nodes (genes) are arranged in numbered circles to represent groupings of nodes (genes) that clustered together and were enriched within the same tissues. Colored nodes represent genes that are differentially expressed following auxin treatment. The temporal response to auxin is indicated by node color: blue, auxin responsive at 30 min; vermillion, auxin responsive at 120 min; and green, auxin responsive at both time points sampled. Each circular node represents a distinct cluster based on tissue: 1 = C + S, 2 = C, 3 = MZ, 4 = S, 5 = EZ, 6 = EZ + S, 7 = MZ + S, 8 = MZ + EZ, 9 = EZ + C, 10 = MZ + C, 11 = EZ + C + S, 12 = MZ + C + S, 13 = MZ + EZ + S, 14 = MZ + EZ + C (Abbreviations: C, cortex; EZ, elongation zone; MZ, meristematic zone; S, stele).
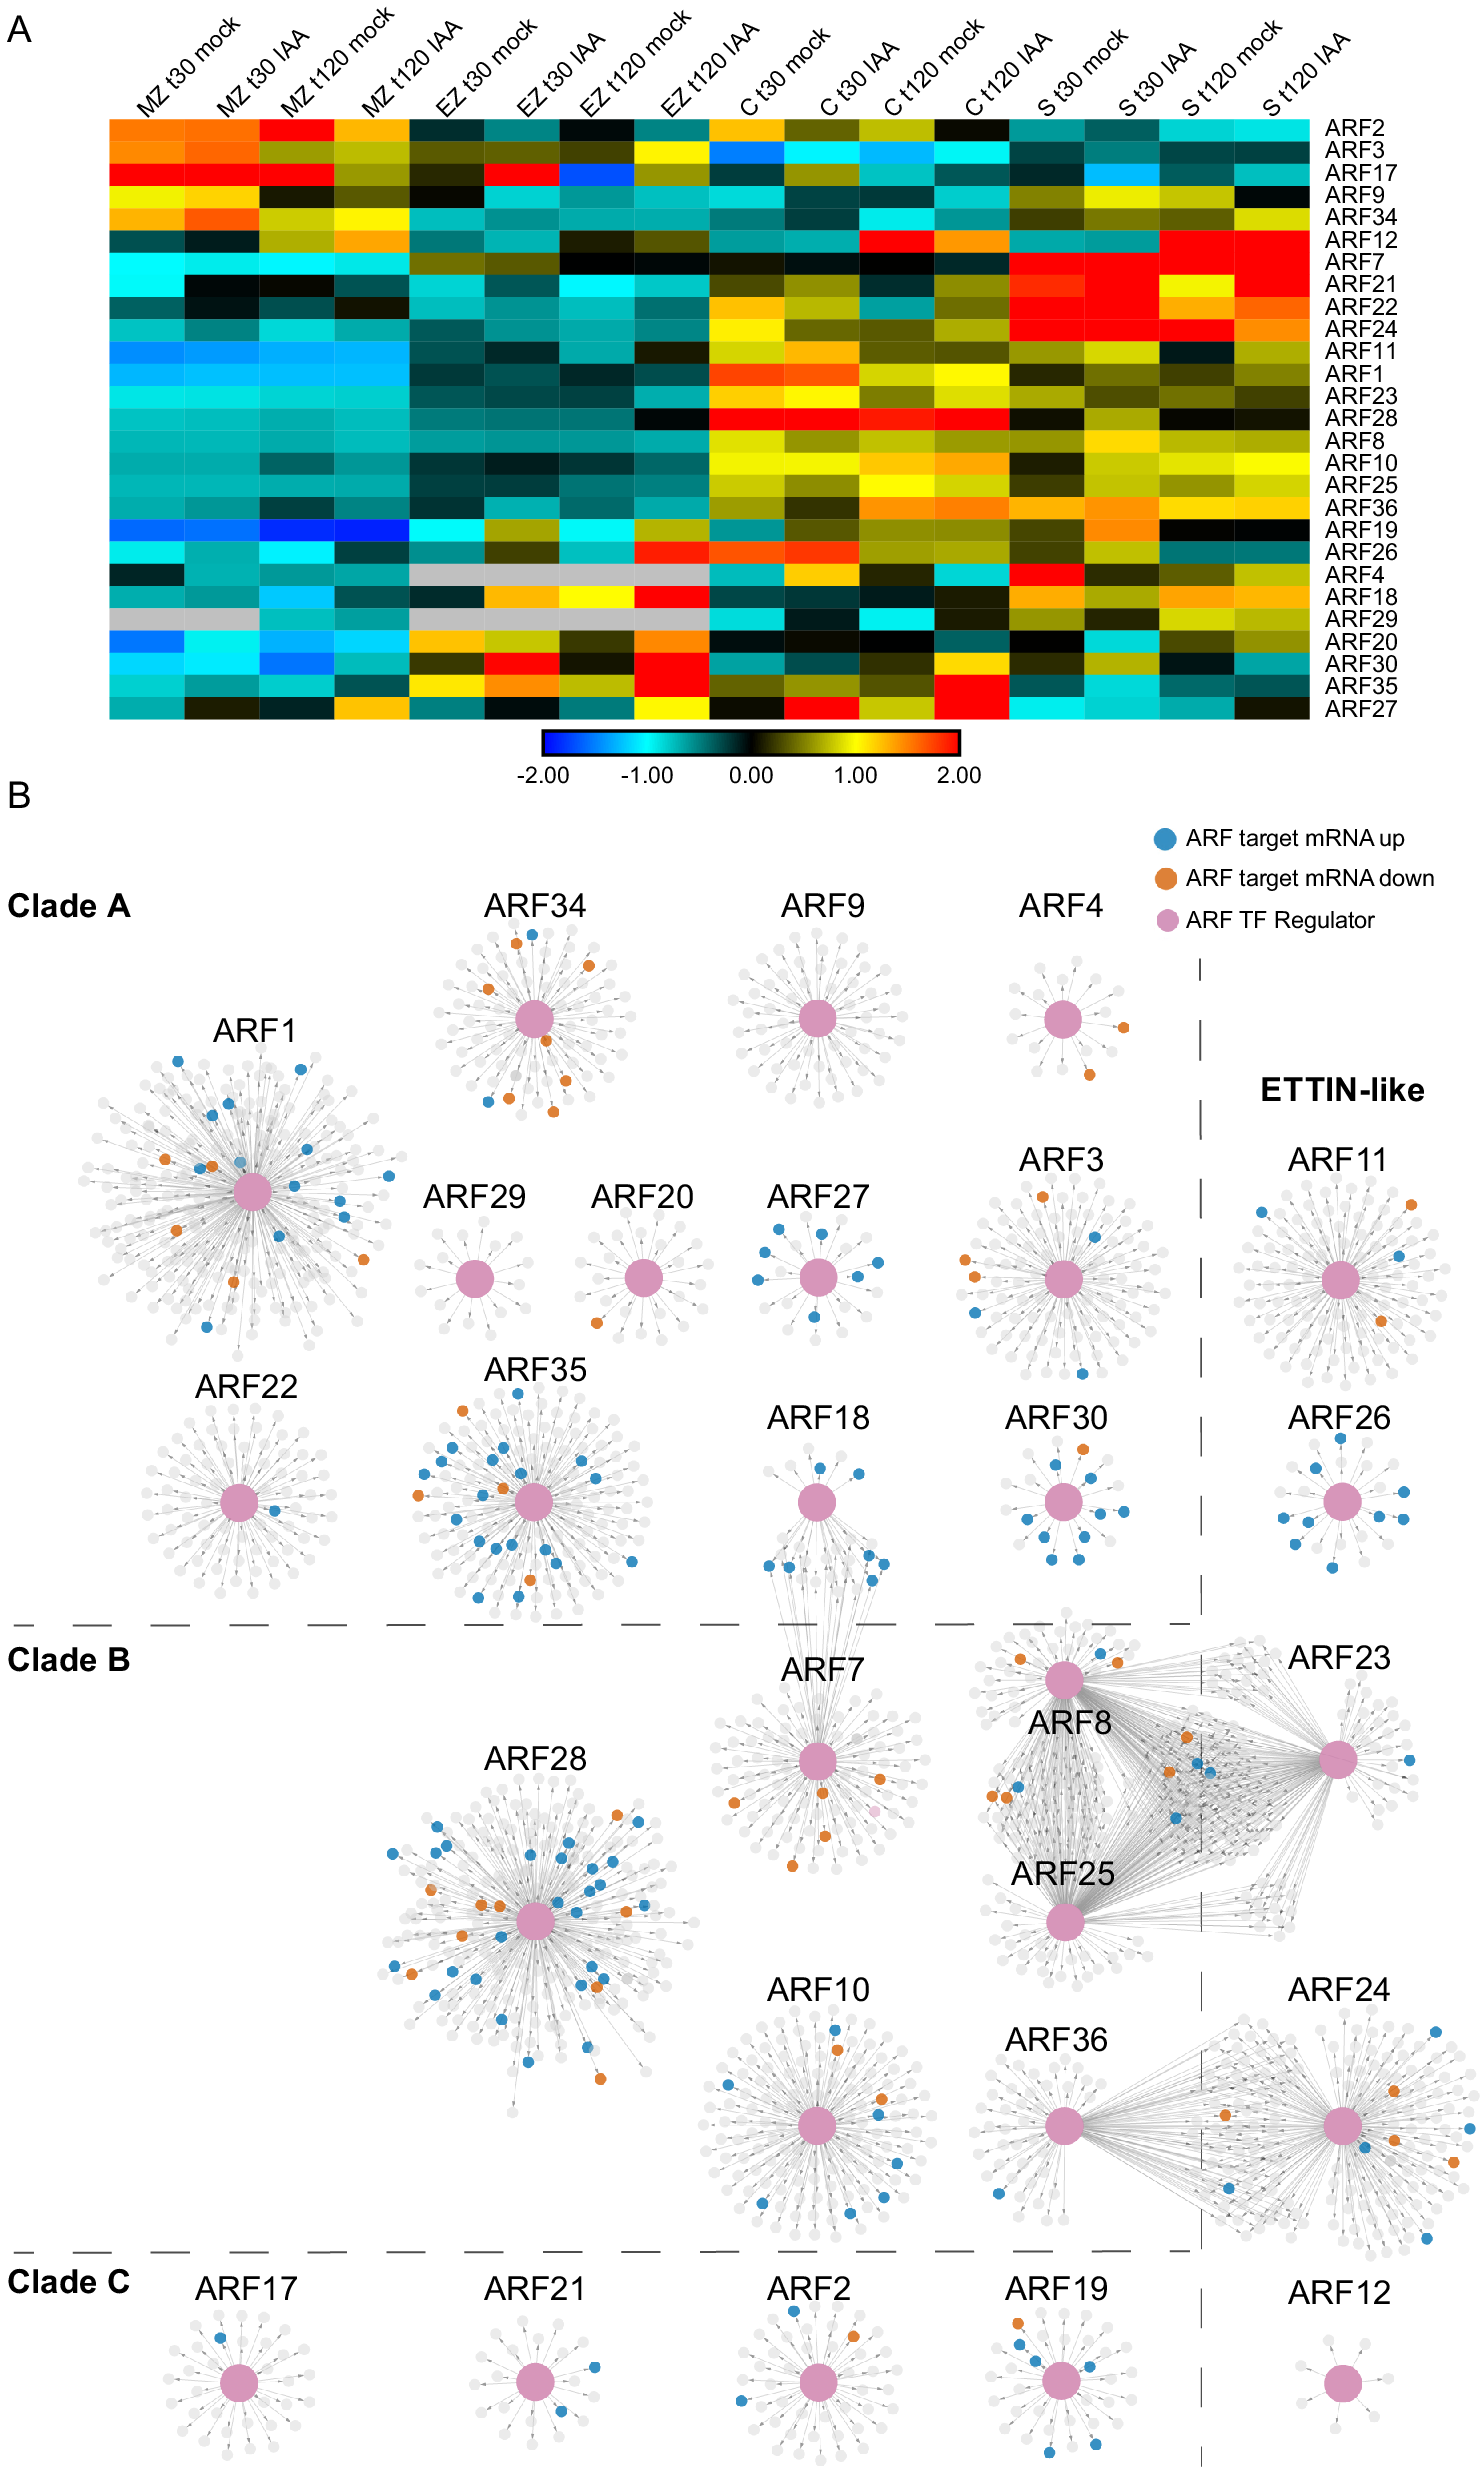
Fig. 5. Auxin-Response Factor (ARF) transcription factor gene regulatory subnetworks associated with primary maize roots. (a) ARF expression across tissues at t30 and t120 auxin treatments. (b) ARF GRN networks arranged by clade classification: Clade A, Clade B, Clade C, or ETTIN-Like. The central enlarged pink nodes within each network represent the ARF of interest labeled above the network and the connected small nodes represent that ARFs target genes. Target genes are colored according to the directionality of their transcript expression in response to auxin: grey, no significant transcript change; vermillion, decreased transcript level; blue, increased transcript level.
In addition, we examined GO term enrichment between root regions to uncover tissue-specific processes that may underlie root structure (Supplemental Figure S4). In general, most GO terms appear to be tissue specific and many of the observed enriched GO terms are congruent with the previous study (Paschold et al., Reference Paschold, Larson, Marcon, Schnable, Yeh, Lanz, Nettleton, Piepho, Schnable and Hochholdinger2014). A couple of enriched GO terms stand out among the many observed. First, transcripts involved in protein phosphorylation are more abundant in the stele compared with the meristem or the neighboring cortex. Another GO term observed across several tissue comparisons is ‘microtubule-based movement’, which is to be expected for cells undergoing cell elongation and/or differentiation. Secondary cell wall biogenesis is more prevalent in elongation zone expressed genes compared with meristem zone transcripts, which fits with our current understanding of cell wall composition across the primary root whereby secondary cell walls can be laid down in the elongation zone (Kozlova et al., Reference Kozlova, Nazipova, Gorshkov, Petrova and Gorshkova2020; Somssich et al., Reference Somssich, Khan and Persson2016). A comparison of the tissue-specific observed enriched GO terms across maize root tissues to the Bargmann et al. (Reference Bargmann, Vanneste, Krouk, Nawy, Efroni, Shani, Choe, Friml, Bergmann, Estelle and Birnbaum2013) auxin cell-type specific study identified some shared terms, related to auxin signaling and cell wall. Specifically, we observed cell wall organization and auxin-activated signaling pathway terms enriched in auxin up-regulated genes in the stele compared with other tissues (Supplemental Figure S4) which is consistent with stele-associated terms observed in Arabidopsis (Bargmann et al., Reference Bargmann, Vanneste, Krouk, Nawy, Efroni, Shani, Choe, Friml, Bergmann, Estelle and Birnbaum2013). Altogether these results support the notion that root tissues exhibit unique cellular processes that may be linked to function.
3.4. Identification of spatially distinct auxin gene regulatory networks within primary roots
To infer regulatory relationships between auxin-responsive root transcription factors and their targets we generated a GRN. To reconstruct the predictive GRN we implemented our network inference pipeline, SC-ION, which is an extension of RTP-STAR and has been shown previously to successfully identify novel TF roles in response to hormone treatment (Clark et al., Reference Clark, Buckner, Fisher, Nelson, Nguyen, Simmons, de Luis Balaguer, Butler-Smith, Sheldon, Bergmann, Williams and Sozzani2019; Reference Clark, Nolan, Wang, Song, Montes, Valentine, Guo, Sozzani, Yin and Walley2021; Van den Broeck et al., Reference Brunoud, Wells, Oliva, Larrieu, Mirabet, Burrow, Beeckman, Kepinski, Traas, Bennett and Vernoux2021) (See Section 2for details). The resulting GRN consisted of 15,856 nodes (genes) with a total of 86,461 directed edges (Figure 4 and Supplemental Table S3). A circular layout visualization of the complete GRN illustrates the presence of several distinct groups (circles) based on their underlying tissue enrichment, either within a singular root region (meristematic zone, elongation zone, cortex, or stele) or between multiple combinatorial root zones based on SC-ION generated ICA clustering assignments (Supplemental Table S3).
The nodes contained within our GRN fell into one of 14 tissue enrichment groups with content sizes ranging from 2,862 nodes enriched in the cortex + stele (group 1) down to 98 nodes in the meristematic zone + elongation zone + cortex (group 14). The tissue enrichment groupings also featured varying numbers of auxin-responsive genes and a high degree of interconnectedness as evidenced by the number of edges linking nodes within a grouping. The GRN contained a total of 1,372 unique DE transcription factors thus we investigated the predicted regulatory relationships of these transcription factors and their targets that are known to be involved in auxin signaling and maize root architecture (Figure 4 and Supplemental Table S3). Root development-associated transcription factors represented in the data include LBD-transcription factor family members and multiple members of the maize SHI/STY (SRS) family (Gomariz-Fernández et al., Reference Gomariz-Fernández, Sánchez-Gerschon, Fourquin and Ferrándiz2017), such as the known transcriptional activator lateral root primordia 1 (Zm00001d011843) that is required for maize root morphogenesis (Zhang et al., Reference Zhang, Behrens, Zimmermann, Ludwig, Hey and Hochholdinger2015). In addition, a known auxin-induced transcription factor that is required for maize root development, RTCS1 (Zm00001d027679) (Tai et al., Reference Tai, Opitz, Lithio, Lu, Nettleton and Hochholdinger2016; Taramino et al., Reference Taramino, Sauer, Stauffer, Multani, Niu, Sakai and Hochholdinger2007; Xu et al., Reference Xu, Tai, Saleem, Ludwig, Majer, Berendzen, Nagel, Wojciechowski, Meeley, Taramino and Hochholdinger2015), was predicted in the GRN to regulate 57 target genes including the auxin-responsive gene AUX/IAA32 (Zm00001d018973) (Supplemental Table S3). A previous study identified putative targets of RTCS1 (also called RTCS) from embryonic transcriptional data that included cell cycle and auxin pathway genes (Tai et al., Reference Tai, Opitz, Lithio, Lu, Nettleton and Hochholdinger2016). Our results provide a novel putative set of root-expressed RTCS1 targets that can support further research on this key TF.
ARF transcription factors represent a critical regulatory component of the auxin response, thus we set out to inspect their target gene relationships within the GRN at a deeper level. First, we identified all of the annotated ARFs present in the GRN and observed that 27 of the 33 expressed maize ARF family members were present in the GRN (according to the ARF nomenclature from Galli et al. (Reference Galli, Liu, Moss, Malcomber, Li, Gaines, Federici, Roshkovan, Meeley, Nemhauser and Gallavotti2015). For these 27 ARFs and their first node neighbor targets, we generated subnetworks that were visualized in perfuse force-directed layout in Cytoscape (Figure 5 and Supplemental Table S4). These 27 ARFs are predicted to regulate 2,067 unique target genes at either 30 or 120 min. Notably, representative ARFs from each of the four distinct evolutionary ARF clades (Galli et al., Reference Galli, Khakhar, Lu, Chen, Sen, Joshi, Nemhauser, Schmitz and Gallavotti2018) were found to be present in the GRN, including 12 clade A ARFs, 6 clade B ARFs, 4 clade C ARFs, and 5 ETTIN-like ARFs (visualized as pink nodes in Figure 5). In general, most ARFs had target nodes that were DE in response to auxin (coded blue and orange in Figure 5) and exhibit unique target genes. In three instances there are several ARFs that have shared target genes, including ARF18 and ARF7; ARF8, ARF23 and ARF25; and ARF24 and ARF36. Notably, the ARFs with shared targets span phylogenetic clades, suggesting that the properties of ARFs cannot be predicted based on sequence evolution alone. In addition, we examined the ARF target genes and found that they include auxin-related genes belonging to the ARF (5), Aux/IAA (8), SAUR (3), and GRETCHEN HAGEN (GH3) (1) families. Such targets are well-known types of auxin-responsive genes (Bargmann et al., Reference Bargmann, Vanneste, Krouk, Nawy, Efroni, Shani, Choe, Friml, Bergmann, Estelle and Birnbaum2013; Galli et al., Reference Galli, Khakhar, Lu, Chen, Sen, Joshi, Nemhauser, Schmitz and Gallavotti2018; Lewis et al., Reference Lewis, Olex, Lundy, Turkett, Fetrow and Muday2013; Mutte et al., Reference Mutte, Kato, Rothfels, Melkonian, Wong and Weijers2018; Nemhauser et al., Reference Nemhauser, Hong and Chory2006) and indicate that ARF proteins are engaged in feedback loops.
In this work, we utilized a combinatorial approach of transcriptome analysis and gene network inference to identify temporally auxin-responsive genes across root tissue types. By elucidating the complex inner workings of auxin-mediated gene expression during primary maize root development we can begin to answer questions surrounding root architecture in this key crop. A molecular understanding of the dynamics of root growth can aid in informing strategies to create next-generation crops with more efficient water and nutrient uptake capabilities.
Acknowledgement
We wish to thank Diana Burkart for her guidance with Lexogen QuantSeq data analysis and Natalie Clark for her assistance with SC-ION.
Financial support
This work was supported by USDA NIFA AFRI Predoctoral Fellowship to MRM (Award No. 2021-67034-35188), USDA NIFA AFRI grant to DRK and JWW (Award No. 2020-67013-30914), start-up funds to DRK from Iowa State University (ISU), funding from the ISU Plant Science Institute to JWW, and Hatch Act and State of Iowa funds to DRK (Project No. IOW03649) and JWW (Project No. IOW04108).
Conflicts of interest
The authors declare no conflicts of interest.
Authorship contributions
Conceptualization: D.R.K.; Data curation: M.R.M., L.D.; Formal analysis: M.R.M., L.D.; Funding acquisition: J.W.W., D.R.K.; Investigation: M.R.M., L.D.; Project administration: J.W.W.; Resources: M.A.D., M.G.L.; Software: C.M.; Supervision: J.W.W., D.R.K.; Visualization: D.R.K.; Writing—original draft: J.W.W., D.R.K.; Writing—review and editing: M.R.M., L.D.
Data availability statement
Raw sequencing data (FASTQ files) are deposited at the NCBI Sequence Read Archive (BioProject accession number PRJNA791716). Code to extract gene identifiers among shared lists of differentially expressed genes within an UpSet plot is available from a GitHub repository: https://github.com/mmcreyno92/AuxinRootAtlas. TF-centred GRNs were inferred using SC-ION version 2.1 (https://doi.org/10.5281/zenodo.5237310; Clark et al., Reference Clark, Nolan, Wang, Song, Montes, Valentine, Guo, Sozzani, Yin and Walley2021).
Supplementary Materials
To view supplementary material for this article, please visit http://doi.org/10.1017/qpb.2022.17.


 Open access
Comments
January 28, 2022
Dear Editors,
We wish to submit a manuscript entitled “Temporal and spatial auxin responsive networks in maize primary roots” for consideration by Quantitative Plant Biology as an original research article. We confirm that this work is original and has not been published elsewhere, nor is it currently under consideration for publication elsewhere. We have no conflicts of interest to disclose.
Auxin is a classical phytohormone that is well known to regulate gene expression in planta. An outstanding question in the field is how auxin responsive gene networks are shaped in key crops such as Zea mays (corn). In this manuscript, we have characterized auxin-mediated transcriptome profiles across four regions of maize primary roots at two time points (30 and 120 minutes) using 3’ end mRNA sequencing. These transcriptomic data is a high-quality resource that will be useful for researchers working at molecular scales across laboratory and field sources. We identified differentially expressed genes across temporal and spatial scales that are up- and down-regulated by auxin based on these data. Auxin regulated genes within maize root regions are enriched in biological processes such as cell cycle control and hormone signaling. Furthermore, using these data we have reconstructed auxin responsive gene regulatory networks (GRNs). We believe that this manuscript is appropriate for publication by Quantitative Plant Biology because it fits well with the journal scope to support large dataset resources and incorporate correlative data to generate robust predictions.
If you feel that the manuscript is appropriate for your journal, we suggest the following reviewers based on their expertise in these areas:
Matthew Brooks (USDA ARS; mb5886@illinois.edu)
Andrea Eveland (Donald Danforth Plant Science Center; aeveland@danforthcenter.org)
Bastiaan Bargmann (Virginia Tech; bastiaan@vt.edu)
Gloria Muday (Wake Forest muday@wfu.edu)
Please address all correspondence concerning this manuscript to jwalley@iastate.edu or dkelley@iastate.edu (co-corresponding authors). Thank you for your consideration of this manuscript.
Sincerely,
Dior R. Kelley & Justin W. Walley
Iowa State University