


The main approach in prevention and treatment of obesity is promotion of a healthy diet and physical activity. However, for a large proportion of individuals with overweight and obesity, it can be very difficult to achieve weight loss through conventional lifestyle changes alone( 1 – Reference Lagerros and Rössner 3 ). A low-energy diet (LED) seems to be an effective approach for rapidly inducing a weight loss pronounced enough to improve cardiometabolic risk factors( Reference Apfelbaum, Fricker and Jgoin-Apfelbaum 4 ). To improve cardiometabolic risk factors by weight loss, primarily loss of fat mass and relative maintenance of fat-free mass (FFM) are generally seen as beneficial( Reference Haslam and James 2 ). Additionally, relative maintenance of FFM seems beneficial to avoid a greater-than-expected drop in resting metabolic rate, which may impact the maintenance of the weight loss( Reference Leibel, Rosenbaum and Hirsch 5 – Reference Wing and Hill 7 ). An LED is defined by an energy intake restricted to 3347–5020 kJ/d, in which a number of formula diets are designed to attain along with provision of all essential nutrients( Reference Ross, Caballo and Cousins 8 ). The formula diets provide a relatively high protein intake to preserve FFM. Nevertheless, maintenance of FFM during weight loss may depend on the protein intake per d (g) during the LED relative to the individuals’ initial FFM (kg)( Reference Stiegler and Cunliffe 6 ). The protein intake needs to be sufficient to prevent negative nitrogen balance, which is dependent on the individual’s amount of FFM when initiating the LED( Reference Demling and DeSanti 9 ). Thereby, it may be beneficial to adjust the protein content provided per d from the LED dependent on the individual’s FFM when prescribing a treatment with an LED. Additionally, the degree of weight loss success obtained with an LED may be dependent on many different non-nutritional factors( Reference Verhoef, Camps and Gonnissen 10 ). Identifying behavioural characteristics associated with individual success on an LED could be valuable in order to identify the individuals in need for additional support during an LED and thereby optimise the individual’s outcome of an LED. Adhering to an LED requires a substantive effort from the individual, and it is expected that a high chance of success could be an important factor for motivation. Furthermore, achieving the possible benefits from a weight loss may be valuable from a socioeconomic point of view. Thereby, the ability to predict whether an individual is likely to obtain a weight loss and the benefits hereof from an LED may be advantageous to determine whether it is relevant to dedicate resources for this treatment in order to prevent disease.
Therefore, this study investigated the effect of an 8-week LED providing 5020 kJ/d for men and 4184 kJ/d for women (84/70 g protein/d) among overweight adults to induce a successful weight loss with the two major aims:
To determine whether individual protein intake (g protein/d per kg FFM at baseline) from the LED was associated with the proportion of weight lost as FFM.
To determine potential behavioural characteristics associated with the degree of weight loss success with an LED. These evaluations included measures of eating behaviour, physical activity, sleep and stress at baseline as well as changes during the LED.
Methods
This paper comprises data collected during an LED carried out as a part of the European Union (EU) project Satiety Innovation (SATIN) work package 5. This was a multi-centre study including participants from Denmark (Copenhagen), Spain (Reus) and England (Liverpool). The main objective was to examine if consumption of food products designed to reduce appetite was associated with improved weight loss maintenance following an initial weight loss of at least 8 % achieved through an 8-week LED. At least 8 % weight loss was required during the LED in order to allow subsequent assessment of weight loss maintenance. This paper presents data from the LED period only.
Study participants
Men and women with overweight or obesity but otherwise healthy were recruited for the study based on advertisement through different media sources. Participants met inclusion criteria if they were aged between 20 and 65 years, had BMI ≥27·0 and ≤35·0 kg/m2 and fat mass ≥ 23 % (assessed by bio-impedance).
Exclusion criteria included contraindications related to the use of the LED or the study products used during the weight loss maintenance period: allergy and/or intolerance for components of the LED products and/or study products used during the weight loss maintenance period, dislike of the LED products and/or study products for the weight loss maintenance period, known diseases which may affect energy expenditure and/or appetite, dietary patterns interfering with the study protocol (e.g. vegetarians who would be unable to consume the standardised meals at appetite probe days during the weight loss maintenance period), body weight changes ±3 kg in the last three months prior to inclusion, engagement in strenuous exercise ≥5 h/week, smoking or smoking cessation within the past 3 months and/or nicotine use (including electronic cigarettes), pregnancy or lactation, diabetes mellitus, CVD, systolic blood pressure above 160 mmHg and/or diastolic blood pressure above 100 mmHg whether on or off treatment for hypertension (if treated, the treatment should have been stable within the last 3 months when included), chronic kidney disease, liver disease, active inflammatory bowel disease, coeliac disease, chronic pancreatitis or other disorder potentially causing malabsorption, cancer (active malignant cancer or history of malignancy within the last 5 years), previous bariatric surgery, history of extensive small or large bowel resection, known endocrine origin of obesity (except for stably treated hypothyroidism), transmissible blood-borne diseases, any recent surgical procedure not fully recovered, use of prescription medication or use within the previous month that has the potential of affecting body weight, Hb concentration below local laboratory reference values, regular consumption of alcohol above recommendations; >21 alcoholic units/week for men or >14 alcoholic units/week for women, drug abuse, psychological or psychiatric disorders possible to interfere with the study.
The study was carried out in accordance with Good Clinical Practice and the study protocol and study forms complied with the relevant sections of the Declaration of Helsinki. Participants received written and oral information about the study and written informed consent was obtained before any study-related procedures were initiated. Recruitment and testing took place at the Department of Nutrition, Exercise and Sports, University of Copenhagen, Denmark between January and November 2016, the Department of Biochemistry and Biotechnology, University Rovira i Virgili; Institute of Health IISPV; The Spanish Biomedical Research Centre in Physiopathology of Obesity and Nutrition (CIBERobn), ISCIII between January and December 2016 and the Department of Psychological Sciences, Institute of Psychology, Health and Society, University of Liverpool between April 2016 and July 2017. The study was approved by the Municipal Ethical Committee of Copenhagen/Scientific Ethics Committee of the Metropolitan regions of Denmark (journal no. H-15008553), the Danish Data Protection Agency (journal no. 2015-57-0117), the Clinic Investigation Ethical Committee of the Hospital University Sant Joan de Reus (journal no. 15-07-30/7assN2); sponsorship was obtained from University of Liverpool (reference: UoL001153) and related ethical approval from Preston NRESCommittee NorthWest (health research authority) (journal no. 16/NW/0135) and was registered on www.clinicaltrials.gov; ID NCT02485743. All study procedures were aligned between sites before initiation of the study and on-site monitoring visits were carried out by an independent monitor.
Visits
The study comprised of a screening visit and additionally sixteen visits to the study facilities. This paper includes data from the first eight of these visits, which were related to the LED (Fig. 1). After providing informed consent, screening visits (visit 1) were scheduled identifying participants eligible for inclusion. At the first study visit (visit 2), taking place within 4 weeks from the screening visit, baseline measurements were performed. No more than 10 d after the baseline measurements, the participants consulted a dietitian at a group session where the LED was introduced and initiated. During the LED, the participants met every second week at group sessions for weighing, provision of the formula diet and for support from each other and the dietitian (visits 3–6). The LED was completed after the fifth group session (visit 7; 8 weeks after initiation of the LED), at which point the weight loss percentage was calculated for each individual. After 7–10 d of stabilisation to a normal diet, all participants (also those achieving <8 % weight loss and thereby no longer included in the study) were invited for the post-LED measurements (visit 8). The stabilisation period served to regain normal muscle glycogen stores in order to avoid affecting body composition and to stabilise blood parameters to avoid potential effects of an ongoing negative energy balance.
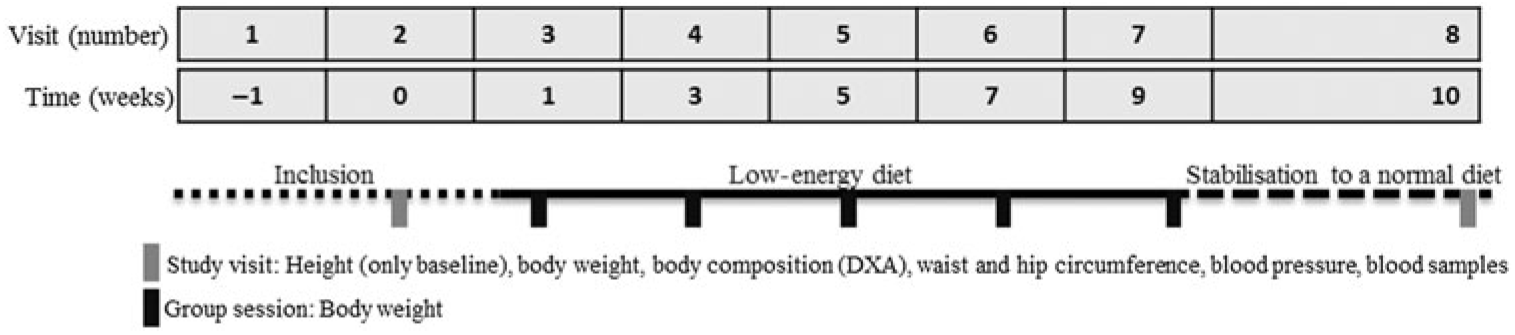
Fig. 1. Overview of the study design and data collection involved in the seven visits that include data related to the low-energy diet period. The participants followed the low-energy formula diet from week 1 (visit 3) to week 9 (visit 7). DXA, dual-energy X-ray absorptiometry.
Low-energy diet
During the 8-week LED, men were assigned to consume 5020 kJ/d and women 4184 kJ/d, that is, six and five servings/d of Modifast® (Nutrition et Santé SAS) formula diet (provided as shakes, mousses and soups). The macronutrient composition of the diet was about 20 % energy from fat, about 25 % energy from protein and about 55 % energy from carbohydrate, varying slightly depending on the specific products consumed. Hence, the daily protein intakes were about 84 and 70 g for men and women, respectively, assuming 100 % compliance to the prescribed formula diet.
The participants were instructed thoroughly how to prepare the products. Along with the LED, the participants were allowed to drink coffee and tea without milk and sugar, drink water and artificially sweetened soft drinks, chew/eat sugar-free chewing gum or pastilles (no more than six pieces/d), and to eat a maximum of 375 g vegetables high in water and low in fibre such as cucumbers, tomatoes and lettuce. Dietitians ensured compliance with the prescribed diet based on the participants’ diaries.
Anthropometric measurements
Body weight while wearing light clothing and having emptied the bladder was measured to the nearest 0·1 kg on calibrated scales (Copenhagen: Lindell Tronic 8000, Samhall Lavi; Reus: Tanita SC-331S, Tanita Corporation of America Inc.; Liverpool: Seca 799 Electronic Column Scales Class (lll)) in a fasting condition at screening, baseline and post-LED (visits 1, 2 and 8: Fig. 1), in a non-fasting condition at the group sessions (visits 3–6: Fig. 1) and in a semi-fasted state (minimum 4 h) at the last group session assessing the percentage weight loss (visit 7: Fig. 1). At baseline, height without shoes was measured to the nearest 0·5 cm using wall-mounted stadiometers (Copenhagen and Reus: Seca; Liverpool: Seca 220 Telescopic Measuring Rod). BMI was calculated with the formula: body weight [kg]/(height[m])2. Body composition measured at baseline and post-LED was determined by dual-energy X-ray absorptiometry (DXA) (GE Lunar iDXA, Encore software: Copenhagen and Liverpool: version 16.2; Reus version 13.4). Waist and hip circumferences while wearing light clothing were measured to the nearest 0·5 cm using a non-elastic tape measure. The waist circumference was measured at the midpoint between the bottom of the rib cage (last floating rib) and the top of the iliac crest with the measuring tape around the trunk in a horizontal plane. The hip circumference was measured at the widest point between the hips and buttocks. Once the measuring tape was placed, the participants were asked to relax with both arms at his/her side and to breathe normally in order to take each measurement on the exhales( 11 ).
Blood pressure and biochemical measurements
Calibrated automatic devices were used for the measurements of blood pressure (Copenhagen: A&D Medical UA-779; Reus: Omron 705IT; Liverpool: Omron 705 CP-II). The participants were asked to empty their bladder and were placed in a resting position for 5–10 min prior to the measurements. To minimise ‘the white coat effect’, the sub-investigator measuring the blood pressure stayed in the room when the participants were resting. Appropriate arm cuffs were placed at participants’ right arm in direct contact with the skin. The measurements were recorded to the nearest 1 mmHg.
Blood samples were collected from the antecubital vein with the participant in at least 10 h of fasting state (besides a maximum of 500 ml of water) and after at least 5-min rest and in a supine position. The blood samples were analysed for glucose, insulin, total cholesterol, HDL, LDL, VLDL, TAG, alanine-aminotransferase, aspartame-aminotransferase, γ-glutamyl-transferase, leptin, C-reactive-protein, adiponectin and IL-6. Plasma was obtained by centrifugation at 1800 g for 15 min at 4°C and stored at −80°C until use. All parameters were determined by routine laboratory tests using standardised protocols.
Measures of behavioural characteristics
Self-administrated questionnaires assessing behavioural characteristics were handed out for the participants to complete in relation to the study visits at baseline and after completing the LED. The participants could complete the questionnaires at home right before or after the study visits. A standard front page, layout and introduction text was attached and the questions were always presented in the same order as in the validated versions.
Eating behaviour
Eating behaviour was assessed by the validated Three-Factor Eating Questionnaire (TFEQ), including fifty-one questions related to appetite and eating behaviour generating scores of: restraint (cognitive control of the frequency, amount and types of food being eaten); disinhibition (lack of control over eating behaviour in spite of conscious awareness hereof); hunger (susceptibility to hunger)( Reference Stunkard and Messick 12 ). The minimum to maximum score is 0–21, 0–16 and 0–14 for restraint, disinhibition and hunger, respectively( Reference Stunkard and Messick 12 ).
Physical activity and sleep
Participants were asked to wear an ActiGraph™ tri-axis accelerometer monitor (GT3X+) tightly on the right hip using an elastic belt for seven consecutive days and eight nights (entire 24-h period). They were only allowed to remove the accelerometer during water activities (i.e. showering or swimming). At the end of the observation period, data were reintegrated to 60-s epochs and analysed using ActiLife6 (the ActiGraph 2012, ActiLife version 6). Participants were instructed to keep logs for bedtime (‘lights off’ and ’trying to sleep’) and waking time (‘lights on’) during the week in which the accelerometer was worn.
Before analysis of physical activity and sedentary time, we removed self-reported sleep duration as well as non-wear time defined as 60 min of consecutive zeros using vector magnitude, allowing for 2 min of non-zero interruptions with a maximum of 100 counts/min (CPM). Total physical activity (CPM) was expressed as vector magnitude of the total tri-axial counts from monitor wear time divided by monitor wear time. Time spent in a sedentary state, doing light physical activity and moderate-to-vigorous physical activity (MVPA) were defined as all min showing <200, 200–2689 and ≥2690 vector magnitude CPM, respectively( Reference Sasaki, John and Freedson 13 ). The weekly averages of total physical activity, MVPA and sedentary time were calculated in the proportion of five to two between weekdays (Monday to Friday) and weekend days (Saturday and Sunday) and were only considered valid if monitor wear time was at least 10 h/d (excluding sleep duration) for a minimum of one weekday and one weekend day.
To estimate accelerometer-determined sleep duration, the self-reported bedtimes and waking times were used as the possible window of sleep and accelerometer data within this window were scored in ActiLife6 using the algorithm by Sadeh et al.( Reference Sadeh, Sharkey and Carskadon 14 ). The weekly average of sleep duration was calculated in the proportion of five to two between weekdays (Sunday to Thursday) and weekend days (Friday and Saturday). Sleep duration was only considered valid if it was measured for a minimum of one weekday and one weekend day. The intra-participant standard deviation of the sleep duration was used to represent sleep variability. Sleep duration estimated from the hip has been found to correlate well with that estimated from the wrist( Reference Hjorth, Chaput and Damsgaard 15 ).
Sleep quality was estimated through the validated Pittsburgh Sleep Quality Index (PSQI)( Reference Buysse, Reynolds and Monk 16 ). The PSQI estimates long-term sleep habits during the past month based on nineteen self-rated questions. These nineteen items are combined to form seven component scores; each of which has a range from 0 to 3 points. In all cases, a score of ‘0’ indicates no sleep difficulty, while a score of ‘3’ indicates severe difficulty. The seven component scores are then added to yield one global score, with a range of 0–21 points, ‘0’ indicating no difficulty and ‘21’ indicating severe difficulties in all areas( Reference Buysse, Reynolds and Monk 16 ).
Level of stress
Level of stress was estimated through the Perceived Stress Scale (PSS)( Reference Cohen, Kamarck and Mermelstein 17 ). The PSS estimates long-term perceived stress and measures stress related to emotions and thoughts the preceding month through ten questions. Each question has five possible answers resulting in a summed score across all scale items with ‘0’ indicating no perceived stress( Reference Cohen, Kamarck and Mermelstein 17 ).
Statistical analyses
Baseline characteristics were summarised using means with standard deviations.
To assess the degree of weight loss success, linear mixed models were fitted including adjustment for visit, age and baseline BMI (fixed effects) as well as participant and site (random effects). Since body weight developments were different for men and women, separate analyses were carried out for assessing the LED efficacy and efficiency. Since the post-LED data represent a somewhat selective group (explained in the flow chart: Fig. 2), two analyses of body weight were carried out: (1) all participants completing the LED; (2) intention-to-treat (ITT) analysis of all participants initiating the LED with last observation carried forward for those not completing the LED or not attending the post-LED measures. ITT analyses were only done for body weight. Some participants did lose weight but were not DXA scanned, etc. afterwards. Thereby, it would not be representative to carry the baseline measure of, for example, body composition forward.
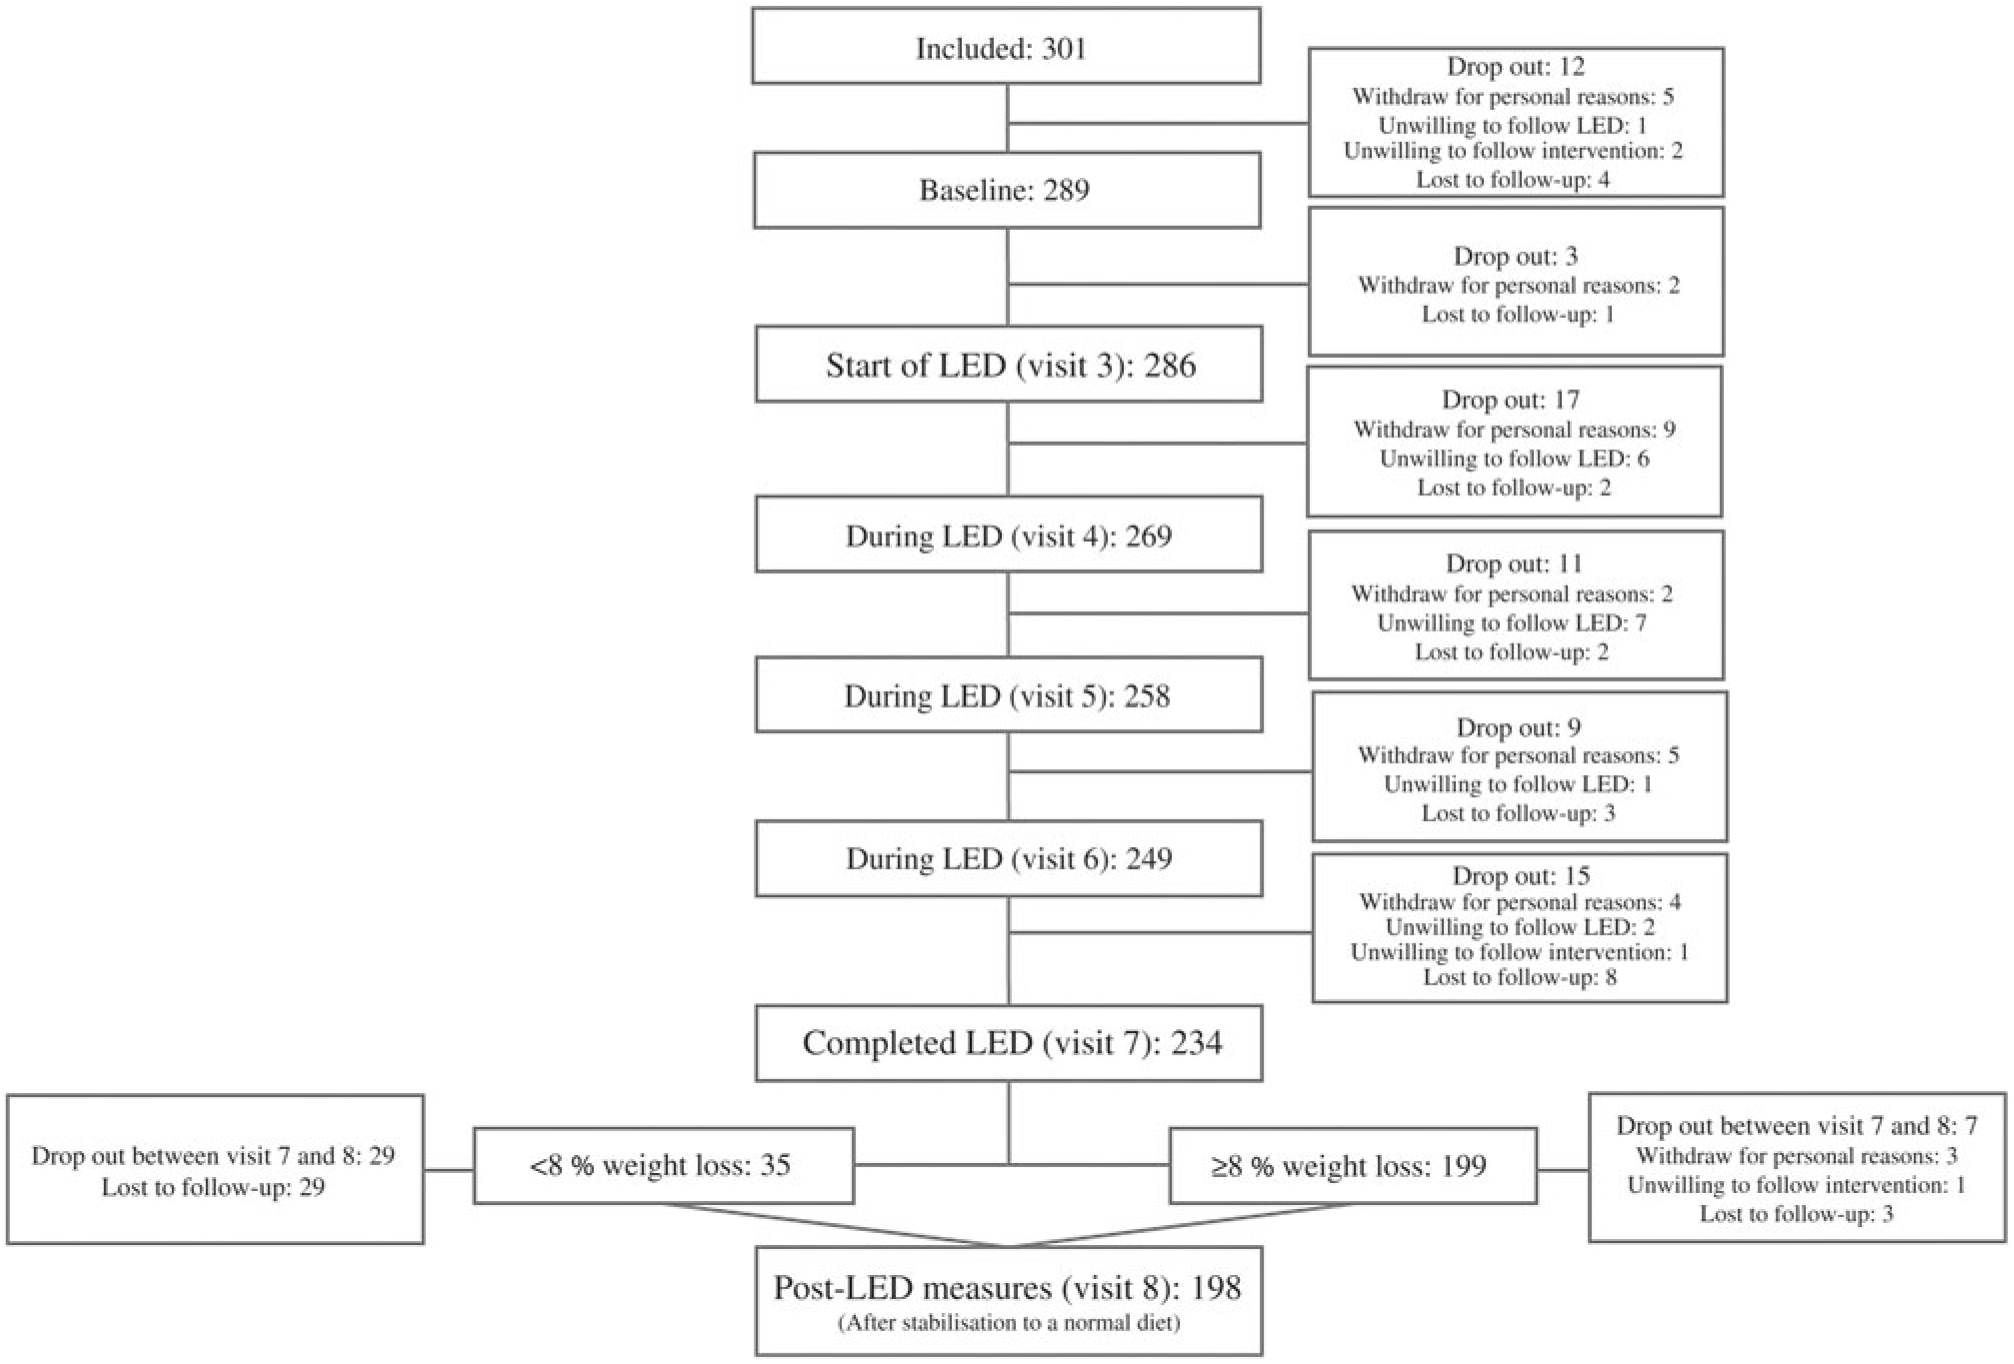
Fig. 2. Flow chart of participants completing each visit. LED, low-energy diet.
To assess the two aims investigated, linear mixed models were fitted including adjustment for age and baseline BMI (fixed effects) as well as site (random effect). Associations between behavioural characteristics and degree of weight loss success were analysed combined for men and women but adjusted for sex (fixed effect).
As age and baseline BMI was expected to influence weight loss and the potential effects seen from the weight loss, all analyses were adjusted for these two variables.
For all models, assumptions of normality and homogeneity of variance were assessed through visual inspection of histograms and quantile–quantile plots and plots of residuals against the fitted values. Results are shown as means with 95 % CI. Statistical analyses were carried out using Stata/SE 15 (StataCorp). Statistical significance was declared using a significance level of 0·05.
Results
Study population
From the total of 374 participants who responded to the advertisements, 301 participants were eligible for inclusion, but twelve dropped out prior to the first study visit resulting in 289 participants completing the baseline measurements before initiating the LED. Before initiation of the LED, a total of fifteen participants dropped out due to unwillingness to comply with the study protocol and for personal reasons. Thereby, 286 participants initiated the LED of which sixty-four were men and 222 women. Number of participants completing each visit is presented in Fig. 2. Of those initiating the LED, mean age was 46·0 (sd 10·7) years (range: 20–65 years) and they had a body weight of 87·8 (sd 11·2) kg and BMI of 31·1 (sd 2·2) kg/m2.
Table 1 shows baseline characteristics stratified by sex for all participants initiating the LED. Additionally, Table 2 shows baseline characteristics, post-LED values and LED changes stratified by sex for all participants completing the LED and attending the study visit after the LED.
Table 1. Baseline anthropometrics, cardiometabolic risk factors and behavioural characteristics for all participants initiating the low-energy diet (completing visit 3: Figs. 1 and 2)
(Mean values and standard deviations)
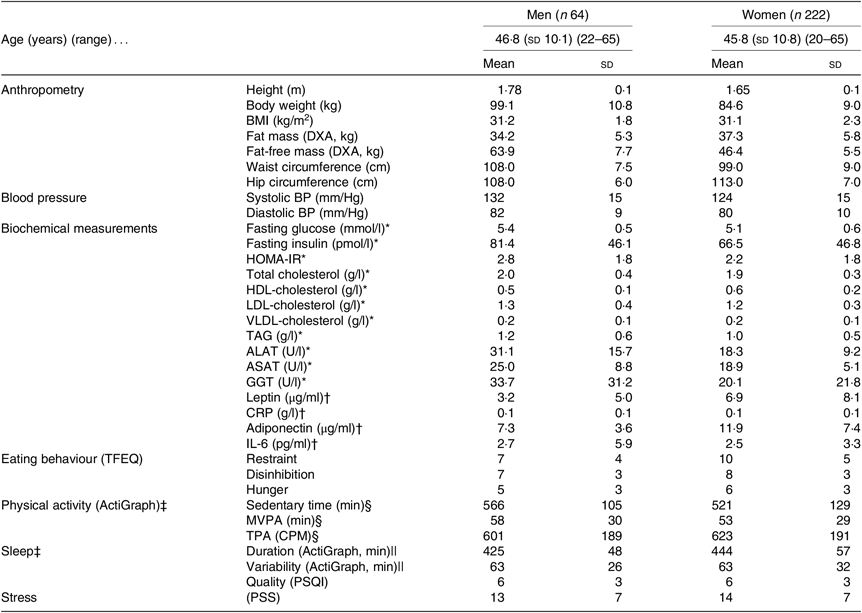
DXA, dual-energy X-ray absorptiometry; BP, blood pressure; HOMA-IR, homeostatic model assessment-insulin resistance; ALAT, alanine-aminotransferase; ASAT, aspartame-aminotransferase; GGT, γ-glutamyl-transferase; CRP, C-reactive-protein; TFEQ, Three-Factor Eating Questionnaire (high scores indicate less control of eating behaviour); MVPA, moderate to vigorous physical activity; TPA, total physical activity; CPM, counts/min; PSQI, Pittsburgh Sleep Quality Index (high scores indicate worse sleep quality); PSS, Perceived Stress Scale (high scores indicate more stress).
* Blood samples only obtained from 8/15 men and 20/41 women from the English site.
† Samples from forty-nine men and 181 women only from the Danish and Spanish sites.
‡ The accelerometer was worn for a mean of 7 (SD 1) d and 7 (SD 1) nights with a wear-time of 966 (sd 98) min/d between wake up and bedtime.
§ Valid data from fifty-one men and 184 women.
|| Valid data from forty-six men and 167 women.
Table 2. Anthropometrics, cardiometabolic risk factors and behavioural characteristics before and after the low-energy diet (LED) along with changes for all participants completing the LED and attending the post-LED measures (visit 8: Figs. 1 and 2)
(Mean values and standard deviations; mean values and 95 % confidence intervals)
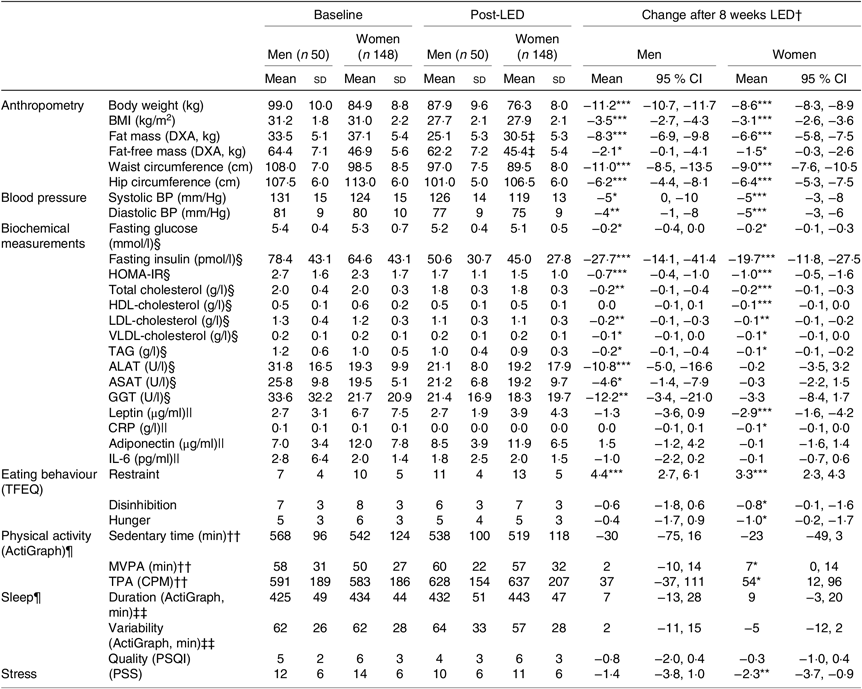
DXA, dual-energy X-ray absorptiometry; BP, blood pressure; HOMA-IR, homeostatic model assessment-insulin resistance; ALAT, alanine-aminotransferase; ASAT, aspartame-aminotransferase; GGT, γ-glutamyl-transferase; CRP, C-reactive-protein; TFEQ, Three-Factor Eating Questionnaire (high scores indicate less control of eating behaviour); MVPA, moderate to vigorous physical activity; TPA, total physical activity; CPM, counts/min; PSQI, Pittsburgh Sleep Quality Index (high scores indicate worse sleep quality); PSS, Perceived Stress Scale (high scores indicate more stress).
Significance of mean value of change from baseline to post-LED: *P < 0·05, **P < 0·01, ***P < 0·001.
† Changes in all measurements assessed at baseline (visit 2) to post-LED (visit 8) were analysed by linear mixed models including adjustment for visit, age and baseline BMI (fixed effects) as well as participant and site (random effects).
‡ Data from 139 women.
§ Data available from forty-four men and 133 women.
|| Samples from forty-one men and 125 women only from the Danish and Spanish sites.
¶ The accelerometer was worn for a mean of 7 (SD 1) d and 7 (SD 1) nights with a wear-time of 966 (SD 98) min/d between wake up and bedtime at baseline and 7 (SD 1) d and 7 (SD 1) nights with a wear-time of 958 (SD 87) min/d between wake up and bedtime post-LED.
†† Valid data from forty men and 126 women.
‡‡ Valid data from thirty-seven men and 116 women.
A total of 199 of the 234 participants completing the 8-week LED reached the weight loss goal of ≥8 %. Of these, 96 % completed the post-LED measures, whereas only 17 % of those participants achieving <8 % weight loss accepted to complete the post-LED measures.
Efficacy and efficiency of the low-energy diet to induce a successful weight loss
For all participants initiating the LED (n 286), 82 % completed the LED and 70 % achieved weight loss ≥8 %. Of those completing the LED (n 234), 85 % achieved weight loss ≥8 %.
Weight loss varied between men and women (χ2(6) = 197·4, P < 0·001). Thus, the changes in body weight, anthropometrics, cardiometabolic risk factors and behavioural characteristics for participants completing the LED and attending the post-LED measures (visit 8: Figs. 1 and 2), are stratified by sex and presented in Table 2.
For all participants completing the post-LED measures (n 198), the mean weight loss after 8 weeks of LED (visit 7: Fig. 1) was 9·4 (95 % CI 9·2, 9·7) kg corresponding to 11 (95 % CI 10, 11) %. After the stabilisation period (visit 8: Fig. 1), the weight loss was 9·3 (95 % CI 9·0, 9·5) kg, of which 7·1 (95 % CI 6·8, 7·5) kg was loss in fat mass and 1·6 (95 % CI 1·4, 1·9) kg was loss in FFM.
For all the participants that initiated the LED and with last observation carried forward for those not completing the LED or not attending the post-LED measures (n 286), the weight loss after 8 weeks of LED (visit 7: Fig. 1) was 7·6 (95 % CI 7·3, 7·9) kg corresponding to 8 % (ranging from −2 to 19 %). After the stabilisation period (visit 8: Fig. 1), the weight loss was 7·5 (95 % CI 7·2, 7·8) kg.
Changes in body weight for the participants completing the LED and for the participants initiating the LED divided by all the visits measuring body weight is illustrated in Fig. 3 for men and women, respectively.
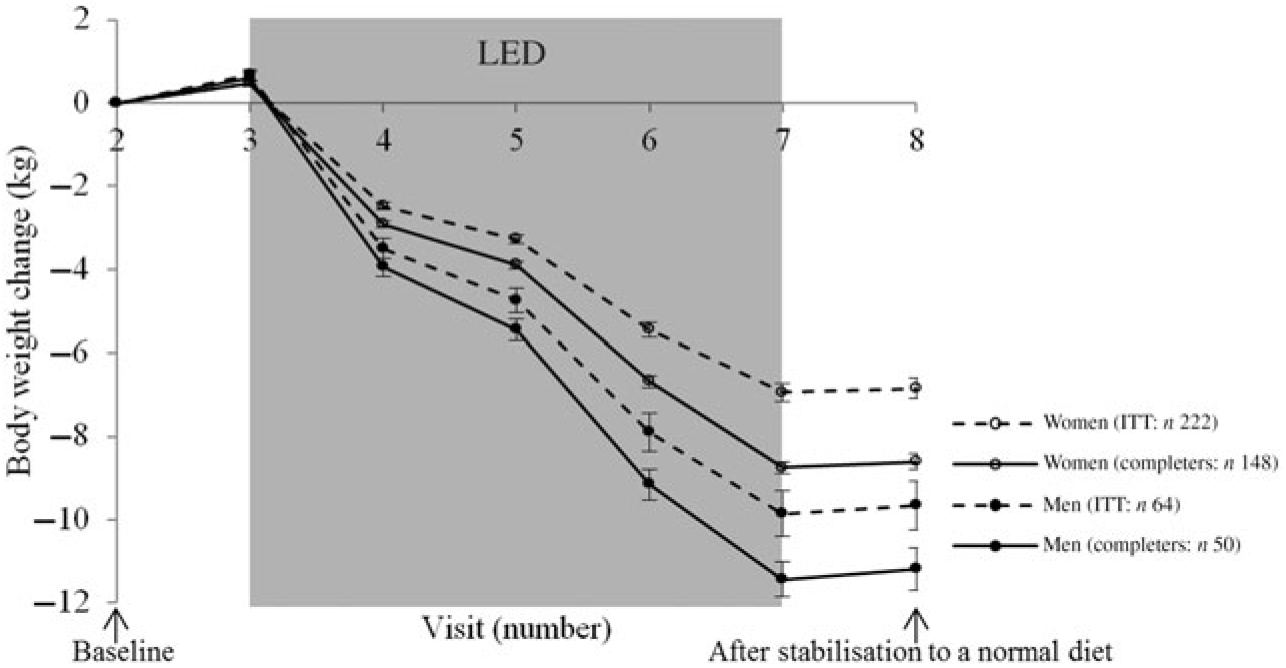
Fig. 3. Body weight change from each visit for men and women, respectively. Values are means, with standard errors represented by vertical bars. Intention-to-treat (ITT) analyses with last observation carried forward for those not completing the low-energy diet (LED) or not attending the post-LED measures.
Relationship between protein intake relative to initial fat-free mass and proportion of weight lost as fat-free mass
Median protein intake was 1·3 (range 1·0–1·6) g protein/d per kg FFM at baseline for men (n 49) and 1·5 (range 1·1–2·2) g protein/d per kg FFM at baseline for women (n 137). Mean percentage proportion of weight lost as FFM was 17 (95 % CI 14·6, 19·2) % (men: 19 (95 % CI 15·9, 22·2) %; women: 16 (95 % CI 13·3, 19·1) %). No relationship between protein intake/d per kg FFM at baseline and proportion of weight lost as FFM was found (P = 0·64) (Fig. 4). Data were analysed for both sexes combined since there was neither interaction between sex and amount of protein/d per kg FFM at baseline (χ2(1) = 1·43, P = 0·2314) nor impact of adjustments for sex (χ2(1) = 0·75, P = 0·39). Only three participants who did not achieve the ≥8 % weight loss were DXA scanned. Therefore, the population for this analysis comprised a total of 186 (forty-nine men and 137 women) participants who completed the LED with ≥8 % weight loss and attended the post-LED measures (visit 8: Figs. 1 and 2).
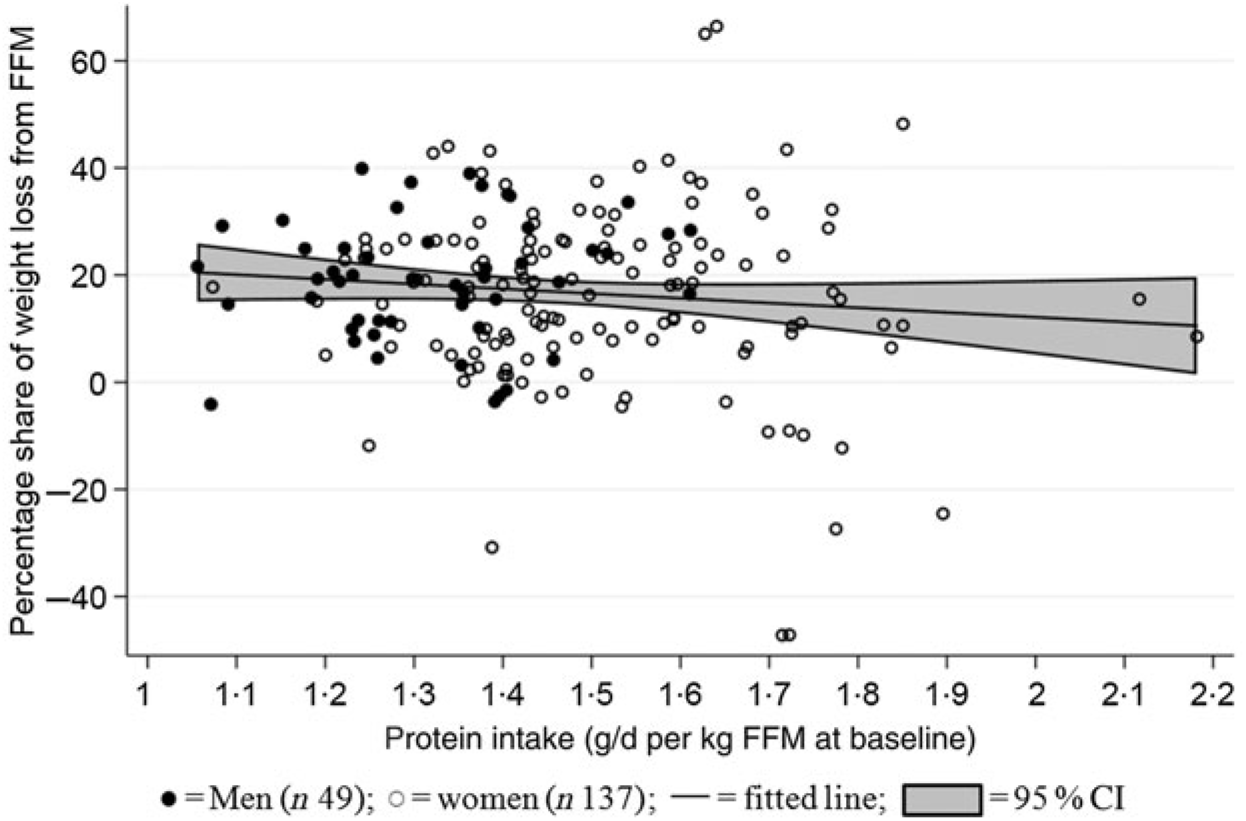
Fig. 4. Relationship between protein intake relative to initial fat-free mass (FFM) and relative loss of FFM. The linear mixed model was fitted including adjustment for age and baseline BMI (fixed effects) as well as site (random effect). No relationship between baseline FFM and proportion of weight lost as FFM was found (P = 0·632).
Relationship between behavioural characteristics and changes in body weight and body composition
For all participants completing the LED (n 198), one unit higher hunger score at baseline (reported range: 0–14) was associated with a mean larger weight loss of 0·14 (95 % CI 0·02, 0·26) kg (R −0·46, P = 0·020). None of the other pretreatment behavioural characteristics seemed to be related to the changes in body weight or body composition during the LED (all P > 0·17) (Table 3).
Table 3. Pretreatment behavioural characteristics and changes in body weight and body composition†
(Mean values and 95 % confidence intervals)
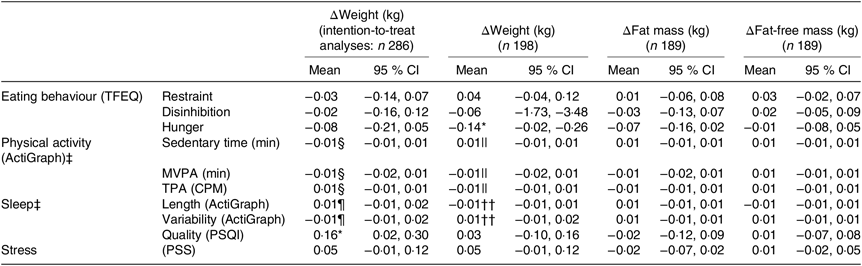
TFEQ, Three-Factor Eating Questionnaire; MVPA, moderate to vigorous physical activity; TPA, total physical activity; CPM, counts/min; PSQI, Pittsburgh Sleep Quality Index; PSS, Perceived Stress Scale.
* P < 0·05.
† Data are presented as unstandardised regression coefficients (β) and 95 % CI using linear mixed models including adjustment for age, sex and baseline BMI (fixed effects) as well as site (random effect).
‡ The accelerometer was worn for a mean of 7 (sd 1) d and 7 (sd 1) nights with a wear-time of 966 (sd 98) min/d between wake up and bedtime at baseline and 7 (sd 1) d and 7 (sd 1) nights with a wear-time of 958 (sd 87) min/d between wake up and bedtime post-LED.
§ Valid data from 235 participants.
|| Valid data from 172 participants.
¶ Valid data from 213 participants.
†† Valid data from 157 participants.
For all the participants who initiated the LED and with last observation carried forward for those not completing the LED (n 286), one unit lower sleep quality at baseline (reported range: 1–15) was associated with −0·16 (95 % CI −0·02, −0·30) kg less weight loss (R 0·36, P = 0·021) (Table 3). Among those dropping out (n 81), one unit lower sleep quality at baseline (reported range: 1–18) tended to be associated with −0·18 (95 % CI −0·37, 0·01) kg less weight loss (R 0·26, P = 0·067).
A one-unit reduction in scores of disinhibition (reported range: 1–15) and hunger during the LED were associated with a larger weight loss (0·24 (95 % CI 0·09, 0·39) kg, R 0·48, P = 0·002; 0·25 (95 % CI 0·13, 0·38) kg, R 0·49, P < 0·001) (Fig. 5). Grouping changes in the eating behaviour scores into quartiles further revealed that participants who had decreasing scores of disinhibition and hunger the most during the LED obtained 1·4 (95 % CI 0·3, 2·5) kg (R 0·50, P = 0·010) and 2·0 (95 % CI 1·0, 2·9) kg (R 0·52, P < 0·001) greater weight loss compared with those in the lowest 25th percentile. Additionally, a higher hunger score at baseline was associated with a 0·35 (95 % CI 0·23, 0·47) unit reduction in hunger score during the LED (R −0·40, P < 0·001). No changes in any of the other behavioural characteristics were related to the changes in body weight or body composition (all P > 0·10, data not shown).
Fig. 5. Relationship between changes in eating behaviour scores and changes in body weight. (a) Changed score of disinhibition (R 0·48, P = 0·002); (b) changed score of hunger (R 0·49, P < 0·001). A negative score equals less disinhibition/less hunger. Linear mixed models were fitted including adjustment for age, baseline BMI and sex (fixed effects) as well as site (random effect).
Discussion
A total of 70 % of the participants managed to lose a minimum of 8 % of initial body weight with only 17 % of the weight loss due to loss of FFM. For the participants completing the LED, the proportion of weight lost as FFM was not dependent on the protein intake relative to initial FFM. The individuals that lost the most body weight during LED were characterised by higher TFEQ hunger at baseline and greater reductions in TFEQ disinhibition and hunger during the LED. Additionally, lower sleep quality at baseline predicted less successful weight loss with LED using the ITT analysis, possibly driven by those dropping out.
The results on weight loss correspond with previous findings on the efficacy of LED( Reference Christensen, Meinert Larsen and Westerterp-Plantenga 18 – Reference Papadaki, Linardakis and Plada 20 ). Moreover, the weight loss resulted in clinically relevant improvements in the cardiometabolic risk factors. As an example, 60 % of the forty-two participants characterised as prediabetic at baseline became normoglycaemic after the LED( Reference Tabák, Herder and Rathmann 21 ). Our results confirm that similar degrees of weight loss and magnitudes of health improvements can be obtained with less energy restriction( Reference Christensen, Meinert Larsen and Westerterp-Plantenga 18 , Reference Papadaki, Linardakis and Plada 20 ). Additionally, Nielsen et al. ( Reference Nielsen, Nielsen and Schmidt 19 ) showed that energy restriction providing 4184 kJ/d for 7 weeks to obese individuals, corresponding to provision of 1·0 g protein/d per kg FFM at baseline, resulted in a 39 % share of weight lost as FFM. Papadaki et al. ( Reference Papadaki, Linardakis and Plada 20 ) showed that energy restriction providing 3347 kJ/d for 8 weeks in overweight/obese individuals, corresponding to provision of 0·9 g protein/d per kg FFM at baseline, resulted in a 25 % share of weight lost as FFM. In line with previous findings( Reference Chaston, Dixon and O’Brien 22 ), our results indicate that more FFM is retained with less energy restriction, possibly due to the concomitant higher supply of protein. Furthermore, energy and thereby protein provided in our study varied between men and women; thus, to some extent we accounted for sex differences in FFM when initiating the LED. Nevertheless, our results showed that the proportion of weight lost as FFM did not seem to be dependent on the amount of protein provided/d per kg FFM when initiating the LED. All participants in our study were provided with >1 g protein/d per kg FFM when initiating the LED. This suggests that when a minimum amount of protein is provided/d per kg FFM, there is no relationship between protein provided/d per kg FFM when initiating an LED and proportion of weight lost as FFM. This does not mean that protein intake during a weight loss period, and especially during an LED, is not important in order to maintain FFM. Rather our results indicate that a daily protein intake of about 84 and 70 g/d for men and women, respectively, is sufficient for a population with BMI ≥27·0 and ≤35·0 kg/m2. This is in agreement with the European Food Safety Authority (EFSA) expert opinion on the essential composition of LED during total diet replacement( 23 ). Previous studies using LED with energy restriction comparable with our study reported more substantial loss of FFM than we found( Reference Bérubé-Parent, Prud’homme and St-Pierre 24 – Reference Tchernof, Starling and Turner 26 ). However, the previous findings may, to some degree, be affected by the time of assessment of body composition. Following an LED, glycogen storages are depleted; thus, the body retains less intramuscular water as compared to when glycogen storages are filled( Reference Berg, Tymoczko and Stryer 27 ). Therefore, body composition after LED should be assessed after a period of stabilisation to a normal diet, and the proportion of FFM lost during an LED may not be as high as previously shown, at least not when >1 g protein/d per kg FFM when initiating the LED is provided. Since there is a relatively large variation in amount of FFM loss in different studies( Reference Chaston, Dixon and O’Brien 22 ), it remains interesting to investigate whether accounting for different protein needs can minimise FFM loss during an LED. As we already somewhat accounted for this in our study by providing different energy and thereby different amount of protein for men and women, it remains likely that accounting for individual protein needs within the LED can be beneficial in order to retain FFM, especially the less energy that is provided.
A higher score of hunger derived from the TFEQ at baseline was found to explain 21 % of the variation in weight loss and thereby predicted a larger weight loss. Based on this result, we hypothesise that for those individuals with a high level of hunger, hunger to a large degree controls their energy intake making them susceptible to overconsumption. We further hypothesise that hunger is somewhat ‘disconnected’ during an LED as the energy intake is controlled by a strict set of prescribed rules for adhering to the LED. Thereby, individuals with an eating behaviour driven by hunger can be expected to benefit the most from the disciplines of the LED and thereby achieve a larger weight loss. Overall, we hypothesise that dysregulated eating behaviour is forced to be regulated again because of the prescribed rules from the LED resulting in a larger weight loss. Different factors motivating an individual to eat may be considered important in the control of eating behaviour( Reference Rolls 28 ), and physiological regulators of appetite is found to be increased after a weight loss( Reference Doucet, Imbeault and St-Pierre 29 – Reference Sumithran, Prendergast and Delbridge 31 ). Thereby, the ability to change eating behaviour, that is, be less responsive to signals of appetite that motivate the individual to eat, seems likely to be important for the weight loss success. This is confirmed by our results showing that participants with high hunger level when initiating the LED unexpectedly reported a decreased hunger after the weight loss. This indicates that individuals whose eating is driven by their hunger may be able to control their hunger better during an LED, which thereby increases the weight loss success. Decreased perceptions of disinhibition and hunger (observed when analysing sex together) may be explained by ketosis from the energy restriction( Reference Gibson, Seimon and Lee 32 ). The TFEQ asks the participants about their recent attitudes towards foods. In this study, the TFEQ was assessed after stabilisation to a normal diet, but the changes observed in the eating behaviour indicate that the ketosis from the diet resulted in decreased perceptions of disinhibition and hunger. Restraint eating was found to be increased after the LED, probably a result from adhering to the strict rules during the diet. Thereby, we hypothesise that individuals whose eating is predominantly driven by factors other than hunger, for example, habits, social settings, liking of food, etc., may benefit from additional help during the LED in order to achieve a successful weight loss.
From the ITT analyses, lower sleep quality at baseline was found to explain 13 % of the variation in weight loss and thereby predicted failure with LED. This result was possibly driven by those dropping, indicating that lower sleep quality cause individuals to drop out rather than causing weight loss failure. However, lower baseline sleep quality was previously found to be related to preintervention BMI Z-score (R −0·49, P = 0·02) after 19 d of LED in obese adolescents( Reference Valrie, Bond and Lutes 33 ). The group by Verhoef have also shown that change in sleep duration during an 8-week very low-energy diet (providing 2100 kJ/d) was concomitantly negatively correlated with the change in BMI in a population similar to the one in our study( Reference Verhoef, Camps and Gonnissen 10 ). Based on this and as sleep patterns have also been reported to be linked to lack of interest, motivation and energy, it seems likely that lower sleep quality may result in failure with LED( Reference Anderson, Belar and Breckler 34 ). Thus, it may be relevant to consider the individual’s perceived sleep quality before recommending an LED, as the individual’s motivation to comply with an LED may be dependent hereof.
Changes in physical activity level, sleep patterns or level of stress do not seem to be associated with weight loss success. Our results on physical activity showed that women increase MVPA by 14 % and total physical activity by 9 %; however, no relationship was found between changes in physical activity and weight loss success. These results confirm similar findings in studies investigating the effect of physical activity during energy restriction, which found no additional weight loss when increasing physical activity during LED( Reference Saris 35 ). Moreover, in our study, women’s average level of stress also decreased by 17 %, but this was not found to be related to the weight loss success. Similar sex differences in stress response to energy restrictions have been found in rats, which responded equally to the energy restriction in weight development, confirming no relationship between level of stress and weight loss success( Reference Martin, Pearson and Kebejian 36 ).
Based on our results, relationships between eating as well as sleep behaviour and weight loss success remain likely. It seems especially interesting to investigate different characterisations of eating behaviour further. To our knowledge, these relationships have not been investigated previously and they remain interesting to investigate with different weight loss interventions.
Strengths and limitations
High completion rate strengthens the conclusion, which is based on results from the majority of the participants initiating the study. However, the results are limited by the fact that most of the participants not achieving the ≥8 % weight loss were unwilling to attend the post-LED measures. The results on relationship between protein intake relative to initial fat-free mass (FFM) and proportion of weight lost as FFM may have been biased since the analysis necessitated to only include those who succeeded to achieve the ≥8 % weight loss. Nevertheless, those achieving ≥8 % weight loss are expected to represent the part of the study population having the biggest loss of FFM. Thus, excluding those failing to achieve ≥8 % weight loss is not expected to have affected the outcome showing that the amount of protein provided per d during this LED was sufficient for relative preservation of FFM.
The TFEQ is a validated measure with each domain found to correlate well with eating behaviour. For further investigations, standardised appetite probe days assessing ad libitum energy intake along with subjective ratings of appetite and eating behaviour would be interesting measures to include in order to study eating behaviour pre and post LED.
Physical activity was assessed by both objective and subjective measures. Due to ethical constraints, one of the study sites was only able to include wearing of the Actigraph (objective measure of physical activity) and also collection of blood samples as optional. Thereby, only few participants from the English site contributed with these data resulting in less power and uneven representation of data from each site. Also, dropout rate varied a lot between sites, which may have been due to cultural differences, habits etc. creating different attitudes to an LED between the sites. However, site differences were to some degree accounted for by including site as random effect in all statistical analyses.
Conclusion
Protein intake in the range 1·0–1·6 g protein/d per kg FFM at baseline for men and 1·1–2·2 g protein/d per kg FFM at baseline for women was not associated with the degree of weight lost as FFM. Higher level of TFEQ hunger at baseline and reductions in TFEQ disinhibition and hunger during the LED were associated with larger weight loss. Lower sleep quality at baseline predicted less successful weight loss using ITT analysis, possibly driven by those dropping out. Further investigations of optimal protein content of LED as well as behavioural characteristics potential to modify the chance of success to obtain a weight loss with an LED are needed. Especially further investigations of different eating behaviour characteristics seem promising in order to identify expected weight loss success as well as the individuals in need for additional support during an LED.
Acknowledgements
The authors are grateful to Nutrition et Santé SAS, France, that made a range of Modifast® products available for the study free of charge. The authors also wish to thank: the volunteers participating in the study making a great effort to comply with the low energy diet and taking time to meet for the study visits; the many study personnel: laboratory technicians, dietitians, scientific assistants and interns, who were involved in the study at each of the three study sites doing a great job handling many study visits with many participants; Sanne Kellebjerg Korndal who was highly involved in the designing of the study; Lene Stevner who monitored each study site and helped to ensure standardised completion of the study; Jörn Jaskolowski for extensive data management support.
The study was part of the 7th Framework funded EU project ‘SATIN – Satiety Innovation’ (grant number 289800). Additionally, funding for one year PhD position was funded by the Department of Nutrition, Exercise and Sports, University of Copenhagen. Nutrition et Santé SAS, France, supported with a range of total meal replacement products (Modifast®) free of charge.
The authors’ contributions were as follows: T. T. H., M. F. H., C. R., M. B., J. S. S., J. A. H., J. C. G. H. and A. S. designed the research; T. T. H., K. S., S. V. A., M. B., M. L. C. B., J. F. G. G. and J. A. H. conducted the research; T. T. H. performed the statistical analyses supported by C. R. and M. F. H.; T. T. H. and A. S. wrote the manuscript and had primary responsibility for the final content; M. F. H., K. S., S. V. A., A. A. and C. R. provided valuable inputs for the manuscript; all authors read and approved the final manuscript.
Nutrition et Santé SAS, France, provided a range of total meal replacement products (Modifast®) free of charge but they had no influence on the design or interpretation of results of the study.
A. A. reports personal fees from Groupe Éthique et Santé, France; personal fees from Nestlé Research Center, Switzerland; personal fees from Weight Watchers, USA; personal fees and other from Gelesis, USA; personal fees from BioCare Copenhagen, Denmark; personal fees from Zaluvida, Switzerland; personal fees from Novo Nordisk, Denmark; personal fees from Saniona, Denmark; outside the submitted work. In addition, A. A. has a patent Methods of inducing weight loss, treating obesity and preventing weight gain pending to University of Copenhagen & Gelesis, USA; a patent Biomarkers for predicting degree of weight loss pending to University of Copenhagen & Nestec SA, CH; a patent Co-inventor of a number of other patents owned by University of Copenhagen in accordance with Danish law pending to University of Copenhagen; co-author of the book ‘Spis dig slank efter dit blodsukker’ (Eat according to your blood sugar and be slim)/Politikens Forlag, Denmark, 2017. A. A. is co-owner and member of the Board of the consultancy company Dentacom Aps, Denmark, 2005-; co-founder and co-owner of UCPH spin-outs Mobile Fitness A/S, 2005-, Flaxslim ApS (where also member of Board), 2015-, Personalised Weight Management Research Consortium ApS (Gluco-diet.dk), 2017-. J. S. S. reports serving on the board of and receiving grant support through his institution from International Nut and Dried Fruit Council; receiving consulting personal fees from Danone, Font Vella Lanjaron, Nuts for Life, and Eroski; and receiving grant support through his institution from Nut and Dried Fruit Foundation and Eroski. J. A. H. receives research funding from the American Beverage Association and Horizon 2020. J. C. G. H. receives research funding from the American Beverage Association, Astra Zeneca, Bristol Meyers Squib, BBSRC and Horizon 2020. J. C. G. H. is speaker, member of the advisory boards and task force member in International Life Science Institute, Novo Nordisk and Orexin and additionally receives all consultancy monies etc. paid to the University of Liverpool. For the remaining authors, there were no conflicts of interest to declare.


