


Plant-based, i.e. vegetarian (without meat and fish) or vegan (exclusively plant-based foods) diets are in trend(Reference Ferrara, Corsello and Quattrocchi1), also among children and adolescents(Reference Patelakis, Barbosa and Haftenberger2). Although the appropriateness of a plant-based diet during growth is still critically debated(Reference Barnard and Leroy3–Reference Leroy and Barnard5), there are only few studies on vegetarian and especially on vegan child nutrition(Reference Schürmann, Kersting and Alexy6). Results of older studies cannot be easily transferred to vegetarian and vegan children of the present time, since the food market has changed since then: Overall, the number of available plant food products has increased, in particular there is a broad variety of dairy and meat alternatives, some of which are fortified(Reference Verduci, D’Elios and Cerrato7,Reference De Marchi, Costa and Pozza8) . There are also numerous nutrient supplements aimed specifically at vegetarians and vegans. In addition, via internet, information about plant-based diets is more easily available to consumers(Reference Kleinman9,Reference Hopp, Keller and Lange10) . Therefore, the overall aim of the VeChi Youth Study was to describe a modern vegetarian and vegan diet of children and adolescents in Germany(Reference Alexy, Längler and Michalsen11,Reference Alexy, Fischer and Weder12) . Analysis of nutrient intakes and biomarker levels indicated no special risk for vegetarian or vegan diet: Intake of carbohydrates was higher in vegetarian and vegan participants. Protein intake exceeded the reference values in all groups. Haemoglobin, vitamin B2, 25-OH vitamin D3, HDL-cholesterol and triglycerides blood concentrations did not differ, but ferritin levels were higher in omnivores than in vegetarian and vegan participants. Vegetarians had lower holo-transcobalamin and higher methylmalonic acid concentrations than omnivores. A high prevalence of 25-OH vitamin D3 and vitamin B2 concentrations below the reference values were found in all groups(Reference Alexy, Fischer and Weder12).
However, in addition to individual nutrients, foods also have their own importance for health(Reference Mozaffarian13). Furthermore, the knowledge of food patterns is crucial for the development of population specific food-based dietary guidelines(14). To the best of our knowledge, there are no studies on food group intake of children and adolescents consuming modern plant-based diets. Hence, in the present analysis, the consumption of food groups by vegetarian and vegan children and adolescents aged 6–18 years is described and compared with the consumption of food groups by the omnivore control group.
Materials and methods
Study design
The VeChi Youth Study collected cross-sectionally data on anthropometry, dietary intake, lifestyle and nutritional status among vegetarian, vegan and omnivore children and adolescents (6–18 years of age). Details of recruitment and study examinations were described elsewhere(Reference Alexy, Längler and Michalsen11,Reference Alexy, Fischer and Weder12) . In short, participants were recruited mainly online, i.e. by the study homepage (www.vechi-youth-studie.de), social media groups on plant-based diets and vegetarian or vegan societies’ websites. Subjects were included if they fulfilled the following criteria: healthy vegetarian, vegan or omnivore children and adolescents (aged 6–18 years) living in Germany. Subjects with diagnosed diseases that could affect the studied variables (e.g. enteropathy, pancreatic diseases, metabolic disorders like phenylketonuria or fructose malabsorption), or on special diets other than vegan or vegetarian diet were excluded.
After signing the consent form, the participants were examined in one of three study centres between October 2017 and January 2019. Most participants came from the area around the study centres (around two-thirds from North-Rhine-Westfalia in the Western part of Germany, and one-third from Berlin and Brandenburg in the Eastern part of Germany).
When they were given an appointment, they got a link to an online questionnaire. In the weeks around the appointment, families were asked to provide a 3-d weighed food record.
In the planning of the study, a power calculation was carried out with the G-Power program for serum ferritin as the primary outcome. A survey of forty-two vegetarian and fifty-six omnivore children from Taiwan aged 2–6 years(Reference Yen, Yen and Huang15) showed a difference of serum ferritin of 12·1 ng/ml between the two groups. On this basis, a medium effect size of Cohen’s d = 0·6 was anticipated. This resulted in a case number of n 35 per group with a power of β = 0·8 and a one-sided level α = 0·05. A further post hoc power analysis based on group differences of vegetable intake (α = 0·05, η2 = 0·1585, sample size n 390, 3 groups, df = 2, covariates n 7) yielded a power of β = 0·84.
The VeChi Youth Study was conducted according to the guidelines of the Declaration of Helsinki and approved by the ethics committee of the University of Witten-Herdecke (139/2017). The study is registered at the German Clinical Trials Register (DRKS00012835). Primary results were published in the 2020 German Nutrition Report(Reference Alexy, Längler and Michalsen11).
Dietary assessment
All foods, beverages and leftovers were weighed and recorded over 3 d using electronic kitchen scales by the parents and/or the older participants themselves. At study entry, families got written information on dietary recording. The participating families choose the day of the beginning of dietary recording within a given period. If weighing was not possible (e.g. in case of eating out), participants were asked for semi-quantitative recording using household measures (e.g. spoons, cups). Packages of commercial food products should be collected, too, either as a photo or the packaging was sent by mail. After recording, missing data or uncertainties were clarified by the study staff requesting the information from the participants via e-mail.
Energy and nutrient intake from food groups was calculated using the food composition database LEBTAB(Reference Sichert-Hellert, Kersting and Chahda16). LEBTAB is continuously updated by adding those products or nutrient supplements recorded by study participants, e.g. ready-to-eat meals, desserts and snacks, including milk, meat or fish alternatives. Hereto, the energy and nutrient contents of commercial food products were estimated by recipe simulation using labelled ingredients and nutrient contents including fortified nutrients. Dietary supplements were recorded, too, but not considered for this analysis.
After quality check and data entry, each food item was assigned to one of eighteen food groups as described in Table 1. The amounts of consumed food groups were summed up for each day and individual mean of the 3 d of recording was calculated (food group intake in g/d).
Table 1. Food group description
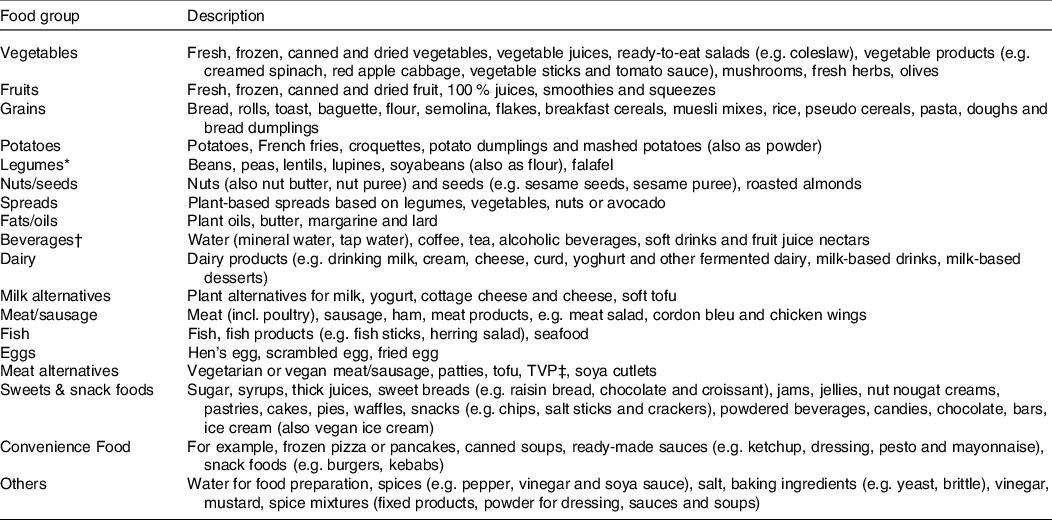
* Dry weights were converted to consumption weights.
† Commercial spritzers were divided into juice and water and assigned to the respective groups.
‡ Textured vegetable protein.
Moreover, the intake of whole grains and whole grain products was calculated according to the HEALTHGRAIN definition (≤ 30 % whole grain ingredients in the overall product and more whole grain than refined grain)(Reference Van der Kamp, Poutanen and Seal17).
Furthermore, the contribution of the above-mentioned food groups to the total daily intake of energy and nutrients as individual mean of 3 d of recording was calculated.
Underreporting
Underreporting was defined by the Goldberg approach(Reference Goldberg, Black and Jebb18). Hereto, the ratio of the reported total energy intake and the estimated basal metabolic rate (according to age- and sex-specific equations of Schofield) was calculated. A ratio below paediatric cut-offs(Reference Sichert-Hellert, Kersting and Schöch19) indicated underreporting.
Anthropometric measurements
Body weight (Seca 799, graduation 100 g, up to 150 kg body weight) and height (stadiometer Seca 222, graduation 1 mm) were measured in underwear, without shoes. The BMI of the subjects was calculated from body weight and height. The standard deviation score of BMI was calculated according to the LMS method using the German reference values(Reference Kromeyer-Hauschild, Wabitsch and Kunze20).
Questionnaires
Socio-demographic variables (e.g. income per months, parental education and profession) and further dietary variables (e.g. duration of participants’ dietary regimen, main motive for the dietary regimen (only vegetarian, vegan), parental dietary regime and sources of information about diet) were assessed using an online questionnaire. Physical activity was collected with the validated Adolescent Physical Activity Recall Questionnaire(Reference Booth, Okely and Chey21). Duration of physical activity (h/week) and MET-minutes per week were calculated from information provided about organised and unorganised activities and databases on the metabolic intensity of activities(Reference Ainsworth, Haskell and Herrmann22,Reference Butte, Watson and Ridley23) .
Diet group classification
The three diet groups (i.e. vegetarian, vegan or omnivore) were categorised according to the following question during recruitment:
Do you/does your child eat
-
A vegetarian diet (no meat, sausage, fish, but dairy products and/or eggs)
-
A vegan diet (no meat, sausage, fish, dairy products and eggs)
-
An omnivore diet (including meat and/or fish)?
In addition, in the online questionnaire, some crosscheck questions were asked, whether there are exceptions in food intake, e.g. vegan children drinking cow’s milk or vegetarian children occasionally eating fish or meat. Accordingly to these crosscheck questions, some participants were re-assigned: vegetarian and vegan children who usually eat meat or fish ≥ 1 time/week were reclassified as omnivore (n 6). Vegan children who usually eat dairy products and/or eggs ≥ 1 time/week were categorised as VG (n 18).
Statistical analysis
All statistical analyses were performed using SAS ® procedures (version 9.4). The significance level was set to P< 0·05. All data were checked for plausibility and outliers.
Socio-economic status (SES) was assessed using the Winkler Index, according to a recent German representative study among children(Reference Winkler and Stolzenberg24). This index combines three social status scores: education, profession and total net household income (1–7 points, each). The higher score of either the mother or the father was used as family SES index and categorised into low (3–8 points), middle (9–14 points) or high (15–21 points) social status.
Missing data among covariates (smoking in the household: n 17, SES n 18) were replaced by the median value of the respective subgroup.
Food group intakes were expressed as g/MJ to adjust for differences in energy requirements and hence food intake between boys and girls as well as children and adolescents of different ages. Contribution of food groups to total intake (%) was calculated for energy, protein, carbohydrates, fat, SFA, MUFA, PUFA, fibre, free sugar, vitamins B1, B2, B6, B12, Ca, Fe, Mg and Zn.
Sample characteristics in the tables are presented as means ± sd or median (Q1; Q3) for continuous variables. Categorical variables are presented as frequencies and percentages. Differences in categorical characteristics between diet groups were tested using a χ 2 test or Fisher’s exact test. For continuous characteristics, Kruskal–Wallis tests for non-parametric data were applied. Differences in total energy intake and energy density were assessed with ANCOVA, to adjust for age and sex.
Due to the mostly skewed distribution of the food intake data and many zero values for some food groups, different statistical tests were performed to assess diet group differences according to food group:
-
Grains, whole grains, vegetables, fruits, fat/oils, sweets & snack foods and beverages were reported in nearly each record. To evaluate group differences of food group intakes (g/MJ) between vegetarian, vegan and omnivore participants, the ANCOVA was run (PROC GLM in SAS). All models were adjusted for sex (boys/girls), age of participants (years), total energy intake (kcal/d), BMI-SDS, SES (high/middle/low), physical activity (MET-minutes) and smoking in the household (yes/no). Few zero consumption data were replaced by the lowest intake value. Furthermore, the intake data were log-transformed to improve distribution of residuals and homoscedasticity of variance. For dairy intake, ANCOVA was run to compare vegetarians and omnivores, only.
-
Due to the high number of zero values, differences between intake of potatoes, legumes, nuts, milk alternatives, meat alternatives, convenience food and other food were analysed using the non-parametric Kruskal–Wallis test. Pairwise comparisons were done using the Wilcoxon t test. As for the ANCOVA, food intake was calculated as g/MJ.
-
No statistical tests were done for meat, fish, eggs and spread.
P-values were adjusted for multiple testing using the False Discovery Rate method (Proc Multitest in SAS). Sensitivity analyses of dietary intake models were done excluding records categorised as underreported(Reference Sichert-Hellert, Kersting and Schöch19).
Results
Sample characteristics
In the VeChi Youth Study, 390 subjects (97 %) of the 401 study participants provided a dietary record (43 % boys), of whom 380 subjects (97 %) completed the online questionnaire.
Mean age of participants was 12·6 ± 3·9 years and age ranged from 5·5 years to 19·1 years. The mean age did not differ between the diet groups, as did body weight and height (P = 0·8741, Table 2). Mean BMI-SDS was below zero in all diet groups and differed significantly between diet groups (P = 0·0242, ANCOVA adjusted for age and sex, Table 2).
Table 2. Sample characteristics of the German VeChi Youth Study (n 390, 6–18 years old), stratified by participants consuming a vegetarian (n 145), vegan (n 110) and omniovre (n 135) diet
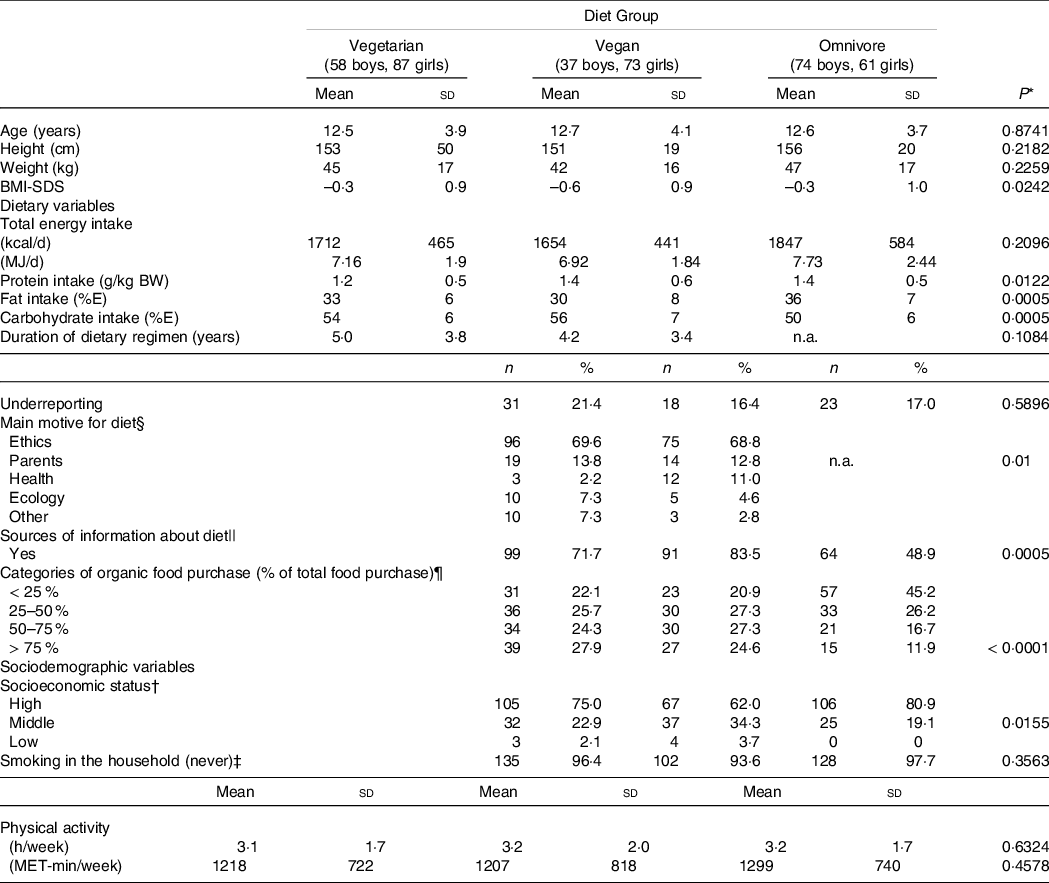
Values are n (%) or mean ± sd.
* Chi2-Test or Fisher’s exact test (categorical variables) or Kruskal Wallis test or t test (continuous variables) or ANCOVA adjusted for age and sex (SDS-BMI, TEI), P-values adjusted for multiple testing according to the False Discovery Rate method.
† High social class: Winkler index > 14, middle social class: Winkler index > 9 to 14, low social class (Winkler index ≤ 9), 11 missings (vegetarian: n 5, vegan: n 2; omnivore: n 4).
‡ Smoking in the household missings n 10 (vegetarian: n 5; vegan: n 1, omnivore: n 4).
§ Main motive: 8 missings (vegetarian: n 7, vegan: n 1).
|| Information: 12 missings (vegetarian: n 7, vegan: n 1, omnivore: n 4).
¶ Organic food purchase: 18 missings (vegetarian: n 8, vegan: n 1, omnivore: n 9).
The rate of underreporting did not differ between diet groups (Table 2), but significantly more records from older subjects were classified as underreported (6 to 9 years: 9·3 %, 10 to 14 years: 15·6 %, 15 to 18 years: 29·7 %, P < 0·0001, data not shown).
About three-quarters of the subjects (n 280; 73·1 %) came from families with a high SES.
Smoking in the household was uncommon (< 10 %), irrespective from diet group.
Total energy intake did not differ between diet groups (P = 0·2096) when adjusted for age and sex (Table 2).
The majority of vegetarian and vegan participants (70 %) stated that they had chosen their diet primarily for ethical/animal rights motives (Table 2). In second place (13 %), the diet of the parents was indicated as the main motive. Health or ecological reasons were mentioned less frequently (each 6 %). Those participants indicating the parental diet as main motive were significantly younger (8·2 ± 2·2 years) than those indicating other motives (13·2 ± 3·7 years, t test P< 0·0001, data not shown). There was a trend towards a higher age of participants indicating ethics as main motive (12·9 ± 3·7 years) and those indicating other motives (11·9 ± 4·4 years, t test P = 0·0532, data not shown).
About two-thirds of vegetarian and vegan participants or their parents, respectively, stated to inform themselves about their diet regimen compared with only half of the omnivore participants (P = 0·0005, Table 2). The sources of information mentioned most frequently were media (vegetarian: n 56 (41 %), vegan: n 61 (56 %), omnivore: n 44 (34 %)), internet (vegetarian: n 52 (38 %), vegan: n 56 (51 %), omnivore: n 32 (24 %)) and associations/professional societies (vegetarian: n 30 (39 %), vegan: n 20 (57 %), omnivore: n 26 (21 %)) (multiple responses possible, data not shown).
Level of self-reported physical activity did not differ significantly between groups (Table 2).
About one-quarter of vegetarian and vegan participants but only approximately 10 % of omnivore participants stated to purchase > 75 % of organic foods of their total food purchases. Nearly half of the omnivore participants and about 20 % of vegetarian and vegan participants indicated to buy <25 % organic food of total food (Table 2, P< 0·0001).
Around 90 % of mothers and fathers of the omnivore participants were omnivore, too, but only around 10 % of parents of vegan participants were omnivore. Mothers of vegetarian participants followed about one-third a vegetarian, vegan or omnivore diet, respectively, whereas two-thirds of fathers indicated to consume an omnivore diet (data not shown).
Food group intake
Table 3 presents food group intake (g/MJ) of VeChi Youth Study participants stratified by diet group. Absolute intakes (g/d) are presented in Supplementary Table S1. Vegetable intake was higher in vegan (29·2 g/MJ) than in vegetarian (20·4 g/MJ) and omnivore (20·4 g/MJ) participants (P< 0·02), whereas fruit intake (incl. juices) and beverages did not differ between groups. Grain intake did not differ between vegetarian and vegan (P = 0·695), but was significantly higher compared with omnivore participants (P< 0·007).
Table 3. Food group intake (g/MJ) of children and adolescents of the German VeChi Youth Study (n 390, 6–18 years old) stratified by diet group
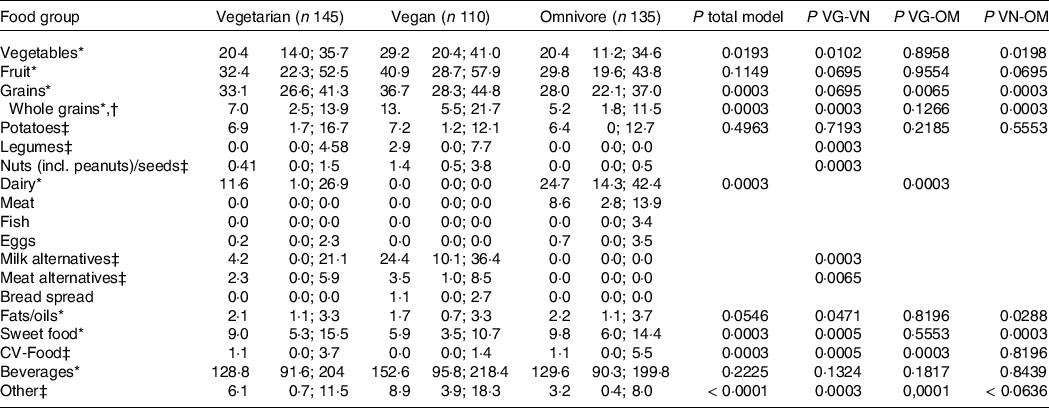
t test for comparison of two groups (to compare diet groups pairwise or when consumption was near zero in the third group).
* ANCOVA of log-transformed intakes adjusted for sex, age, TEI, BMI-SDS, smoking in the household, physical activity (MET-minutes) and socio-economic status.
† Defined according to HEALTHGRAIN forum(Reference Yen, Yen and Huang15), subgroup of total grains.
‡ Kruskal Wallis for comparison of three groups when data distribution did not allow analysis of covariance.
Pairwise comparison of vegetarian and vegan groups indicated significantly higher intakes of legumes, nuts, milk alternatives (all P = 0·0003) and meat alternatives (P = 0·0065) among vegan subjects. Intake of these food groups of omnivore participants was low (Q3:0·0 g/MJ for legumes, milk alternatives and meat alternatives, 0·5 g/MJ for nuts). Dairy intake of vegetarian (11·6 g/MJ) was significantly lower than of omnivore subjects (24·7 g/MJ) (P = 0·0003). Intake of fats/oils and sweet foods was lowest in vegan compared with vegetarian and omnivore participants (P< 0·05). Whole grain intake was higher in vegan participants (14·5 g/MJ) than of vegetarian (9·1 g/MJ) and omnivore (6·5 g/MJ) participants (P = 0·0003).
Sensitivity analysis excluding 72 dietary records classified as underreported largely confirmed the results (online Supplementary Table S2).
Contribution of food groups to energy and nutrient intake
The three food groups with the highest impact on the intake of energy and the potential critical nutrients protein, Ca, Fe, vitamin B2 and vitamin B12, respectively, are presented in Fig. 1.
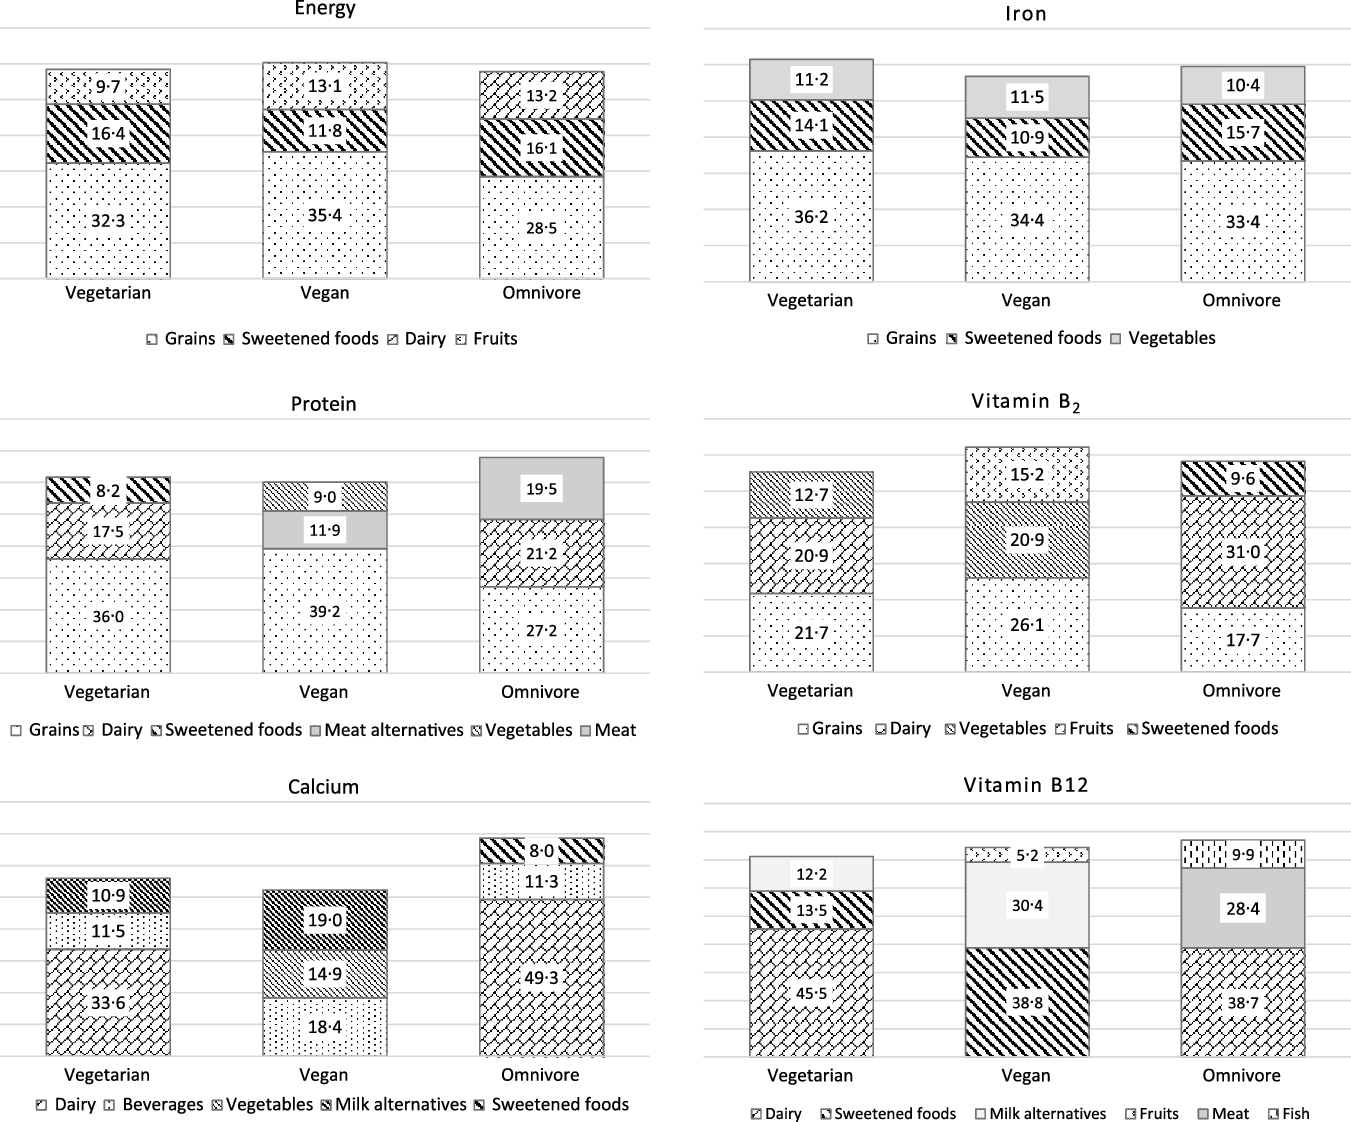
Fig. 1. Percentage of total energy and nutrient intake from those food groups with the highest impact on total intake for vegetarian, vegan and omnivore participants of the VeChi Youth Study (n 390, 6–18 years old).
Independent from diet, grains were the main contributor to energy intake (vegetarian: 32 %, vegan: 35 %, omnivore: 29 %) followed by sweet foods (16 %, 12 %, 16 %, respectively). Also for protein, grains were the main contributor in all diet groups (36 %, 39 % and 27 %, respectively). Dairy products were in the second place among vegetarian and omnivore participants. In vegan participants, meat alternatives and vegetables yielded considerable amounts of protein (11·9 % and 9·0 %, respectively). That was almost as much as the contribution of milk alternatives to the protein intake (8·9 %, data not shown). This is due to the low protein intake and high vegetable consumption at the same time of several participants (data not shown). In omnivore participants, meat yielded around 20 % of protein intake.
In vegetarian and omnivore participants, dairy products were the predominant contributor to the Ca intake (around one-third for vegetarian and about 50 % for omnivore participants), followed by beverages (around 11 %). Milk alternatives yielded 10 % of Ca intake among vegetarian and 20 % among vegan children.
Independent from diet group, grains provided around one-third of dietary Fe, followed by sweets and vegetables.
Grains were also a main contributor of vitamin B2 intake (18–26 %). Dairy yielded about 30 % of vitamin B2 intake among omnivore and 20 % among vegetarian participants. Among vegan participants, vegetables (21 %) and fruits (15 %) contributed largely to the vitamin B2 intake.
Among omnivore participants, animal foods (dairy: 39 %, meat: 28 %, fish: 10 %) were the predominant contributor of vitamin B12 intake.
Among vegetarian participants, vitamin B12 was supplied by dairy (45 %), sweets (14 %) and milk alternatives (12 %). Main food sources of vitamin B12 among vegan participants were sweets (39 %) and milk alternatives (30 %). This is in accordance with the foods recorded in the VeChi Youth Study, which were fortified with vitamin B12 (n 19 milk alternative, n 12 sweet food (candies/jellies/beverage powder), n 13 juices, n 10 breakfast cereals, n 2 meat alternatives and n 1 margarine) (data not shown).
Discussion
Key results
In the cross-sectional VeChi Youth Study, consumption of food groups (adjusted for total energy intake) differed significantly between vegetarian, vegan and omnivore children and adolescents. There were particularly large differences between the vegan and the vegetarian and omnivore participants: vegan children and adolescents consumed highest amounts of vegetables and whole grains, but lowest amounts of fats/oils and sweet foods. Pairwise comparison indicated also a higher intake of legumes, nuts, meat alternatives and milk alternatives among vegan compared with vegetarian participants. Omnivore subjects did virtually not consume the two latter food groups. Instead, meat consumption was high, at least in one quarter of the omnivore group: The third quartile of meat nearly reached (6–11 years old) or exceeded (12–18 years old) the maximum range of meat intake for adults (300–600 g/week, i.e. 43–86 g/d) as recommended by the German Nutrition Society(Reference Oberritter, Schäbethal and von Ruesten25).
For fruits, potatoes and beverages, there were no significant differences between diet groups.
Comparison with other studies on vegetarian and vegan nutrition
Overall, these results are in line with studies among vegetarian and vegan adults. For instance, in the Adventist Health Study 2, dietary intake of more than 89 000 adults was measured using a FFQ. Those participants who were characterised as vegan, consumed the highest amounts of daily energy from legumes, soya foods and meat alternatives, nuts and seeds, grains, potatoes and fruits and vegetables(Reference Orlich, Jaceldo-Siegl and Sabaté26). Furthermore, in a Finish study, vegan adults (n 22, 18–50 years) consumed significantly more legumes, soya/tofu and margarine, but less butter than the non-vegan control group (n 19). Though, there was no significant difference between the nuts/pulses group(Reference Elorinne, Alfthan and Erlund27). Food intake patterns also differed between vegan and omnivore adolescents (both n 30, 16–20 years old) from Sweden(Reference Larsson and Johansson28). Thus, both vegan boys and girls had significant higher intakes of vegetables than their omnivore counterparts did, and the intake of chocolate and candy was significantly lower. However, as in our study, fruit and berry consumption was comparable in both groups(Reference Larsson and Johansson28). Even if the assignment of foods to food groups was not completely the same, there was a great deal of agreement with the results of the VeChi Youth Study. Of the few other published studies on vegan diets in childhood(Reference O’Connell, Dibley and Sierra29–Reference Hovinen, Korkalo and Freese32), none has presented food consumption.
Grains
Grains, i.e. bread, pasta, rice and other cereals, were the food group with the highest median consumption per MJ among vegetarian and vegan, apart from beverages. In the EAT-Lancet commission food intake recommendations for a healthy and sustainable diet for the age of 2 years onwards, 44 g/MJ grains (rice, wheat, corn and others) is included(Reference Knuppel, Papier and Key33,Reference Willett, Rockström and Loken34) . In particular, omnivore participants did not reach this recommendation.
Grains were also the most important source of energy in all diet groups. As in a representative German study, sweets & snack foods were the second main contributor of energy in the overall sample(Reference Mensink, Haftenberger and Barbosa35), reflecting the well-known high intake of free sugar in this age group(Reference Wang, Guglielmo and Welsh36–Reference Azaïs-Braesco, Sluik and Maillot38). Grains were also the most important source of protein, regardless of the diet group. In the vegan group, meat alternatives, vegetables, milk alternatives, nuts and seeds also had a relevant impact on protein intake. The combination of different plant protein sources is recommended to enhance the lower protein quality of plant foods and to meet the requirements of indispensable amino acids in vegetarian and vegan diets(Reference Mariotti and Gardner39,Reference Messina and Mangels40) .
Grains also provided the highest proportion of Fe intake, even in omnivore subjects. However, Fe from plant sources has a lower bioavailability than Fe from meat(Reference Gibson, Heath and Szymlek-Gay41). Hence, the high contribution of grain to Fe intake might be of less significance for Fe status in omnivore participants. However, as shown previously, the Hb concentrations in the VeChi Youth Study were comparable among all diet groups(Reference Alexy, Fischer and Weder12), indicating a sufficient dietary Fe intake and bioavailability in vegetarian and vegan participants.
From a preventive medicine perspective(Reference Bechthold, Boeing and Schwedhelm42–Reference Schwingshackl, Hoffmann and Kalle-Uhlmann45), the significantly higher consumption of whole grain products in vegan, as well as the high consumption of vegetables, legumes and nuts was favourable. The EAT-Lancet commission recommended an intake of 29 g/MJ vegetables (range: 19–57 g/MJ) and 19 g/MJ fruits (range 10–29 g/MJ)(Reference Willett, Rockström and Loken34). For fruits, this recommendation was reached or even exceeded by all groups, at least a quarter of vegetarian or omnivore participants was below the lower boundary (vegetarian diet: Q1 = 14 g/MJ; omnivore diet: 11 g/MJ).
Dairy and dairy alternatives
The EAT-Lancet commission recommended 24 g dairy/MJ, but accepted a broad range from zero to 48 g/MJ(Reference Willett, Rockström and Loken34). This is about the range of dairy consumption of the omnivore group.
Although a vegetarian diet usually includes dairy products, the significantly lower intake in this group compared with omnivore participants was in accordance with studies with adults(Reference Orlich, Jaceldo-Siegl and Sabaté26). In our sample, the 25th percentile was 1 g/MJ dairy among vegetarian children and adolescents, compared with 14 g/MJ in the omnivore control group. This reduction of dairy intake was partially replaced by milk alternatives in the vegetarian group. These foods are often criticised because the nutrient profile of plant-based drinks clearly differs from cow’s milk and nutrient bioavailability from these products is unclear(Reference Verduci, D’Elios and Cerrato7,Reference Singhal, Baker and Baker46,Reference Lott, Callahan and Welker Duffy47) . In addition, the nutrient composition varies between products depending on the base ingredient, e.g. soya, grains (e.g. oat, rice and spelt) or nuts (e.g. almond, hazel and coconut)(Reference Verduci, D’Elios and Cerrato7,Reference Singhal, Baker and Baker46,Reference Lott, Callahan and Welker Duffy47) . In general, protein content of plant-based milk alternatives is usually lower than that of cow’s milk. The only exceptions are soya-based milk alternatives. Moreover, soya protein also has a high protein quality(Reference Messina, Rogero and Fisberg48,Reference Scholz-Ahrens, Ahrens and Barth49) . However, there are concerns about the use of soya products in children’s diets with regard to the isoflavone content. While in adults isoflavones might contribute to the preventive effects of soya foods towards cancer, CVD and osteoporosis(Reference Verduci, D’Elios and Cerrato7), for children an influence on sexual maturation is discussed as these phytoestrogens may interact with hormone metabolism(Reference Messina, Rogero and Fisberg48). Only few non-Asian epidemiological studies with children on this issue have been published. In a cross-sectional USA study, boys with high intakes of isoflavones had an earlier onset of 5–6 months in retrospectively self-reported signs of pubarche than those with low intakes, but this was still within the normal age range(Reference Segovia-Siapco, Pribis and Oda50). In a comparable study with girls, there was no association of intake of soya foods and the age-at-onset of menarche(Reference Segovia-Siapco, Pribis and Messina51). In the prospective German DONALD Study, those girls with higher pre-pubertal urinary excretion of isoflavones experienced later breast development and reached peak high velocity later than girls with lower excretion. No association of isoflavone excretion and pubertal markers was found for boys(Reference Cheng, Remer and Prinz-Langenohl52). In Columbia, a supplementation of diet with soya protein over 12 months did not affect sexual maturation in pre-pubertal children aged 7–9 years(Reference Duitama, Zurita and Cordoba53). Overall, these results on the potential association of isoflavones and sexual maturation in non-Asian populations are mixed and do not suggest that soya consumption during childhood should generally be discouraged. In the narrative review on soya consumption among children and adolescents, Messina et al. recommended for pre-schoolers and school-aged children 5–10 g/d of soya protein which equates to approximately 1 serving of a traditional soya food as reasonable(Reference Messina, Rogero and Fisberg48).
All plant-based milk alternatives have much lower Ca contents in comparison with cow’s milk in common, except for fortified products. That is one reason why Ca intake was generally below the reference values in the VeChi Youth Study, but lowest in the vegan group(Reference Alexy, Fischer and Weder12). To enhance Ca intake, one option would be the fortification of milk alternatives with this mineral. Furthermore, the bioavailability of different forms of fortified Ca is under discussion(Reference Scholz-Ahrens, Ahrens and Barth49). However, at least the bioavailability of Ca from calcium carbonate-fortified soya milk alternatives is equivalent to Ca from cow’s milk(Reference Zhao, Martin and Weaver54). Other plant-based sources of Ca are Ca-rich mineral water (≥ 400 mg/l), green vegetables with low oxalate contents (e.g. kale, bok choi and broccoli), tree nuts, dried figs or chickpeas. To increase Ca intake, the consumption of these foods should also be encouraged among omnivore children.
Among omnivore participants, cow’s milk provided nearly 40 % of vitamin B12. Although not all products were fortified, dairy alternatives provided 12 % of the vitamin B12 from foods in vegetarian and 30 % in vegan (not considering dietary supplements). Because biomarkers in vegetarian subjects tended to show poorer supply of this vitamin in the VeChi Youth Study(Reference Alexy, Fischer and Weder12) and other studies(Reference Pawlak, Lester and Babatunde55), considerations should be given to mandatory fortification of dairy and meat alternatives with this vitamin. Until then, supplementation should be recommended to all children and adolescents on a vegan or vegetarian diet.
Other nutrients whose content is low in milk alternatives in direct comparison with cow’s milk are vitamin B2 and iodine(Reference Ma, He and Braverman56). However, the focus on single foods may be misleading, as in a mixed diet, combinations of foods are consumed. For example, plant sources of vitamin B2 are fortified plant-based dairy alternatives, textured vegetable protein (TVP), mushrooms, legumes or nuts. Nevertheless, the vitamin B2 intake of the vegan participants in the VeChi Youth Study was the lowest while there were no differences in the vitamin B2 status between the study groups(Reference Alexy, Fischer and Weder12).
Meat and meat alternatives
As with dairy alternatives, consumption of meat alternatives was higher among vegan than of vegetarian or omnivore participants. However, the median consumption of meat alternatives was lower than the meat consumption of the omnivores in both groups. Obviously, meat and fish intake was only in part replaced by meat alternatives. Compared with the EAT-Lancet recommendations, meat intake in the omnivore group was high. The reference intake of meat (i.e. the sum of beef, lamb, pork and chicken) is 4 (0–8) g/MJ(Reference Willett, Rockström and Loken34). As the median meat intake in the omnivore group was 8·6 g/MJ, more than half of this diet group exceeded the EAT-Lancet recommendation.
Sweets & snack foods
Consumption of sweets & snack foods was particularly high in vegetarian and omnivore participants of the VeChi Youth Study. Regardless of diet group, these foods were among the top three contributors of energy intake. Vegan children and adolescents had the lowest consumption. In fact, only free sugar intake of the vegan group was below the 10 E% limit of the WHO(57,Reference Alexy, Fischer and Weder58) . Potential reasons can be the lower offer of vegan confectionery on the market, educational aspects in the families or the higher price. If this low consumption will remain constant if more plant-based confectionery is available in every store around the corner, remains to be seen in the future.
Other food groups
In discussing the appropriateness of vegan diets in childhood, there is a recurring concern that nutrient deficiencies may occur if children do not accept nutrient-rich food groups such as nuts, legumes or whole grains(Reference Kersting, Kalhoff and Melter59) which are mandatory to reach a balanced nutrient intake. Regarding food consumption in representative paediatric omnivore study samples, this prejudice seems plausible at first glance: In the recent representative German EsKiMo study including 2644 children aged 6 to 17 years, mean consumption of nuts was ≤ 3 g/d (median = 0) and of legumes ≤ 8 g/d. Intake of whole grains was not presented. Vegetable and fruit intakes where low, but meat intake clearly exceeded the recommendations of German food-based dietary guidelines(Reference Mensink, Haftenberger and Barbosa35,Reference Brettschneider, Lage Barbosa and Haftenberger60) . However, our data showed a clear shift towards a more diverse and healthful plant food pattern, including nuts, legumes and whole grains, when eating a vegan diet.
Motives, parental diets and organic food consumption
Some other results of the VeChi Youth Study are worth to be discussed. The high proportion of children and adolescents who opted for a plant-based diet mainly for ethical reasons is consistent with the data from studies with adults(Reference Hopp, Keller and Lange10,Reference Cruwys, Norwood and Chachay61) . Health, on the other hand, played only a minor role as a main motivation in this sample. Furthermore, in a sociological online survey with adults in Germany, health as a motive was only listed in third place after ethical (i.e. reports on factory farming) and ecological (i.e. climate protection) reasons(Reference Kerschke-Risch62). Younger children in the VeChi Youth Study in particular practiced a vegetarian or vegan diet because their parents ate this way. However, even among omnivore subjects, there was a high degree of agreement with the parents’ dietary pattern. Since eating culture is passed on within families, this result is not surprising. However, about 30 % and 20 % of the mothers of vegetarian and vegan subjects, respectively, and about twice as many fathers consumed an omnivore diet. Hence, some of the children and adolescents decided independently on their diet, in particular those who tended to be older.
The form of diet was also associated with the proportion of organic food purchased in the VeChi Youth Study sample. Vegetarian and vegan families were more than twice as likely to report purchasing a high proportion of organic foods. Also in the Danish National Birth Cohort, the frequent use of organic food was associated with vegetarianism(Reference Petersen, Rasmussen and Strøm63). Furthermore, in the NutriNet-Santé cohort study, a cluster analysis revealed a group with high percentage of organic food consumer, 14 % of which were either vegetarian or vegan. This group was also characterised by a high nutritional quality(Reference Baudry, Touvier and Allès64). Further evaluations of the VeChi Youth Study data will show whether there is also an association between diet quality, nutritional status or blood lipids and the level of organic food purchase.
Limitations
Some strength and limitations have to be mentioned. The major strength of our study is the large sample and the balance of the study groups with no significant differences in age and socio-demographic characteristics, as well as the detailed dietary assessment. However, to avoid unduly increasing the burden on the subjects, only 3-d records were requested, although records over a longer period would have been desirable. The major limitations of the Vechi Youth Study are the cross-sectional design and the lack of representativity. The latter is indicated by the high SES of our sample, whereas in a representative German study, each 20 % were assigned to a low or high SES, the prevalence of a high SES was higher and of a low SES was lower in our sample(Reference Lampert, Hoebel and Kuntz65). However, in spite of the increasing trend towards plant-based diets, the prevalence of vegans in Germany is too low to conduct a representative study with reasonable effort. It is also worth to mention that other studies on vegetarian and vegan diets in paediatric populations published in recent years were not based on representative samples either(Reference Hovinen, Korkalo and Freese32,Reference Desmond, Sobiecki and Jaworski66–Reference Weder, Hoffmann and Becker69) . Furthermore, the large epidemiological studies with adults have specifically recruited vegetarians and vegans (EPIC-Oxford study)(Reference Appleby, Thorogood and Mann70) or were conducted within a religious community with a high proportion of vegetarians and vegans (Adventist Health Study II)(Reference Orlich, Jaceldo-Siegl and Sabaté26). In addition, the socio-demographic characteristics of our sample correspond to the known characteristics of adult vegetarians/vegans (high SES or educational level, disproportionately often from large cities)(Reference Patelakis, Barbosa and Haftenberger2,71) . The observed high SES in the control group is assumed to be due to selection bias, i.e. a higher willingness to participate in a study among families with a high SES. However, if the omnivore control group had a lower mean SES than the vegetarian or vegan group, interpretation of the data would be more difficult because differences in food consumption could be attributed to SES as well as diet group. Furthermore, as there is a social gradient of dietary habits with higher nutritional quality among families with a higher socio-economic background(Reference Brettschneider, Lage Barbosa and Haftenberger60), the group differences could be expected to be higher in a representative sample. Nevertheless, the lack of representativity has to be kept in mind when interpreting the results and restricts the generalisability of the results.
Conclusion
Our study is the first one describing food group intake in children and adolescents following a modern vegetarian or vegan diet in comparison with an omnivore control group. Our results showed clear differences between groups in particular between vegan participants and vegetarian and omnivore participants. In general, vegan children and adolescents showed healthier food intake pattern, with highest intakes of whole grains and vegetables, legumes and nuts and the lowest intakes of sweets & snack foods. Omnivore children and adolescents should be encouraged to increase their consumption of legumes and nuts. The lower consumption of dairy products among vegetarian compared with omnivore participants underlines the need of supplementation of vitamin B12 even in the vegetarian group. A higher intake of foods rich in Ca, including Ca-fortified milk alternatives, is recommended for all diet groups. Longitudinal studies are necessary to evaluate the long-term health consequences of vegetarian, vegan and omnivore food pattern, especially in childhood and adolescence.
Acknowledgements
Neither the Ministry nor the Nutrition Society had any role in the analysis or writing of this article. We would especially like to thank the participants and their parents of the Vechi Youth Study and the staff at the study centres in Berlin and Herdecke for their support.
This study was commissioned as contribution to the 14th DGE-Nutrition Report 2020, published by the German Nutrition Society (DGE e.V.) and financed by the German Federal Ministry of Food and Agriculture (BMEL).
The authors’ contributions are as follows: U. A., M. K. and S. W. formulated the research questions and designed the study, M. F., A. L. and S. W. organised the study and carried out the measurements. U. A. analysed the data and drafted the manuscript. All authors contributed to the discussion and had input into the writing of the manuscript.
S. W., A. L., A. M. and M. F. declare no conflict of interest. M. K. is an unsalaried member of the Scientific Advisory Board of ProVeg Germany. U. A. and M. K. headed the VeChi Diet Study, which was funded by the Erna-Graff-Stiftung für Tierschutz.
Supplementary material
For supplementary material/s referred to in this article, please visit https://doi.org/10.1017/S0007114521003603


