


Adolescence is a crucial period for the adoption of eating habits( Reference Spear 1 , Reference Diethelm, Jankovic and Moreno 2 ). Dietary patterns that develop during adolescence track into adulthood and have implications for the development of chronic diseases later in life( Reference Phillips, Bandini and Naumova 3 , Reference Lien, Lytle and Klepp 4 ). Adolescents have increased energy and nutrient requirements to account for growth and physiological, psychosocial and cognitive development( Reference Spear 1 , Reference Diethelm, Jankovic and Moreno 2 ). The overconsumption of energy-dense and nutrient-poor snack foods, such as candy or chocolate bars, between meals( Reference Sebastian, Cleveland and Goldman 5 – Reference De Vet, Stok and De Wit 7 ) and the associated excess energy, sugar and fat intakes among adolescents( Reference Phillips, Bandini and Naumova 3 , Reference Sebastian, Cleveland and Goldman 5 , Reference Rodriguez and Moreno 8 ), however, are of great concern. On the other hand, healthy snacking could help meet the recommendations for essential food groups such as fruit and dairy( Reference Sebastian, Cleveland and Goldman 5 – Reference De Vet, Stok and De Wit 7 ). The promotion of healthier snacking behaviour in adolescents is thus warranted.
Most theory-based interventions to improve the dietary behaviours of adolescents have focused on changing psychosocial determinants( Reference De Bourdeaudhuij, Van Cauwenberghe and Spittaels 9 , Reference Stice, Shaw and Marti 10 ). Eating behaviour, however, is the result of the joint function between explicit (reflective/psychosocial) cognitive efforts to build beliefs and implicit (habitual/automatic) processes, linkages of certain stimuli or cues to certain behaviour based on earlier learned associations( Reference Kremers, de Bruijn and Visscher 11 – Reference Hagger 13 ). Key determinants of the reflective system are, for instance, attitude and self-efficacy; for the implicit system, on the other hand, these are habits( Reference Rothman, Sheeran and Wood 14 ). The implicit or habitual nature of eating( Reference Rothman, Sheeran and Wood 14 – Reference Reinaerts, de Nooijer and Candel 16 ), and more specifically of snacking in adolescents( Reference De Vet, Stok and De Wit 7 ), was only recently recognized. Effective strategies to influence the explicit processes can be derived from the meta-analysis by Michie et al.( Reference Michie, Abraham and Whittington 17 ): interventions combining self-monitoring with at least one other technique derived from the control theory of Carver and Scheier( Reference Carver and Scheier 18 ) (such as goal setting or providing feedback) were the most effective to improve eating or physical activity behaviours. As habitual snacking might be driven by the higher reinforcing value of energy-dense snacks compared with healthy snacks such as fruits and vegetables( Reference Appelhans, Woolf and Pagoto 19 – Reference Ames, Kisbu-Sakarya and Reynolds 25 ), positive reinforcement might be a good strategy to implicitly increase healthy snack intake. Offering rewards has already been shown to increase the reinforcing value and the consumption of healthy foods in children and adolescents( Reference Vandeweghe, Verbeken and Moens 26 – Reference Cooke, Chambers and Anez 29 ).
Personal characteristics have shown to determine how individuals react to different behaviour change strategies in children and adolescents( Reference De Vet, Stok and De Wit 7 , Reference Vandeweghe, Verbeken and Moens 26 , Reference Nederkoorn, Braet and Van Eijs 30 , Reference Blissett, Bennett and Fogel 31 ). Personality theories assume that unique individual characteristics play a role in the expression of eating behaviour( Reference Davis, Patte and Levitan 32 , Reference Dietrich, Federbusch and Grellmann 33 ). Sensitivity to reward (SR) is a psychobiological trait, which can be defined as the tendency to engage in motivated approach behaviour in the presence of rewarding stimuli( Reference Davis, Patte and Levitan 32 , Reference Gray 34 , Reference Verbeken, Braet and Lammertyn 35 ). Individual differences in SR were associated with adolescents’ snack intake( Reference De Cock, Van Lippevelde and Vervoort 36 ). Rewarding strategies were already found to work better in high SR v. low SR toddlers in improving willingness to taste( Reference Vandeweghe, Verbeken and Moens 26 ). Following the definition of SR, it would thus be expected that rewarding strategies might work better in high SR adolescents in promoting healthy snack intake. However, the relationship between SR and adolescents’ snack intake was found to be moderated by sex( Reference Vandeweghe, Verbeken and Moens 26 , Reference De Cock, Van Lippevelde and Vervoort 36 ). In addition, differences in SR between boys and girls exist( Reference Vandeweghe, Verbeken and Moens 26 , Reference Dietrich, Federbusch and Grellmann 33 , Reference Verbeken, Braet and Lammertyn 35 ). When evaluating the effect of rewarding strategies in improving adolescents’ snack intakes, moderation by sex and SR should therefore be considered.
Eighty-six per cent of the adolescents in Flanders own a mobile phone and have on average ten to twenty mobile applications (apps) installed on the device( 37 ); thus, an app might be an interesting delivery platform for health interventions in adolescents. Furthermore, apps provide engaging and affordable ways to promote healthy lifestyle behaviours in adolescents( Reference Schoffman, Turner-McGrievy and Jones 38 – Reference Burrows, Khambalia and Perry 40 ). Recent mobile health (mHealth) interventions to change adults’, adolescents’ or children’s health behaviours have already produced some promising findings, however with modest effect sizes( Reference Schoffman, Turner-McGrievy and Jones 38 , Reference Dute, Bemelmans and Breda 41 , Reference Schoeppe, Alley and Van Lippevelde 42 ). In addition, few studies report on the feasibility, the acceptability of the intervention and/or provide user statistics for the app( Reference Schoeppe, Alley and Van Lippevelde 42 , Reference Moore, Audrey and Barker 44 ). Process evaluation is important in understanding intervention effectiveness, especially in programmes of increasing complexity such as mHealth interventions( Reference Moore, Audrey and Barker 44 , Reference Saunders, Evans and Joshi 45 ). When programmes get more complex, many factors can contribute to unexpected null findings or explain found positive/negative effects( Reference Moore, Audrey and Barker 44 , Reference Saunders, Evans and Joshi 45 ). Process evaluation can give insights into which possible underlying factors might explain why a programme succeeds or fails in effecting change( Reference Moore, Audrey and Barker 44 , Reference Saunders, Evans and Joshi 45 ).
The present study evaluated both the feasibility (process evaluation) and impact of the ‘Snack Track School’ app intervention in adolescents. Positive effects were expected on adolescents’ healthy snack intakes and targeted determinants. The intervention encompassed both rewarding strategies to influence the implicit/automatic processes and reflective methods derived from the control theory to target the explicit pathways. In addition, moderation of the intervention effects by SR and sex was assessed.
Methods
The present research forms the concluding study of the REWARD project’s adolescent work package( 46 ). REWARD (2013–2016) was a multidisciplinary project that aimed to research and improve the nutritional status of children and adolescents by focusing on SR, rewarding paradigms and learning theory.
Overview and design
The study design entailed a four-week pre–post controlled clustered trial conducted from January until April 2016 in six secondary schools (three intervention schools, three control schools) in two (matched) cities with comparable socio‐economic characteristics, population density and size in Flanders, Belgium. A controlled cluster trial was chosen over a (cluster) randomized controlled trial because of practical and budgetary considerations. In addition, the REWARD intervention included a participatory app development approach, which required long-term engagement and support of the local government, school principals and teachers. The teachers and principals were involved in the app development for two years and wanted then to host the intervention in their schools. To minimize differences between adolescents in the intervention and the control group, however, control schools were selected from a city with comparable socio‐economic characteristics, population density and size.
The adolescents in the intervention schools received a four-week mobile app intervention, called ‘Snack Track School’. The control schools continued their usual school curriculum and practices. The full study period consisted of a pre-test, the four-week intervention and a post-test immediately after the intervention. Approval for the trial was provided by the Ethics Committee of the University Hospital of Ghent University and the University of Leuven. Consent was obtained from the school authorities (school board and headmasters) and the parents (passive informed consents). The trial was registered at clinicaltrials.gov (number NCT02622165). A full description of the protocol of the intervention study can be found elsewhere( Reference Van Lippevelde, Vangeel and De Cock 47 ). Findings are reported following the CONSORT (Consolidated Standards of Reporting Trials) and TREND (Transparent Reporting of Evaluations with Nonrandomized Designs) guidelines( Reference Schulz, Altman and Moher 48 , Reference Des Jarlais, Lyles and Crepaz 49 ).
Participants, sampling, allocation and blinding
The target population consisted of 14–16-year-old Flemish adolescents (i.e. grade 3 and 4 of Belgian secondary schools). The sample size was calculated based on the healthy snacking ratio, in a three-level cluster design( Reference Konstantopoulos 50 ). To detect a difference of 20 % between intervention and control at the 5 % significance level with a power of 80 %, assuming an intraclass correlation of 0·02 at school and 0·03 at class level, mean and standard deviation of the healthy snacking ratio of 37·8 (sd 20·2) and 33 % oversampling to account for attrition, 1436 adolescents (control and intervention) were needed. The intraclass correlation, mean and standard deviation of the healthy snacking ratio were based on the earlier REWARD studies( Reference De Cock, Van Lippevelde and Vervoort 36 , Reference De Cock, Van Camp and Kolsteren 51 ). No random allocation of schools, classes or students took place, nor were there any exclusion criteria applied.
Procedure
The baseline assessment took place in January 2016; adolescents were given two class hours (±100 min) on a pre-agreed date to complete the survey at school in the presence of the research staff. In this way adolescents could ask for clarification in case some of the questions in the survey were not clear.
The app was launched at the schools in February 2016. Smartphones were provided to adolescents without smartphone, enabling participation of all adolescents. During the launch of the app, a tutorial on how to download the game and a short introduction stating the main purpose of the app (tracking their snack intake) was given. A tutorial summarizing how to use the app was incorporated in the app. In the first four minutes of the app adolescents were informed about the main app features by one of the app’s characters. During the four weeks of the intervention, however, the adolescents received only minimal guidance. Teachers and other school personnel did not provide any additional messages. Researchers visited the intervention schools weekly during the intervention period to solve any arisen problems and to collect feedback about the intervention from the adolescents (focus group discussions, results not presented/used here).
The post-survey took place in March and April 2016; adolescents were again given two class hours (±100 min) at school on a pre-agreed date to complete the survey at school in the presence of the research staff.
The CONSORT flowchart detailing the sampled adolescents and the procedure followed is shown in Fig. 1.
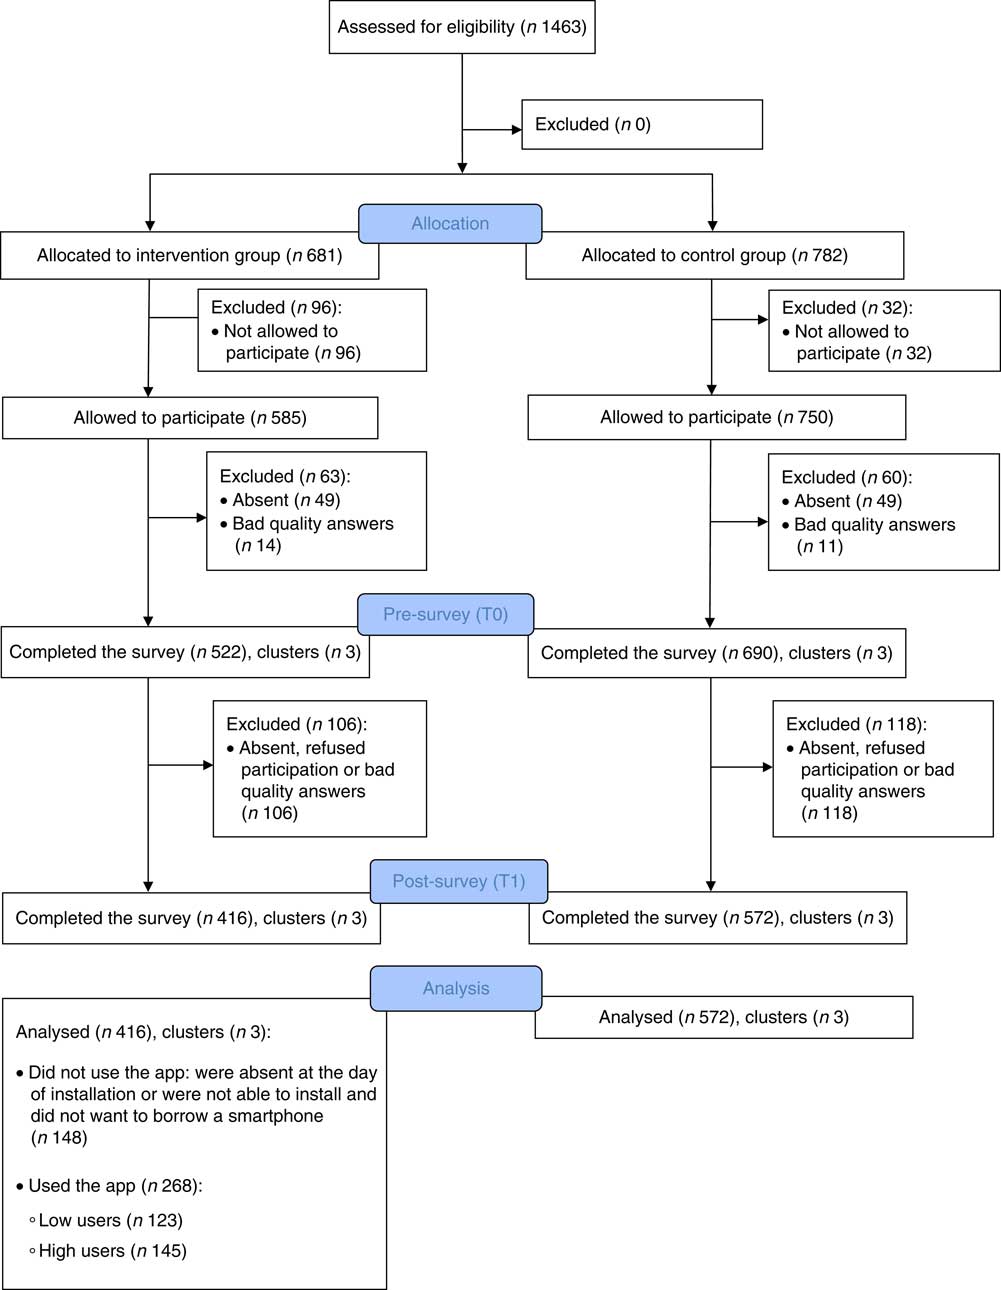
Fig. 1 (colour online) Flowchart of the ‘Snack Track School’ app intervention
Intervention
Intervention development
Briefly, the intervention was developed according to the systematic, stepwise, iterative and collaborative principles of the Intervention Mapping protocol( Reference Bartholomew, Parcel and Kok 52 ) and also made use of strong participatory methods. The dual process model( Reference Kremers, de Bruijn and Visscher 11 – Reference Hagger 13 ) was used as theoretical framework to describe the theory of change for the intervention, because it consists of both explicit and implicit pathways and allows the inclusion of other theoretical models like rewarding learning models and control theory. A detailed description of the intervention development, theoretical framework, targeted determinants, used behaviour change techniques and the participatory process is documented elsewhere( Reference Van Lippevelde, Vangeel and De Cock 47 ). Figure 2, however, provides a short overview of the theoretical basis of the intervention.
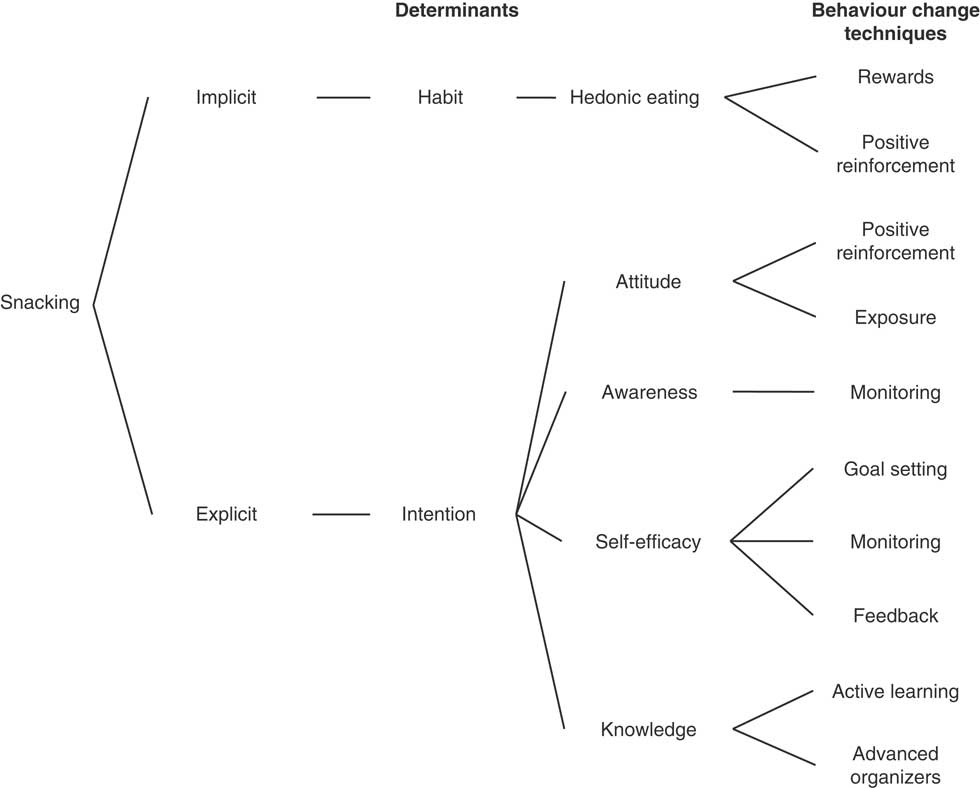
Fig. 2 Overview of the targeted determinants and their corresponding behaviour change techniques
‘Snack Track School’ app
The app presented a virtual high-school environment with typical school locations such as classrooms and a gym hall. The core elements of the app were a personal snack track tool, a credit and bonus system, a goal-setting booklet and a report card.
The snack track tool allowed the adolescents to register and monitor their individual snack intake. Adolescents could search and select their snack in a large snack database. For instance, if they consumed chocolate, they could search the database for chocolate or the specific brand of chocolate they consumed and then select this. Adolescents were just to complete their snack choice, not the consumed portion. The snack database was constructed based on the Belgian Internubel Trade Name database( 53 ) and contained over 3000 snack foods. For each snack consumed, the adolescents were then awarded credits reflecting its nutrition value.
The credit or points system of the app awarded points according to the UK Ofcom Nutrient Profiling Model (NPM)( 54 ). Points awarded ranged from 0 to 55, with 0 being very unhealthy and 55 very healthy. The points that adolescents collected during the week contributed to the total amount of points of the group that they were assigned to for that week’s challenge, a group competition or cooperation assignment (e.g. boys against girls or the entire group of adolescents of one intervention school working together to keep the virtual school from closing). The bonus system was added to the app to stimulate a balanced snacking pattern and not merely the tracking of as many snacks as possible. Bonuses were awarded according to three gratuities and one limitation was also built into the app. Participants could track as many snacks as they wanted, however they could only earn credits for the first ten snacks. Only ten snacks were allowed because we anticipated three to five snack moments and one or two snacks per snack moment. Recent research on snacking in adolescents in Europe also shows that adolescents eat a snack on average 2–3 times/d, with a maximum of 9–10 snacks/d( Reference Evans, Jacques and Dallal 55 , Reference Llaurado, Albar and Giralt 56 ). The three gratuities were based on the Flemish guidelines of recommended food and nutrient intakes for adolescents( 57 ), and the full explanation of how these gratuities were developed is given elsewhere( Reference Van Lippevelde, Vangeel and De Cock 47 ). Briefly, bonuses of 150 points were given for: (i) a snack intake of ≤6 snacks daily; (ii) a snack intake of ≥2/3 healthy snacks out of the total daily snacks; and (iii) not snacking, but involved in the app (logging into the app ≥3 times/d). Additionally, a bonus of 150 points was also given if the participants reached their daily goal.
A goal-setting feature in the form of a booklet was also incorporated in the app. Goal setting was applied from week 2 of the intervention until week 4. At the beginning of each week participants needed to select one of the four provided goal options, which they then needed to reach every day. In the case of success, the bonus of 150 points was awarded at the end of the day.
At the end of every week, participants also received feedback via a weekly report. This report portrayed all their consumed snacks per day, total credits, credits per snack and the awarded bonuses.
A summary of the different app intervention components and the corresponding behaviour change techniques is given in Table 1, while screenshots of the intervention components, the snack track tool, the credit system, the goal-setting booklet and the report card are shown in Fig. 3.
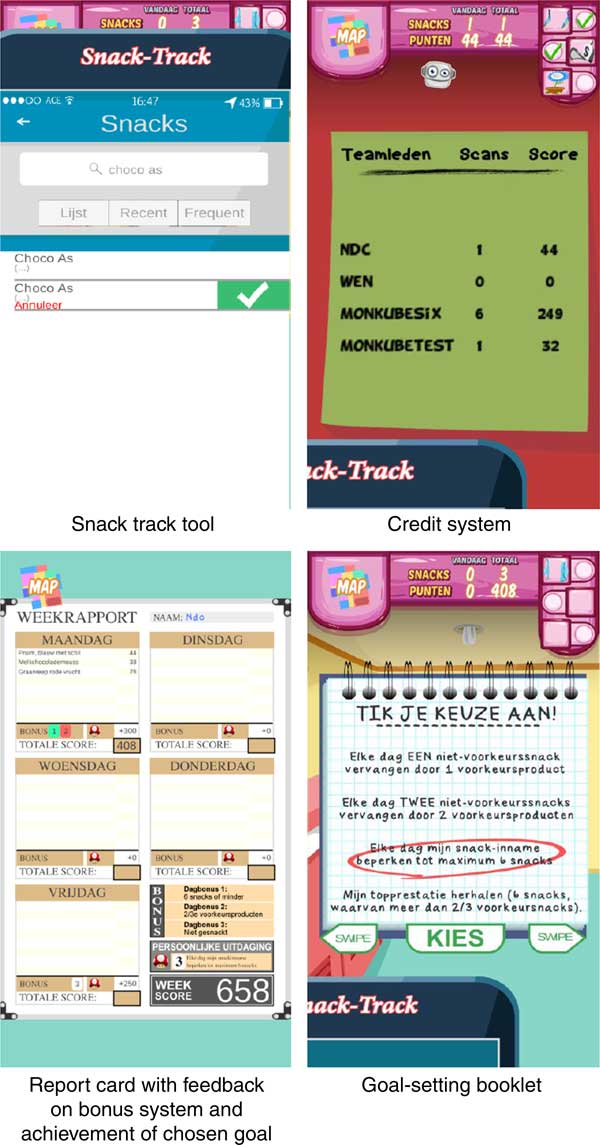
Fig. 3 (colour online) Screenshots of the ‘Snack Track School’ app’s intervention components
Table 1 Overview of the intervention components used in the ‘Snack Track School’ app
To increase adolescents’ feelings of engagement and gamification, several game features were also included. Every week had its own storyline and challenges embedded in a ‘game’ environment. Adolescents progressed through these weekly challenges (competition or cooperation group challenges) by their earned points. In addition, a customizable avatar and small assignments were incorporated. The rationale for including these specific game features is explained elsewhere( Reference Van Lippevelde, Vangeel and De Cock 47 ).
Measures
Outcome measures
Primary outcome
Snack intake was assessed using a validated quantitative snack and beverage FFQ, developed within the REWARD project, that probes for usual snack intake with a reference period of one month( Reference De Cock, Van Camp and Kolsteren 51 ). The intake of snacks was evaluated in terms of all food items consumed outside (>30 min) breakfast, lunch and dinner( Reference Rodriguez and Moreno 8 ). Snacks were classified as either unhealthy or healthy using the UK Ofcom NPM, which provides a score that represents the (un)healthiness of a beverage or food product( 54 ). The classification of the snacks as healthy or unhealthy can be found in the paper describing the validation of the FFQ( Reference De Cock, Van Camp and Kolsteren 51 ). For each FFQ category, the usual daily intake was calculated by multiplying the frequency of consumption with the quantity of consumption per week (grams) divided by 7. These daily intakes were then summed to obtain the daily intake of healthy snacks (grams) and unhealthy snacks (grams). Subsequently a healthy snack ratio was also calculated. The higher this ratio, the healthier was considered the snack intake of the adolescents:
 $$\eqalignno{ &{\rm Healthy}\,{\rm snack}\,{\rm ratio}\, {\equals}\ \cr& {{{\rm Daily}\,{\rm intake}\,{\rm of}\,{\rm healthy}\,{\rm snacks }\,({\rm g})} \over {{\rm Daily}\,{\rm intake}\,{\rm healthy}\,{\rm and}\,{\rm unhealthy}\,{\rm snacks}\,({\rm g})}}{\times}100.$$
Secondary outcomes
Next to the primary outcomes, secondary effects of the intervention are to be expected on the targeted determinants. The assessment of the constructs awareness, intention, attitude and self-efficacy was based on the reliable and valid healthy diet determinants of the Healthy Lifestyle in Europe by Nutrition in Adolescence (HELENA) study( Reference Vereecken, De Henauw and Maes 58 ). Habit was measured with the automaticity subscale (the ‘Self-Report Behavioural Automaticity Index’( Reference Gardner 59 )) of the Self-Report Habit Index( Reference Verplanken and Orbell 60 ). More information on these scales can be found in the paper describing the intervention protocol( Reference Schulz, Altman and Moher 48 ). Knowledge about the healthiness of snacks (proxy) was assessed by means of a scoring test. Adolescents rated the healthiness of each FFQ item (twenty-eight in total) by giving it a score ranging from 0 (very unhealthy) to 100 (very healthy). The difference between the correct score, calculated by means of the UK Ofcom NPM (rescaled to 100)( 54 ) (see above), and the score given by the adolescents was computed for each FFQ item. The absolute mean difference was then computed for all FFQ items; the smaller this absolute mean difference, the better their knowledge about the healthiness of snacks.
Other measurements
Adolescents’ sex and age (in years) were assessed with one-item questions at baseline. The education type of the adolescents was obtained from the schools.
Height and weight were measured at baseline and post-intervention by two trained research assistants using a standardized procedure( Reference van Stralen, te Velde and Singh 61 ). Age- and sex-specific BMI Z-scores were calculated using Flemish 2004 growth reference data( Reference Roelants, Hauspie and Hoppenbrouwers 62 ). The International Obesity Task Force cut-off points were used to separate overweight and non-overweight individuals( Reference Cole and Lobstein 63 ).
SR was measured with the BAS Drive subscale of the Dutch version of the Carver and White BAS (behavioural activation system) scales for children( Reference Muris, Meesters and De Kanter 64 ). In the present sample, the Cronbach’s α for BAS Drive at baseline was 0·80. Scores of BAS Drive items were added and presented as a score ranging from 4 to 16.
A more detailed explanation on how height, weight and SR were measured can be found elsewhere( Reference Van Lippevelde, Vangeel and De Cock 47 ).
In addition, snack availability at home; peer and parental influence; dietary restraint; pubertal status; total energy intake; meal patterns; duration and frequency of game play; general game preferences, engagement, motivations, addiction and preferences for structural game characteristics; and smartphone and tablet use were assessed( Reference Van Lippevelde, Vangeel and De Cock 47 ). However, these variables were not considered in the present study.
Process evaluation
Following previous process evaluations of mHealth interventions in adolescents and young adults, the process evaluation focused on reach and dose received (exposure and satisfaction)( Reference Blackman, Zoellner and Kadir 65 – Reference Partridge, Allman-Farinelli and McGeechan 67 ). According to Saunders et al., ‘reach’ refers to degree to which the intended priority audience participates in the intervention; ‘exposure’ refers to the extent to which the participants use the intervention; and ‘satisfaction’ refers to the satisfaction of the participants with the programme( Reference Saunders, Evans and Joshi 45 , Reference Van Lippevelde, Vangeel and De Cock 47 ). Within the current intervention, reach was evaluated as the number of adolescents who downloaded the app and exposure by the frequency of use of the app. Every time the adolescents used the app this was logged and stored in a log database, together with all actions they performed within that login session such as entering a snack consumption (time, type and points) or opening their locker (process evaluation log data). Adolescents’ satisfaction with the app was measured after the intervention using the core module of the game experience questionnaire( Reference Poels, de Kort and Ijsselsteijn 68 ), which measures seven dimensions of gamers’ experience (competence; sensory and imaginative immersion; flow; annoyance; challenge; negative affect; positive affect). Mean scores were computed for each of the dimensions.
Statistical analyses
Data were analysed using the statistical software package Stata version 13 SE.
We compared sample characteristics between intervention and control group at baseline, using χ 2 tests and t statistics (adjusted for clustering using Stata’s ‘svy’ command). In addition, we assessed if participant characteristics were associated with study attrition, also applying χ 2 tests and t statistics (adjusted for clustering).
We evaluated reach by reporting the number of adolescents who downloaded the app. Exposure or frequency of use was assessed by counting the number of days that adolescents logged into the app and ranged from 1 to 28. Multiple logins per day were recoded to 1 for that day. The number of participants who logged into the app each day (1 to 28) of the intervention was then computed and reported. In addition, adolescents were divided in three groups according to their exposure to the app. These three ‘app use’ categories were created based on the continuous frequency of use, resulting in three equal app use categories (tertiles): 1=app non-users (logged in ≤0 d), 2=low app users (logged in <4 d) and 3=high app users (logged in >4 d). Baseline characteristics of these non-users, high and low app users were compared using F tests and χ 2 tests adjusted for clustering (using Stata’s ‘svy’ command). We also compared post-intervention app satisfaction ratings (competence, immersion, flow, annoyance, challenge, positive and negative affect) for the high and low app users by means of t statistics (adjusted for clustering).
We assessed the intervention effect on the healthy snack ratio using multilevel linear regression modelling with three levels to account for the clustered design of the study (adolescents within classes and schools). Because of the non-random allocation of the intervention to schools we analysed the intervention effect by difference-in-difference (DID) analysis, in which the average difference in the intervention group is compared with the average difference in the control group to determine the intervention effect( Reference Bray, Schlunder and Zarkin 69 ). We conducted our analyses on the full analysis set, but also assessed impacts by exposure level as an exploratory analysis (see further). The dependent variables were the difference between post-intervention (T1) and baseline (T0) in healthy snack ratio, awareness, intention to eat healthy snacks, attitude regarding the taste of healthy snacks (attitude taste), attitude regarding overall health when consuming healthy snacks (attitude health), self-efficacy to eat healthy snacks, habit to eat healthy snacks and knowledge about the healthiness of snacks. Random effects in the models were school and class and fixed effects were a dichotomous variable indicating intervention (=1) or control (= 0) and the baseline covariates age, BMI Z-score, sex and education type of the adolescents. The latter are known covariates in healthy eating interventions in children and adolescents. In these models the b coefficient should be interpreted as the difference between the intervention and control group in mean change in the dependent variables from pre to post. To assess the effect of the adjusting, we also analysed the effect of the intervention using crude models.
Furthermore, we assessed if the intervention effect differed according to exposure level (exploratory) by means of the same approach as stated above for the general intervention effects, but with a categorical exposure variable with four groups (0=control, 1=app non-users, 2=low app users, 3=high app users) as independent variable.
Finally, we explored the moderation of the intervention effects by SR and sex for all dependent variables using the above-described multilevel impact analysis, by adding respectively SR and the interaction terms SR × intervention, sex × intervention and sex × SR × intervention to the adjusted models. In case of indications of moderation, analyses were run again for boys and girls separately.
For all multilevel regression models, continuous parameters were centred around the mean and outliers were removed if their values were larger or smaller than 3 sd of the distribution. Unstandardized coefficients and their standard errors were displayed and associations with P values <0·05 were considered statistically significant. All statistical tests were two-sided.
Results
Participants
Of the 1463 adolescents selected to participate, 681 (46·5 %) were part of the intervention group and 782 of the control group (see Fig. 1). Of these 1463 adolescents, 1212 successfully completed the baseline survey, with respectively 522 adolescents (76·7 %) in the intervention group and 690 (88·2 %) in the control group. An overview of the non-participating adolescents can be found in Fig. 1, the CONSORT flowchart.
The post-survey was completed by 416 and 572 adolescents in the intervention and control group, respectively. From baseline (n 1212) to post intervention (n 988), 106 adolescents in the intervention group and 118 in the control group dropped out (see Fig. 1). The adolescents who dropped out were significantly older (t=3·37, P<0·05), had a lower score for attitude regarding overall health when eating healthy snacks (t=−3·69, P<0·05) and a lower knowledge about the healthiness of snacks (t=3·35, P<0·05). No significant differences between the adolescents who dropped out and those who did not were found for sex, education, SR, BMI Z-score, healthy snack ratio, awareness, intention to eat healthy, attitude regarding the taste of healthy snacks, self-efficacy to eat healthy and habit to eat healthy snacks.
Of the 1463 adolescents, 988 completed both the baseline and post-survey and a participation rate of 67·5 % was thus obtained to evaluate the intervention impact. No schools (clusters) were lost in the intervention or control group. The mean age of the 988 adolescents considered for analysis was 14·9 (sd 0·70) years, the mean BMI Z-score was 0·11 (sd 0·99), 59·4 % were boys, 31·8 % followed general education, 48·6 % technical education and 18·4 % vocational education. Table 2 shows the mean healthy snack ratio and other characteristics at baseline of the sample (n 988). No statistically significant differences were observed between the intervention and control groups at baseline. However, we note that the healthy snack ratio was ~8·5 % higher in the control group compared with the intervention group.
Table 2 Characteristics of the sample of 14–16-year-old adolescents (n 988) from six secondary schools (three intervention schools, three control schools) in two (matched) cities, ‘Snack Track School’ app intervention, Flanders, Belgium, January–April 2016
† Adjusted for clustering (three clusters per group).
Process evaluation
Reach
In the intervention group, 268 adolescents (64·4 %) downloaded the app or borrowed a smartphone with the app already installed on it; 148 adolescents were absent at the day of installation, did not want to participate any more or could not download the app on their smartphone. These latter adolescents also did not want to borrow a smartphone with the app already installed on it.
Exposure to the intervention
Of the 268 adolescents who downloaded the app or borrowed a smartphone with the app already installed on it, 266 (99·2 %) logged in at least once in week 1, 152 (56·7 %) in week 2, eighty-nine (33·2 %) in week 3 and fifty-five (20·5 %) in week 4. The percentage of adolescents who logged in at each day of the intervention decreased gradually from day 1 until day 28 (Fig. 4). Small increases around days 8, 10, 15 and 22 coincided with the days of the researchers’ weekly visits.
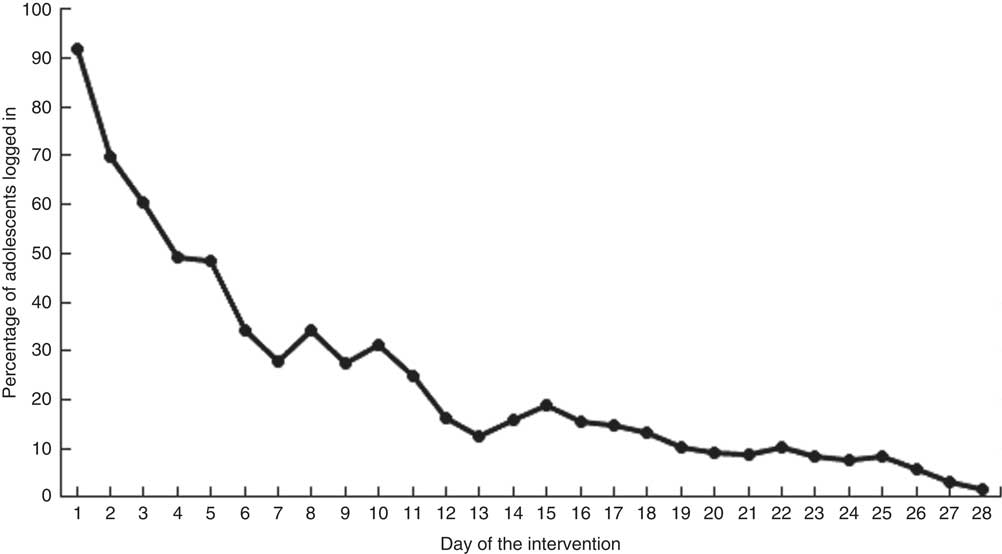
Fig. 4 Percentage of adolescents (intervention group only, n 268) who logged into the app on each day of the intervention, ‘Snack Track School’ app intervention, Flanders, Belgium, January–April 2016
The mean exposure to the intervention, measured in the number of days that the adolescents logged into the app, was 4·78 (sd 6·21) d for the full intervention group (n 416). When we excluded the adolescents who did not use the app (n 148), the mean exposure was 7·41 (sd 6·35) d.
Non-users, low and high app users differed at baseline in age, BMI Z-score, SR, percentages following general, technical or vocational education, healthy snack ratio and self-efficacy to eat healthy (see Table 3). The high app users were the oldest with a mean age 15·03 (sd 0·04) years and followed more general education. Adolescents in this high app user group also had the highest healthy snack ratio and the highest score for self-efficacy to eat healthy and the lowest SR score at baseline. The low app users had the lowest BMI Z-score compared with the non-users and high users. No significant differences between non-users, low and high app users could be observed for percentage boys, awareness, intention to eat healthy, attitude regarding the taste of healthy snacks, attitude regarding overall health when eating healthy snacks, habit to eat healthy and knowledge about the healthiness of snacks.
Table 3 Baseline characteristics according to app user group (intervention group only, n 416) among 14–16-year-old adolescents, ‘Snack Track School’ app intervention, Flanders, Belgium, January–April 2016
*P<0·05, **P<0·01, ***P<0·00.
† Adjusted for clustering.
‡ t Test for low and high app users.
§ Same χ 2 test for the variable education type.
Satisfaction
Both the high and low app users provided low rates for flow due to the app, the competence to use the app, the sensory and imaginative immersion into the app, the positive affect due to the app, the annoyance with the app and the challenge experienced (mean score ≤1 ‘slightly’). Both user groups did experience moderate negative affect due to the app (1 ‘slightly’<mean score ≤2 ‘moderately’). The high app users significantly rated the flow due to the app lower, felt more competent to use the app and experienced more positive affect due to the app than the low app users (see Table 4). No significant differences between high and low app users were observed for immersion, annoyance, challenge and negative affect.
Table 4 App satisfaction ratings for high and low app users (intervention group only, n 416) among 14–16-year-old adolescents, ‘Snack Track School’ app intervention, Flanders, Belgium, January–April 2016
*P<0·05, **P<0·01.
† Adjusted for clustering.
Effect evaluation
Overall effects on the primary and secondary outcomes
We did not find statistically significant differences between the intervention and control groups for the healthy snack ratio, awareness, intention to eat healthy, attitude regarding the taste of healthy snacks, self-efficacy to eat healthy and habit to eat healthy snacks (see Table 5). A significant difference between intervention and control groups was observed for attitude regarding overall health when eating healthy snacks and knowledge about the healthiness of snacks. The score for attitude regarding overall health when eating healthy snacks decreased from baseline (T0) to post-intervention (T1) with 0·13 (se 0·05) points more (P=0·0, Cohen’s d=0·16) in the intervention group than in the control group. The knowledge about the healthiness of snacks decreased from T0 to T1 in the intervention group with 1·37 (se 0·25) points (P=0·04, Cohen’s d=0·20) compared with the control group, where the knowledge increased.
Table 5 Effect of the intervention on the difference in outcomes between T0 (baseline) and T1 (post-intervention) among 14–16-year-old adolescents, ‘Snack Track School’ app intervention, Flanders, Belgium, January–April 2016
ΔC, mean difference of the outcomes measured before and after the intervention in the control group; ΔI, mean difference of the outcomes measured before and after the intervention in the intervention group; DID, difference-in-difference.
*P<0·05, **P<0·01.
† Crude multilevel models without covariates.
‡ Multilevel models adjusted for age, BMI Z-score, sex and education type.
§ Adjusted for clustering.
║ Cohen’s d was calculated by dividing the adjusted DID coefficient by the total residual variance( Reference Hedges 86 , Reference Feingold 87 ).
¶ Cohen’s f 2 was calculated as follows( Reference Selya, Rose and Dierker 88 ): (R 2 full model – R 2 reduced model)/(1 – R 2 reduced model).
Intervention effects according to exposure groups
A difference between the control group and the low app user group was observed for attitude regarding overall health when eating healthy snacks (Table 6). The low app users had a significantly higher decrease in attitude compared with the control group (b=−0·24 (se 0·08), P<0·01). A difference between the control group and the non-users and low app users was also observed for the knowledge about the healthiness of snacks (Table 6). The non-users and low app users had a higher decrease in knowledge about the healthiness of snacks compared with the control group (b=1·66 (se 0·71), P<0·05 for non-users; b=1·55 (se 0·72), P<0·05 for the low app users). No other significant differences were observed between the control group and the high app users.
Table 6 Effect of the exposure on the difference in healthy snack ratio and the targeted determinants between T0 (baseline) and T1 (post-intervention), as compared with the control group, among 14–16-year-old adolescents, ‘Snack Track School’ app intervention, Flanders, Belgium, January–April 2016
DID, difference-in-difference.
*P<0·05, **P<0·01.
† Crude multilevel models without covariates.
‡ Multilevel models adjusted for age, BMI Z-score, sex and education type.
§ Reference group=control group.
Moderation analysis
A significant three-way interaction effect (intervention × SR × sex) was found for difference in healthy snack ratio (b=−3·92 (se 1·33), P<0·01). When analyses were conducted separately for boys and girls, a significant and contrasting intervention × SR interaction was found for both (boys: b=1·92 (se 0·81), P<0·05; girls: b=−2·28 (se 1·02), P<0·05). Margin plots are shown in Fig. 5. In boys of the intervention group, the intervention increased the healthy snack ratio with higher SR (b=1·38 (se 0·59), P<0·05), whereas in girls the opposite was observed (b=−1·90 (se 0·94), P<0·05). In the control group the healthy snack ratio did not increase or decrease significantly from T0 to T1 with higher SR in boys or girls.
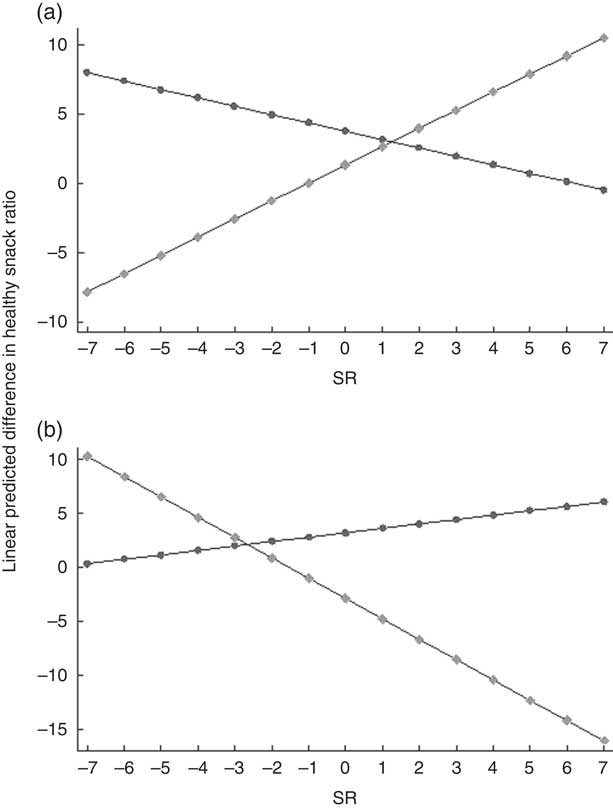
Fig. 5 Margin plots of sensitivity to reward (SR) × condition (![]() , control group, n 572;
, control group, n 572; ![]() , intervention group, n 416) on healthy snack ratio for adolescent boys (a) and girls (b), ‘Snack Track School’ app intervention, Flanders, Belgium, January–April 2016. Analyses controlled for age, BMI Z-score and education type
, intervention group, n 416) on healthy snack ratio for adolescent boys (a) and girls (b), ‘Snack Track School’ app intervention, Flanders, Belgium, January–April 2016. Analyses controlled for age, BMI Z-score and education type
Discussion
The present study evaluated the feasibility and impact of a newly developed smartphone app ‘Snack Track School’ on the healthy snack ratio and the targeted determinants of Flemish adolescents aged 14–16 years old. The intervention incorporated rewarding strategies together with reflective strategies delivered through a gamified application. We were unable to demonstrate a significant positive impact of the intervention on the healthy snack ratio and targeted determinants compared with the control group. The process evaluation results, however, allow us to better understand these findings.
The reach of and exposure to the intervention was low. As for reach, only 64·4 % of the adolescents in the intervention group downloaded the app. This could be explained by the difficult installation process of the app. The installation of the app was time-consuming and required considerable smartphone memory. The percentage of adolescents who used the app (exposure) also decreased gradually over the intervention period. Of the 268 adolescents who actually used the app, only 20·5 % were still logging into it in the fourth week of the intervention. This low engagement could possibly be explained by the low app satisfaction. Mean ratings of app satisfaction were low in both the low and the high app user groups. The adolescents reported to experience little flow, a mental state characterized by focused attention and enjoyment( Reference Perski, Blandford and West 70 ), challenge and positive feelings when playing the app. Despite our efforts to develop attractive game components in participation with the target population (see above), the app was insufficiently engaging for the adolescents. Efforts will thus be needed to increase the feeling of flow and the experienced challenge with the ‘Snack Track School’ app to improve the engagement. Better understanding and improvement of factors that determine participant engagement and retention is crucial to improve intervention impact( Reference Schoeppe, Alley and Van Lippevelde 42 , Reference Perski, Blandford and West 70 , Reference Garde, Umedaly and Abulnaga 71 ). Engagement with digital behaviour change interventions is influenced by the used features( Reference Perski, Blandford and West 70 ); given that the current app intervention was a combination of rewarding strategies, reflective strategies and game mechanisms, further exploration of the log data together with the collected qualitative data will be needed to determine which app features and/or behaviour change techniques mainly need to be altered in order to increase engagement.
A higher use of the app was also not related to positive intervention effects. It might be that the use of the app even within the highest app user group was inadequate to achieve the desired effects. The mean number of days that these high app users logged into the app was still only 12 d, which is less than half of the intervention period. However, self-selection might also play a role here: the high app user group already had the highest healthy snack ratio, self-efficacy to eat healthy and the lowest SR at baseline.
Only a few other studies also developed an app- or web-based game to improve adolescents’ health( Reference Spook, Paulussen and Kok 66 , Reference Majumdar, Koch and Lee 72 , Reference Baghaei, Nandigam and Casey 73 ). ‘Diabetic Mario’, a mobile game to improve diabetes management based on informal learning principles, showed positive effects on diabetes management( Reference Baghaei, Nandigam and Casey 73 ). The adolescents also enjoyed playing the game and gave positive satisfaction ratings( Reference Baghaei, Nandigam and Casey 73 ). However, the game was only pilot-tested in a sample of twelve adolescents, and a larger efficacy trial is yet to come. ‘Balance It’, an app-based intervention to promote healthy eating and higher physical activity in adolescents based on self-regulation techniques, showed positive effects only in a subgroup of high users( Reference Spook, Paulussen and Kok 66 ). Only 27·6 % of the adolescents actually used the app as intended and neutral to positive app satisfaction ratings were given( Reference Spook, Paulussen and Kok 66 ), which is comparable to the retention and satisfaction achieved in the present study. ‘Creature 101’, a web-based game which aimed to change energy balance-related behaviour in adolescents based on social cognitive and self-determination theory, reported an intervention retention rate of 64 % and was able to significantly reduce intake of sweetened beverages and processed snacks( Reference Majumdar, Koch and Lee 72 ). ‘Creature 101’ was implemented within the school curriculum, while our ‘Snack Track School’ was a stand-alone intervention in which adolescents used the app with minimal external assistance or instructions during school breaks or at home. As argued earlier( Reference Crutzen, Kohl and de Vries 74 ), intervention retention and effects could possibly also be improved by embedding our app within the existing school structure. Also, teachers were currently not engaged in the intervention implementation, as school directors preferred that the teachers were not to be burdened even more. Stok et al. also mention that adolescents prefer intervention strategies to be delivered by teachers than by policy makers( Reference Stok, de Ridder and de Vet 75 ). Also, as small increases in the percentage of adolescents logged in were observed after the visits of the researchers, giving teachers a more active role to remind or encourage the adolescents could greatly improve retention. In addition, reviews by DeSmet et al. ( Reference DeSmet, Van Ryckeghem and Compernolle 76 ) and Schoeppe et al. ( Reference Schoeppe, Alley and Van Lippevelde 42 ) reported that intervention effects were higher for respectively serious games or apps incorporated within a multicomponent intervention. Incorporating the app in a multicomponent intervention embedded in existing school structures, such as classes, and involving the school teachers more in the intervention implementation, could thus help to increase intervention retention and impact. It could also help to decrease the initial large dropout, as the unbalanced dropout was most likely to be related to the intervention. Several parents did not want their child to enrol in a four-week mHealth intervention programme, because this would distract them too much from their schoolwork.
Evidence of moderation of the intervention effects by sex and reward sensitivity was found for the healthy snack ratio. The intervention slightly increased the health snack ratio in boys with higher SR, while in girls the opposite was observed. The latter could be interpreted by the fact that girls already ate healthier at the start of the intervention (girls had a significantly higher healthy snack ratio at baseline than boys, t=−8·12 and P<0·001) and rewarding strategies may have had a counterproductive effect. Previous studies found that rewards can have a counterproductive effect when the food is already liked( Reference Vandeweghe, Verbeken and Moens 26 , Reference Cooke, Chambers and Anez 77 ). However, the intervention was a combination of game features and reflective and rewarding behaviour change strategies. Also, high app users were more often female and following general education, felt more competent to use the app, had a higher attitude regarding overall health when eating healthy and had a higher healthy snack ratio at baseline. This confirms previous studies that reported a more intense use of health-related apps to be associated with being female and being higher educated( Reference Wiederhold 78 , Reference Sandholzer, Deutsch and Frese 79 ). Possibly girls used more the app’s reflective methods such as the goal-setting booklet or the report card. Previous research also indicated that female children, adolescents and young adults have healthier food preferences, stronger beliefs in healthy eating and show more weight control involvement than male subjects( Reference Wardle, Haase and Steptoe 80 , Reference Cooke and Wardle 81 ). The game setting and features might also have appealed more to girls than to boys. Girls tend to prefer simpler explorative games, while boys prefer competitive challenging games( Reference Kinzie and Joseph 82 , Reference Lucas and Sherry 83 ). However, girls did not have higher app satisfaction ratings than boys (results not shown) in the intervention group despite the higher use. Exploration of the log data together with the collected qualitative data (see above) could also shed light on the different game features and behaviour change strategies used/preferred by girls and boys and high SR girls, high SR boys, low SR girls and low SR boys. However, the current data already indicate that different strategies and/or app features might be needed to achieve healthier snacking habits depending on sex and SR. The reviews by DeSmet et al. ( Reference DeSmet, Van Ryckeghem and Compernolle 76 ) and Schoeppe et al. ( Reference Schoeppe, Alley and Van Lippevelde 42 ) also concluded that tailoring smartphone apps to specific populations or user characteristics might enhance intervention impact.
To date, only a few other studies have assessed the effectiveness of smartphone apps to change adolescents’ or children’s eating or physical activity behaviors( Reference Schoeppe, Alley and Van Lippevelde 42 , Reference Spook, Paulussen and Kok 66 , Reference Garde, Umedaly and Abulnaga 71 – Reference Baghaei, Nandigam and Casey 73 ). To our knowledge, the present study is the only one that considered both rewarding (targeting the implicit habits driven by the difference in reinforcing value between healthy and unhealthy snacks) and reflective strategies (targeting the explicit pathways) to improve adolescents’ choices of healthy snacks. In addition, only a few other studies reported to log all actions of their intervention users( Reference Spook, Paulussen and Kok 66 , Reference Baghaei, Nandigam and Casey 73 ). Schoeppe et al. stressed that more of such objective app usage statistics should be collected to better understand levels of engagement and reasons for participant (dis)engagement and intervention exposure( Reference Schoeppe, Alley and Van Lippevelde 42 , Reference Partridge, Juan and McGeechan 43 ). Another strength of the present study was the elaborate intervention development process (based on the principles of intervention mapping) that included a strong theoretical base, several preliminary studies and a participatory approach. Our study also had limitations. First, the intervention was not randomized, so selection bias could have occurred. However, we used a mixed DID model and also adjusted the analyses for baseline values of age, BMI Z-score, sex and education type( Reference Bray, Schlunder and Zarkin 69 ). Second, we were unable to assess if borrowing a smartphone led to different intervention effects. Due to practical difficulties, we were unable to keep track which adolescents completed the intervention on a borrowed smartphone. Borrowing a smartphone might have increased the app use and/or satisfaction in those not having an own smartphone, while having to carry two smartphones in those having an own smartphone might have decreased use and/or satisfaction. Given that app use itself was not associated to differences in impact, we are however fairly confident that borrowing a smartphone will not have influenced the intervention impact. Third, the possibility that participants lied about their snack intake to get more points was a limitation. This was countered, however, by the built-in snack peer validation system. At random, participants were asked to take a selfie showing that the snack entered in the app was truly being consumed. These pictures then needed to be validated by their peers in the app via the validation feature of the app. Two peers were to agree that the snack entered in the app fitted the selfie. In case two different answers were given, a project researcher took the final decision to determine if the participants had cheated or not. If the participant was considered a cheater, the given points for that snack were deducted the next day and the participant needed to complete a punishment, which consisted of a small game cleaning the playground, before being able to continue using the app. If a participant cheated, this was recorded in the log data; however, full analysis of the log data was beyond the scope of the current paper. Fourth, snacks were classified as either unhealthy or healthy using the UK Ofcom NPM. This nutrient profile model was chosen over others because it provides a continuous score, awards points based on both positive and negative constituents, is an across-the-board model, is suitable for all types of food products, evaluates all food products in the same way and was externally validated( Reference Scarborough, Boxer and Rayner 84 , Reference Scarborough, Payne and Agu 85 ). However, this model scores items based on the nutrient composition per 100 g, not taking portion size into account. The latter is unfortunate, as snacks are eaten in typical portion sizes such as ‘one bar’, ‘one bag’ or ‘one piece’ that is sometimes larger than 100 g like one kebab. The portion size should thus also contribute to the evaluation of a food product as a healthy or unhealthy snack choice. However, to date, no specific nutrient profile model for snacks has been developed and therefore the best suitable model was chosen. A final limitation was that the data on snack intake and the determinants were self-reported and were thus subject to social desirability bias. It was attempted to counter this bias by emphasizing anonymity of the data collection.
Conclusions
The current ‘Snack Track School’ app was not able to improve adolescents’ snack choices or their determinants, due to the low reach, exposure and satisfaction of the involved adolescents. However, the process evaluation raised several crucial points to improve future intervention development, retention and impact in adolescents.
First, choosing an attractive intervention medium, a gamified app, is not enough to achieve a high reach and continued engagement. In the future, intervention developers should opt to incorporate apps in multicomponent interventions embedded in existing school structures and involve school teachers in the intervention implementation.
Second, extensive attention should be paid to the content (behaviour change strategies and game features) and design of the app. Content and design more appealing and engaging to the adolescents should be chosen, longer testing with and consulting of the adolescents should be considered, and the translation of behaviour change techniques to app components should be extensively studied.
Third and finally, tailoring of the app content (based on individual characteristics) to improve impact, reach, exposure and/or satisfaction should be considered.
Acknowledgements
Acknowledgements: Data collection was assisted by several students: Annelies Malengier, Liesbeth Vandendriessche, Lotte De Vos, Sander Vandamme, Elke Rammant, Floor De Groote, Lisa Schoenmaekers, Ilka Walleyn, Jana De Block, Delphine Herman and Lisa Van Wilder. Financial support: This study was supported by the Flemish Agency for Innovation & Entrepreneurship (Belgium). The sponsors were not involved in the study design, collection, analysis or interpretation of the data. The first and corresponding author had access to all data at all times and had the final responsibility to submit the manuscript for publication. Conflict of interest: The authors declare that there were no conflicts of interest. Authorship: The authors’ responsibilities were as follows: N.D.C. conducted the research, conducted the analyses and wrote the paper; W.V.L. and C.L. helped analysing the results and writing the paper; J.V. and M.N. conducted the research and helped revise the manuscript; L.H., L.G., K.B., S.E., B.D., L.M., J.V.C., C.B., E.M. and S.V. designed the research and helped revise the manuscript. All authors read and approved the final manuscript. Ethics of human subject participation: This study conducted according to the guidelines laid down in the Declaration of Helsinki and all procedures involving human subjects were approved by the Ethics Committee of the University Hospital of Ghent University and the University of Leuven. Passive written informed consent was obtained from the parents of the participating adolescents.


