Adolescence is a unique period that represents immense biological and socio-emotional development, typically alongside increased requirements for energy, protein, vitamins and minerals(Reference Spear1). Adolescence is characterised by a rapid growth that is second only to that of infancy(Reference Das, Salam and Thornburg2). Adolescents gain up to half of their adult weight, more than 10–25 % of their adult height(Reference Christian and Smith3), and 45 % of their adult skeletal mass during these years(Reference DiMeglio4). An increase in the requirement of energy and nutrients when combined with household food insecurity put adolescents at higher risk of undernutrition(Reference Spear1,Reference Berhe, Kidanemariam and Gebremariam5–Reference Gebregyorgis, Tadesse and Atenafu7) .
Undernutrition in this age group constrains rapid physical growth and development(8–Reference Peeling and Smart10) leading to poor school performance(Reference Belachew, Hadley and Lindstrom11), delay menstruation(8,Reference Frisch12) , limit work productivity(Reference Deshmukh, Gupta and Bharambe13) and increase the risk of infection and severity of illness(Reference Macallan14,15) . Undernourished adolescent girls are more likely to give birth to low birth weight infants(Reference Naeye16). Thus, one critical window to disrupt the intergenerational cycle of malnutrition is the adolescent period nutrition intervention.
To mitigate the adverse health outcomes of adolescent undernutrition, timely screening is an initial vital step. Therefore, there is a need for a simple, reliable and accurate screening tool to identify undernutrition in this age group(Reference Jeyakumar, Ghugre and Gadhave17). The WHO recommends BMI Z-score to identify adolescents with thinness (BMI Z-score < −2 sd)(Reference de Onis, Onyango and Borghi18). Even with its popularity and easiness to use, it has several drawbacks. BMI Z-score is less preferred by minimally trained healthcare workers also requires regular calibration and maintenance. Particularly, screening adolescents at the community level using BMI Z-score may be cumbersome(Reference Neovius, Linne and Barkeling19,Reference Craig, Bland and Ndirangu20) . In addition to this, height and weight measurements are sometimes subjected to inaccuracy as the floor may not be flat or there may not be enough light in the house that the surveyor visits(Reference Dasgupta, Butt and Saha21).
Mid-upper arm circumference (MUAC) can be an invaluable alternative to BMI Z-score and overcome some of its practical limitations. MUAC is simple, easy to perform, relatively inexpensive and more convenient than using BMI Z-score(Reference Jeyakumar, Ghugre and Gadhave17). However, MUAC also requires training and standardisation for accurate measurement(Reference Saeed, Mogendi and Akparibo22). MUAC is commonly used to identify moderate and severe acute undernutrition among under-five children (6–59 months of age) in low- and middle-income countries(Reference Myatt, Khara and Collins23). Several studies have also suggested MUAC can effectively screen underweight among adults and women in reproductive age. These studies have proposed an optimal cut-off point range between 23·2 and 24·3 cm(Reference Nguyen, Ramakrishnan and Katz24–Reference Das, Saimala and Reddy27). To date, there is no well-established cut-off point to identify adult underweight. However, in an effort to establish a global cut-off point, a meta-analysis proposed cut-off point ≤23·5–≤25·0 cm could serve as an appropriate screening indicator for underweight with high discriminatory ability among adults(Reference Tang, Chung and Dong28). MUAC is not widely used to identify adolescents with thinness and severe thinness; there are no universally accepted cut-offs in this age group. Few studies have explored the performance of MUAC as a screening tool for thinness among the adolescent population in India (Asian). These studies have proposed an optimal MUAC cut-off point range between ≤17·7 cm and 21·6 cm depending on the age of adolescents(Reference Jeyakumar, Ghugre and Gadhave17,Reference Dasgupta, Butt and Saha21,Reference Sethi, Gupta and Pedgaonkar29,Reference De30) . However, little is known about the diagnostic performance of MUAC to detect thinness among 15–19-year-old adolescents, in our context. As well, body size and body fat distribution vary according to ethnic group which in turn impacts the interpretation and performance of MUAC; due to this, findings from other parts of the world may not translate directly to our context(Reference Freedman, Wang and Thornton31). For the above-stated reasons, we conducted this study with the aim to evaluate the performance of MUAC to identify thinness (BMI Z-score < −2 sd) among adolescents aged 15–19 years in Ethiopia.
Methods
Study setting, study design and participants
A school-based, cross-sectional study was conducted among adolescents aged 15–19 years in selected public and private high schools in Addis Ababa, from March to May 2019. There are 635 903 adolescents, of which 385 713 are between the age of 15 and 19 years(32).
Adolescents, aged 15–19 years, who were attending class in selected private and public high schools of Addis Ababa were eligible to be included in the study. Adolescents with a physical deformity that affect height and weight measurement were excluded from the study. We also excluded adolescents who refused any of the anthropometric measurements.
Sampling procedure
After obtaining a complete list of all schools from the Addis Ababa city administration education bureau. A total of fifteen schools (ten private and five public schools) were selected using a simple random sampling technique. The sample size was distributed proportionally between public (550 participants) and private (327 participants) schools. Four sections from each selected school and one section from each grade level (grades 9–12) were selected randomly. Finally, we used the students list to randomly select participants from each section.
Study procedures and anthropometric measurements
Trained data collectors performed anthropometric measurements (weight, height and MUAC) using standard techniques and procedures(Reference Lohman, Roche and Martorell33). All anthropometric measurements were taken twice, and the average of the two measurements was used for analysis. When the difference between the two measurements was beyond the maximum tolerable difference (>200 g for weight, >0·5 cm for MUAC and height), the measurement was repeated.
MUAC was measured on the non-dominant arm using UNICEF (United Nations Children’s Fund) adult MUAC, non-stretchable plastic tape at the midpoint between the acromion process of the scapula and the olecranon process (elbow). Measurement was taken when the arm was relaxed (hang loosely by the study participant side). The MUAC tape was placed around the marked midpoint of the arm, neither too loose nor too tight, and the measurement value was recorded to the nearest 0·1 cm. To minimise incorporation bias, MUAC was measured before weight and height measurements. Immediately after measuring MUAC, height and weight measurements were performed. The BMI Z-score for all participants was computed after the completion of the data collection, which avoids incorporation bias to the measurements.
Height was measured using a SECA portable stadiometer (SECA 213). The stadiometer was placed with the backboard supported by a wall. Adolescents were measured with the head, back, buttocks and heels touching the backboard; heels together; knees extended; head in the Frankfort horizontal plane; hairstyles and hair accessories that interfere with the measurement process were undone, adjusted or removed. Height was recorded to the nearest 0·1 cm.
Weight was also measured using SECA electronic weighing scale and recorded to the nearest 0·1 kg. Weight was measured barefoot wearing a light cloth. To ensure measurement accuracy, the scale was checked for zero reading before each participant and calibrated daily with an iron bar of 5 kg.
To define thinness (including severe thinness), we use the WHO BMI Z-score reference. Adolescents with BMI Z-score < −2 sd were considered as having thinness(34). BMI Z-score is chosen as a reference test since it is the most commonly used and the only available method in resource-limited settings like Ethiopia(Reference de Onis, Onyango and Borghi18). Adolescents with height-for-age Z-score ≤ −2 sd were classified as Stunted(35).
Ten data collectors were trained for anthropometric measurements and have also participated in a standardisation exercise. The anthropometric measurers were made to take repeated measurements of ten adolescents. The interobserver technical errors of measurement for height (cm) is 0·21, weight (kg) is 0·21 and MUAC (cm) 0·12. Additionally, the coefficient of reliability was computed, and we found 97·9 % for height, 97·81 % for weight and 96·1 % for MUAC. All the technical errors of measurement compared with the reference value were within the acceptable range(Reference Ulijaszek and Kerr36).
Data analysis
The collected data were checked for completeness, coded and entered into EpiData v. 4.4.2.0 and exported to STATA v.16.0 for further statistical analysis. Categorical variables were summarised using frequency with percentages. Percentage with a 95 % CI was used to estimate the prevalence of thinness, severe thinness, normal weight, overweight and obesity. For continuous variables (MUAC, BMI Z-score and age), normality was checked using the Shapiro–Wilk normality test and visualised using Q–Q plots. Median with interquartile range was employed to summarise the characteristics of participants.
We found that the data have a deviation from normality for MUAC, BMI Z-score and age (P-value < 0·001). Hence, we performed a Spearman’s rank correlation to examine the strength of the linear relationship between MUAC, BMI Z-score and age with 95 % CI.
We computed the area under the receiver operating characteristic curve (discrimination) with 95 % CI and a calibration plot (calibration) to evaluate the accuracy of MUAC to identify thinness (BMI Z-score < −2 sd) among adolescents. The shape of the receiver operating characteristic curve and the AUC determines the discriminatory ability of the test. The AUC can have any value between 0 and 1 interpreted as: excellent (0·9–1), good (0·8–0·9), fair (0·7–0·8), poor (0·6–0·7) and fail (0·5–0·6)(Reference Swets37). To examine the variation in accuracy of MUAC across sexes, sub-group analysis was performed for males and females separately. MUAC value with the maximum Youden index (J = Sensitivity + Specificity − 1) was selected as the optimal cut-off(Reference Youden38). To evaluate the performance of MUAC at different cut-off points, we carried out a sensitivity analysis.
The discriminatory ability and predictive value of MUAC cut-off points against BMI Z-score ≤ −2 were assessed using sensitivity, specificity, positive predictive value (PPV), negative predictive value (NPV), positive and negative likelihood ratio with 95 % CI. Sensitivity is the proportion of true positive (adolescents classified as thin/severely thin by MUAC and BMI Z-score) among adolescents classified as thin/severely thin by BMI Z-score: TP/(TP + FN). Specificity is the proportion of true negative (adolescents classified as not thin by MUAC and BMI Z-score) among adolescents classified as not thin by BMI Z-score: TN/(TN + FP).
NPV tells us the proportion of adolescent girls who are not thin by the reference test (BMI Z-score) among adolescents identified as non-thin adolescents by MUAC: TN/(TN + FN). PPV tells us the proportion of adolescents identified as thin by BMI Z-score among adolescents categorised as thin by MUAC: TP/(TP + FP).
Negative likelihood ratio tells us how an adolescent without thinness/sever thinness based on BMI Z-score is more likely to be categorised as non-thin/severely thin by MUAC as compared with an adolescent with thinness/sever thinness on BMI Z-score: (1 − sensitivity)/specificity. Positive likelihood ratio tells us how much more likely the MUAC categorised thin/severely result is to occur in subjects with thinness/severely thinness compared with those without thinness and severe thinness: sensitivity/(1 – specificity).
This study is reported following the STARD (Standards for Reporting Diagnostic accuracy studies) 2015 statement(Reference Bossuyt, Reitsma and Bruns39), which includes a thirty-item checklist to give guidance for reporting (see supplementary material, Supplemental Table 1).
Results
Out of 877 adolescents who were approached 851 of them has participated in this study, resulting in a 97 % respondent rate. Twenty-six students were not included in the study due to the following reasons: twenty-one were absent on the scheduled day, five of them refused to remove their shoes and heavy clothes for measurement (Fig. 1).
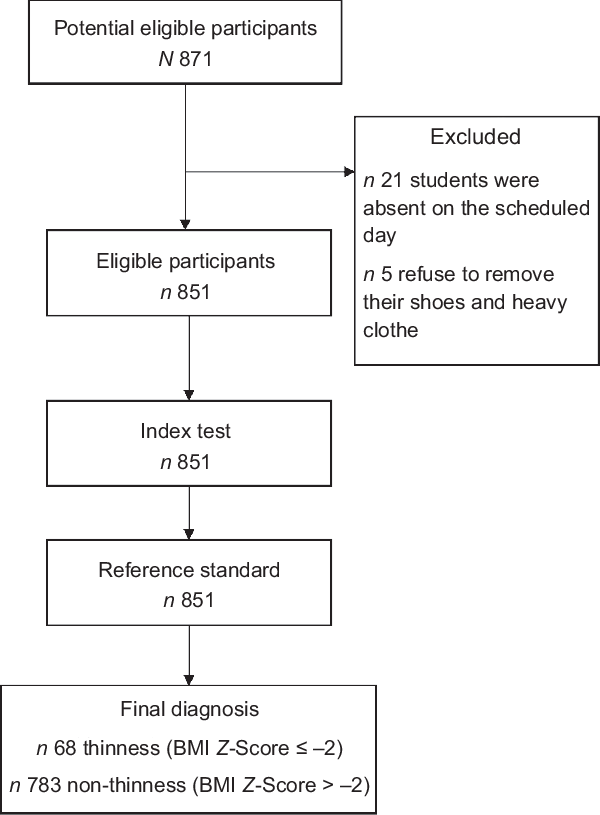
Fig. 1 The flow of participants through the study
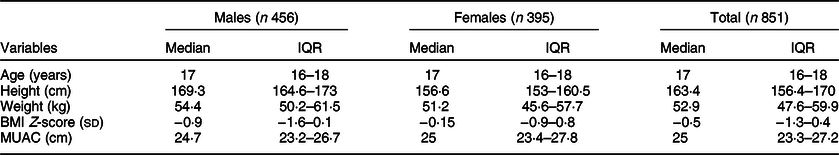
A total of 851 adolescents, 456 males and 395 females, participated in this study. The median and interquartile range of age, MUAC and BMI Z-score of the total participants were 17 (16–18) years, 25 (23·3–27·2) cm and −0·5 (−1·3–0·4) sd, respectively (Table 1).
Table 1 Characteristics of study participants stratified by sex (n 851)
Prevalence of thinness, severe thinness and stunting
The overall prevalence of thinness among adolescents in Addis Ababa was 7·8 % (95 % CI 6·2, 9·9), whereas the prevalence of severe thinness was 1·7 % (95 % CI 1·0, 2·8). The overall prevalence of thinness and severe thinness was 9·5 % (95 % CI 7·7, 11·7 %) (Fig. 2). The prevalence of thinness was much higher among adolescents attending public schools compared with adolescents attending private schools (10·0 % v. 5·1 %). The overall prevalence of stunting among adolescents in Addis Ababa was 9·6 % (95 % CI 7·8, 11·8).
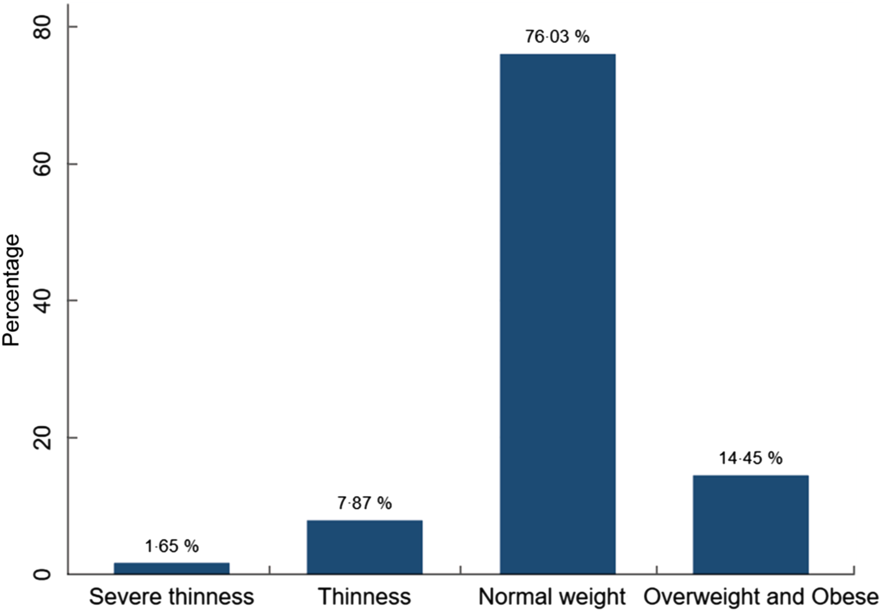
Fig. 2 Nutritional status of high-school adolescents in Addis Ababa, Ethiopia, 2019
Relationship between mid-upper arm circumference, BMI Z-score and age
We found a significant strong positive correlation between MUAC and BMI Z-score, r = 0·81 (95 % CI 0·79, 0·84). However, MUAC was weakly correlated with age, r = 0·15 (95 % CI 0·08, 0·21) (Figs 3 and 4).
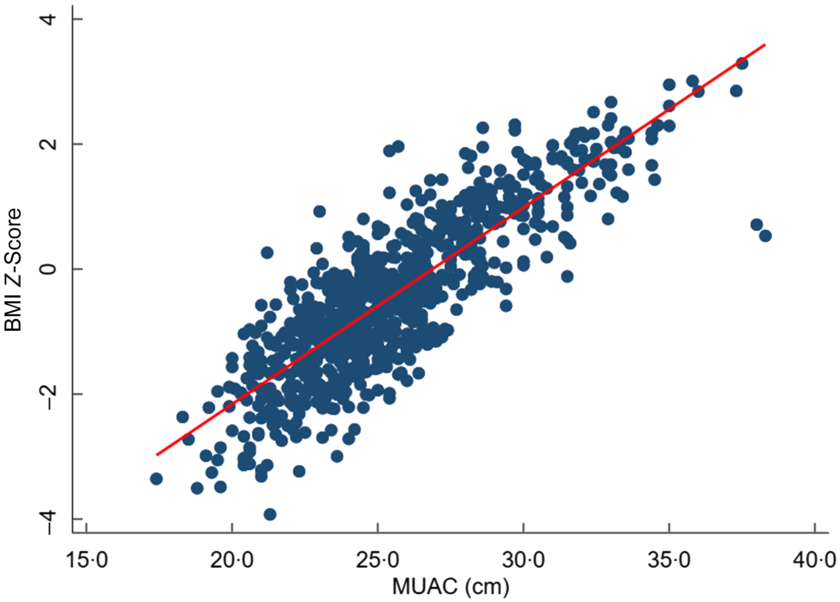
Fig. 3 Scatter plots showing the correlation between BMI Z-score and mid-upper arm circumference (MUAC)
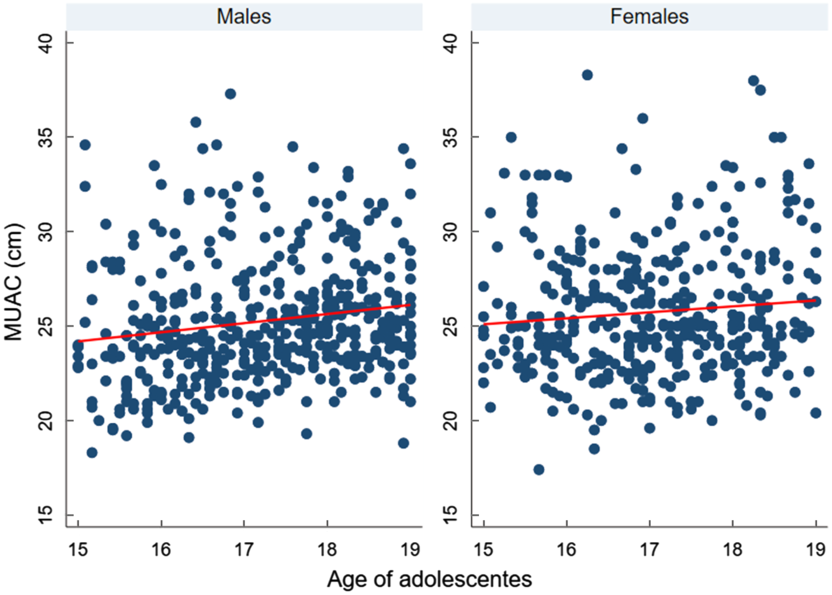
Fig. 4 Scatter plots showing the correlation between mid-upper arm circumference (MUAC) and age of adolescents, according to sex
Performance of mid-upper arm circumference to diagnose thinness
Overall, AUC for MUAC against our reference test (BMI Z-score < −2) was 0·91 (95 % CI 0·88, 0·93). The AUC was excellent for both males 0·90 (95 % CI 0·86, 0·93) and females 0·97 (95 % CI 0·95, 0·99) (Figs 5, 6 and 7).
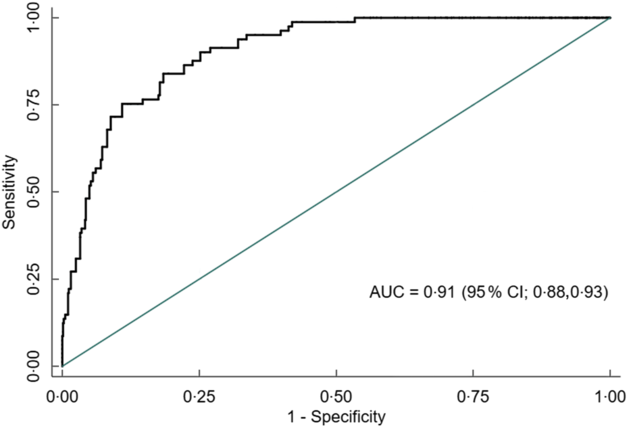
Fig. 5 Receiver operating characteristics curve showing performance of mid-upper arm circumference (MUAC) to identify thinness in adolescents (n 851)
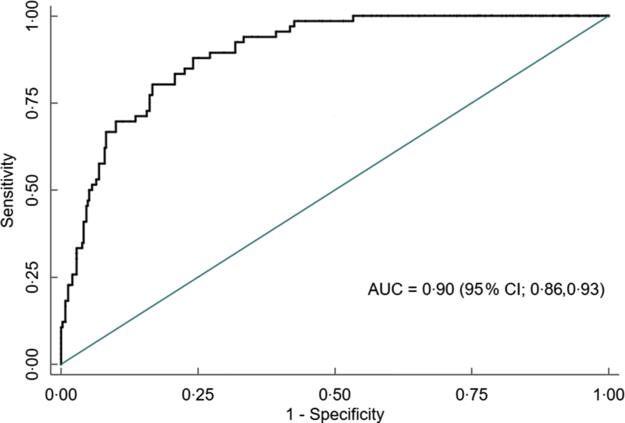
Fig. 6 Receiver operating characteristics curve showing performance of mid-upper arm circumference (MUAC) to identify thinness in adolescent males (n 456)
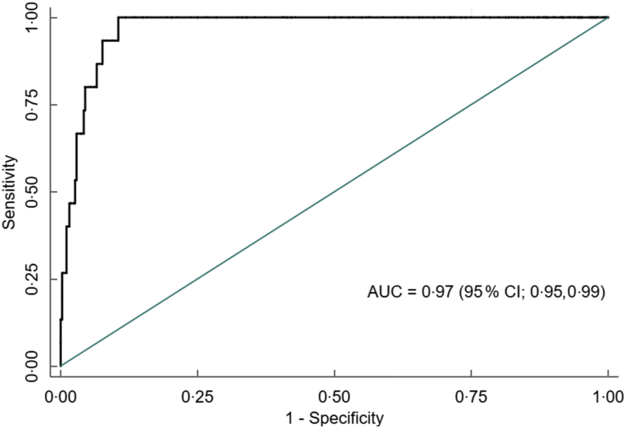
Fig. 7 Receiver operating characteristics curve showing performance of mid-upper arm circumference (MUAC) to identify thinness in adolescent females (n 395)
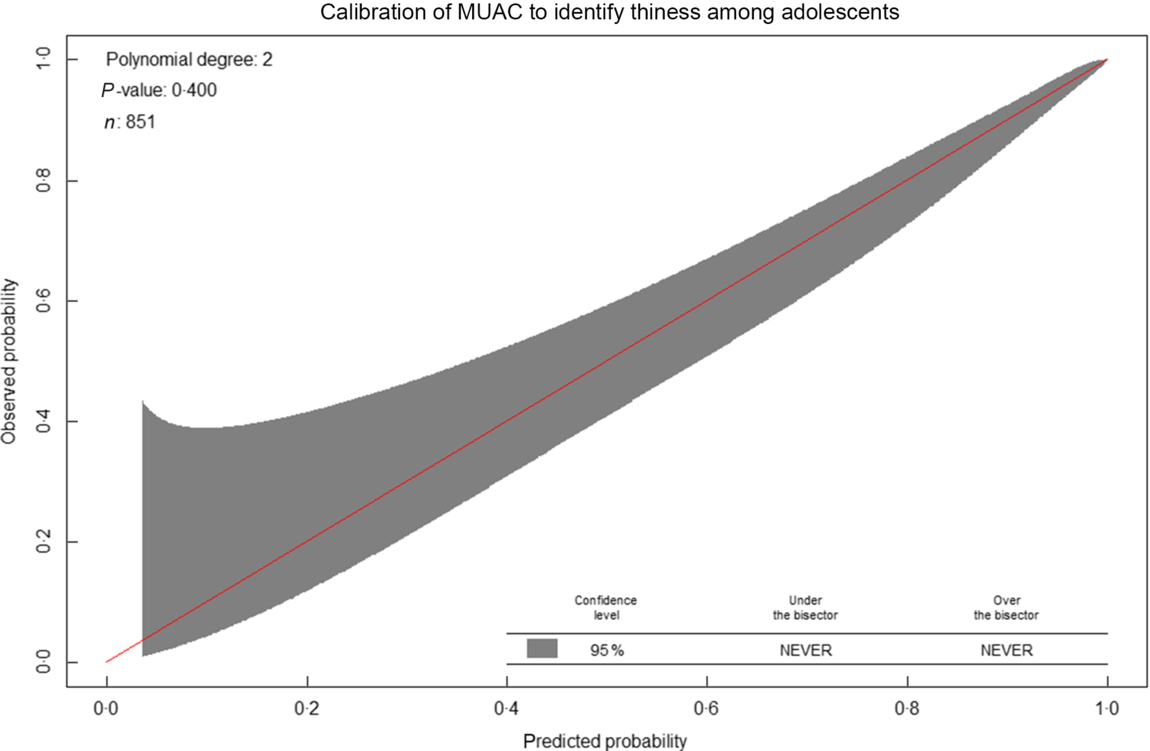
The calibration plot roughly indicates MUAC minimally underestimates thinness compared with BMI Z-score at a lower risk of thinness (approximately < 0·4). Whereas, at a higher risk probability (>0·4), the probabilities of thinness using MUAC are comparable with the probabilities using the BMI Z-score. Overall, the calibration was good, and the calibration test was not statistically significant (P-value = 0·40), indicating MUAC (Fig. 8).

Fig. 8 Calibration of mid-upper arm circumference (MUAC) to identify thinness among adolescents (n 851). Predicted probabilities refers to probabilities using MUAC, whereas observed indicates probabilities using the reference standard (BMI Z-score)
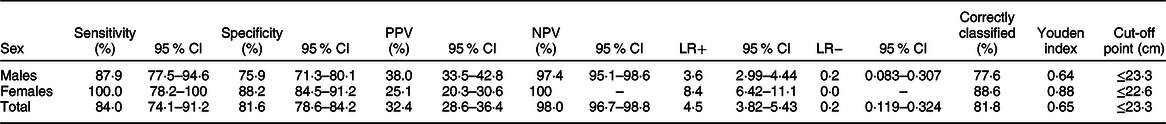
The optimal MUAC cut-offs, based on the Youden index, to identify thinness (BMI Z-score < −2 sd) were 23·3 cm for males and 22·6 cm for females. This cut-off point provides optimal sensitivity and specificity for both males and females (sensitivity 87·9 % and 100 %; specificity 75·9 % and 88·2 % respectively). Moreover, MUAC can correctly identify the majority of adolescents with or without thinness (77·63 % for males and 88·61 % for females). Detailed performance measures at different MUAC cut-offs are provided in Table 4 (Tables 2, 3 and 4). The screening test result for BMI Z-score defined thinness with MUAC among the adolescent males and females has been reported (see online supplementary material, Supplemental Table 2 and 3).
Table 2 Screening test result for BMI Z-score defined thinness with mid-upper arm circumference (MUAC) among the adolescents (n 851)
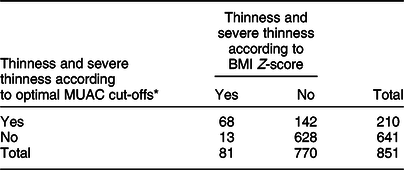
* Optimal cut-off will be estimated using the Youden index from our data.
Table 3 Sensitivity, specificity, positive predictive value (PPV), negative predictive value (NPV), positive likelihood ratio (LR+), negative likelihood ratio (LR−), correctly classified, Youden index and optimal cut-off points of mid-upper-arm circumference for detecting thinness among adolescents (n 851)
Discussion
In this study, we evaluated the performance of MUAC to identify thinness among adolescents aged 15–19 years in Ethiopia. We found MUAC can identify thinness among adolescents aged 15–19 years with excellent discriminatory performance (AUC 0·91). Furthermore, the study showed that the optimum MUAC cut-off point to identify thinness is ≤23·3 cm for males with a sensitivity of 87·9 % and specificity of 75·9 %, whereas the optimum MUAC cut-off point for females is ≤22·6 cm with a sensitivity of 100 % and specificity of 88·2 %.
MUAC has an excellent performance with AUC 0·90 and 0·97 for males and females, indicating that it has an accurate ability to identify adolescents with or without thinness. This finding is supported by a study done on Indian adolescents (10–19 years) comparing MUAC with BMI Z-score ≤ −2 sd, reported an AUC value range 0·84–0·94 depending on the age(Reference Sethi, Gupta and Pedgaonkar29). In contrast, another study reported poor performance of MUAC (AUC 0·6) as compared with BMI < 5th percentile(Reference Dasgupta, Butt and Saha21). This inconsistency might be due to the difference in the reference used to compare with MUAC; our study reference was BMI Z-score <−2, whereas the above-stated study uses BMI < 5th percentile as a reference value.
At the optimal cut-off point, MUAC has an acceptable level of sensitivity and specificity. For the total sample based on the optimum cut-off point, MUAC has a sensitivity of 84·0%; this indicates among thin adolescents using BMI Z-score, 84·0% of them were also diagnosed as thin using MUAC. The specificity of MUAC for the overall sample is 81·6%, which indicates among all adolescents who are not thin, also 81·6% of adolescents are classified as not thin/severely thin using MUAC. A similar study conducted on adolescent girls comparing the performance of MUAC with BMI Z-score to identify thinness (BMI Z-score ≤ −2) also reported high sensitivity (77·9–87·3 %) and specificity (71·1–93·9 %) for each age(Reference Sethi, Gupta and Pedgaonkar29). However, a study done on adolescent girls evaluated the performance of MUAC compared with BMI below the 5th percentile report high sensitivity and much lower specificity(Reference Jeyakumar, Ghugre and Gadhave17). This inconsistency might be due to the difference in the reference values used between this study (BMI Z-score < −2) and the above-stated study (BMI below 5th).
Based on the proposed cut-off point for the total sample (≤23·3 cm), MUAC has a high NPV (98·0%) and lower PPV (32·4 %). The PPV indicates that among those adolescents who identified as thin by MUAC, only 32·4% were thin by BMI Z-score. Whereas the NPV indicates that among those adolescents who identified as non-thin by MUAC, 98·0% were thin (including severe thinness) by BMI Z-score. Similar findings were reported in a study conducted among female late adolescents comparing the performance of MUAC with BMI Z-score ≤ −2 with a cut-off point of ≤ 21·6 cm high NPV (97·8 %) and lower PPV (40·0 %)(Reference Sethi, Gupta and Pedgaonkar29). This low PPV and high NPV might be due to the relatively low prevalence of thinness among adolescents. Predictive values are largely dependent on the prevalence of the condition/disease in the population. A positive test is more likely to be a true positive case when the prevalence is high but maybe more likely to be a false-positive non-case when the prevalence is low(Reference Šimundić40). Thus, the predictive value of one study should not be compared with other findings with different prevalence of disease/condition(Reference Eusebi41).
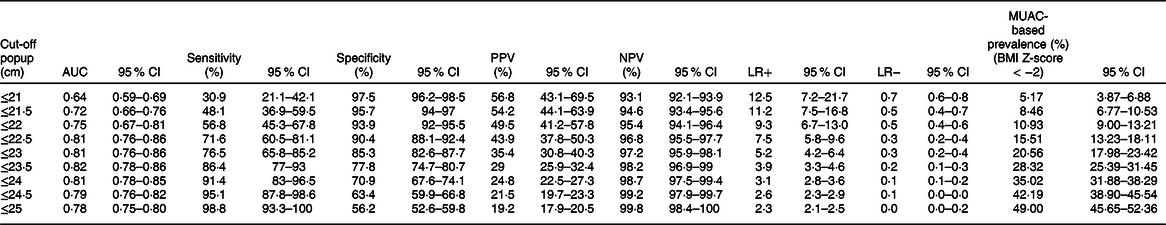
If these cut-off points are used to screen and prioritise large numbers of adolescents for special nutritional support in the context of routine practice or emergency situations, such as famine. Due to the low PPV, a large number of false-positive adolescents would be incorrectly considered to be thin, leading to unnecessary nutritional support/treatment, poor use of resources and overburden health care system. In order to correct this problem, it would be necessary to choose a cut-off with greater PPV, for example, ≤ 21 cm (Table 4); this reduces the number of adolescents that are incorrectly classified as thin by MUAC, though programmers and policymakers shall decide the optimal MUAC cut-off after considering the available resources(Reference Tang, Chung and Dong28).
Table 4 Sensitivity analysis: sensitivity, specificity, positive predictive value (PPV), negative predictive value (NPV), positive likelihood ratio (LR+), negative likelihood ratio (LR−) and MUAC-based prevalence (%) (BMI Z-score < −2) for different cut-off points of mid-upper-arm circumference (MUAC) in detecting thinness among adolescents (n 851)
MUAC has a positive likelihood ratio of 4·5 for a total sample; this indicates that an adolescent with thinness is 4·5 times more likely to have MUAC ≤ 23·3 cm than an adolescent without thinness (BMI Z-score < −2). MUAC has a negative likelihood ratio of 0·20 for a total sample; this implies that an adolescent without thinness is about 5-fold more likely to have MUAC > 23·3 cm than an adolescent without thinness (BMI Z-score > −2). This indicates that MUAC is a good indicator for ruling in and ruling out thinness among adolescents. These findings are consistent with the study conducted among adolescents aged 10–19 years old(Reference Dasgupta, Butt and Saha42).
In this study, a MUAC of ≤23·3 cm for males and ≤22·6 for females was found to be the optimum cut-off points to identify thinness among late adolescents. The study conducted in India indicated that the optimal cut-off among female adolescents was ≤21·6 cm(Reference Sethi, Gupta and Pedgaonkar29). However, cut-off points in our study are slightly higher than the previous study determined. This might be due to the racial difference in body size and fat distribution according to ethnic group(Reference Freedman, Wang and Thornton31).
In this study, MUAC had a weak positive correlation with age. This indicates that MUAC slightly increases with the age of adolescents; as a result, age-specific cut-off points might be necessary. A study done among female adolescents determines age-specific cut-off points showing a wide variation, for instance, the cut-off at 10 years was ≤17·7, whereas for 14 years was ≤20·6 cm, having a wide variation of 2·9 cm(Reference Sethi, Gupta and Pedgaonkar29). Therefore, this study proposes age- and sex-specific cut-off points.
BMI Z-score has a limitation in identifying adolescents with thinness. Stunting impacts the estimates of BMI Z-score leading to underestimation of thinness; the mean BMI Z-score may appear better in stunted populations than that might be in a population with better heights(Reference Bhargava, Bhargava and Ghate43). In our study, 7·8 % of adolescents are stunted; BMI Z-Score might be misclassifying this adolescents and underestimate thinness. Furthermore, MUAC might have a better performance than BMI Z-Score; however, as we did not compare to the third reference standard, we cannot be sure whether MUAC or Z-Score is misclassifying adolescents.
Strength and limitations
This study has several strengths and limitations that are worth mentioning. The main strength of this study was the application of quality control and monitoring methods during anthropometric data collection. This helped to minimise measurement errors and ensure the validity and precision of anthropometric measurements. However, this finding should be interpreted in the context of the following limitations. It was not possible to determine age and sex-specific cut-off points, determine cut-off points for severe thinness and calculate the diagnostic measures of accuracy, due to the relatively small sample size.
Conclusion
In conclusion, compared with BMI Z-score, MUAC can accurately identify thinness in adolescents between 15 and 19 years old. Hence, MUAC could be used as an alternative tool for surveillance and screening of thinness in adolescents aged 15–19 years in Ethiopia. When our optimal cut-off points are used in population with relatively healthy/well-nourished adolescents, it may classify incorrectly large number adolescents as thin. In this situation, it would be necessary to choose a cut-off with greater PPV. Further study should evaluate the validity of MUAC to identify thinness and severe thinness in a representative sample of school-aged children and early adolescents is recommended.
Acknowledgements
Acknowledgements: We are very much thankful to all study participants for their willingness to participate in the study. Financial support: This research received no specific grant from any funding agency, commercial or not-for-profit sectors. Conflict of interest: There are no conflicts of interest. Authorship: B.G.S. has conceived the study, designing the study, carrying it out, analysing the data and writing the first draft of the article. S.H.G., D.H. and H.Y.H. were involved in formulating a research question and critical revision of the manuscript. H.Y.H. was also involved in the data analysis. All authors read and approved the final manuscript. Ethics of human subject participation: This study was conducted according to the guidelines laid down in the Declaration of Helsinki, and all procedures involving study participants were approved by the ethical review board of Addis Ababa University. Written informed consent was obtained from all subjects greater than or 18 years old and from parents/guardians of those under 18 years.
Supplementary material
For supplementary material accompanying this paper visit https://doi.org/10.1017/S1368980020003869