


Introduction
Global warming causes alterations in climate due to the natural and anthropogenic activities (IPCC, 2007) which are major contributors to increasing levels of greenhouse gases (GHGs) in the atmosphere. These high levels of GHGs in the atmosphere trap the outgoing longwave radiations thereby causing an increase in the overall earth's temperature (Brown, Reference Brown Stephen1998). By the end of 21st century, the concentration of GHGs is expected to increase about three times the preindustrial period causing a 3–10°C rise in temperatures (Tisdell, Reference Tisdell2008). This is a matter of deep concern as there are many reported evidences of alterations in the weather patterns induced by increased levels of GHGs during the 20th century (Meehl et al., Reference Meehl, Washington, Collins, Arblaster, Hu, Buja, Strand and Teng2005; Hegerl et al., Reference Hegerl, Zwiers, Braconnot, Gillet, Luo, Marengo, Nicholls, Penner, Stott, Solomon, Qin, Manning, Chen, Marquis, Averyt, Tignor and Miller2007). The simulations of the 21st century for four representative concentration pathways (RCPs) (Taylor et al., Reference Taylor, Stouffer and Meehl2012) and projections from 2100 to 2300 for their extensions (van Vuuren et al., Reference van Vuuren, Stehfest, den Elzen, Kram, van Vliet, Deetman, Isaac, Goldewijk, Hof, Beltran, Oostenrijk and van Ruijven2011) have been included in Coupled Model Inter-comparison Project phase 5 (CMIP5). However, the challenges still remain in understanding the interactions between the climate change, feedbacks from the atmospheric chemistry and transport processes in the atmosphere. The 21st century RCP scenarios cover a wide range of factors in making predictions and help understand the impact of anthropogenic forcings and the climate system which has been simulated using different model representations (Nazarenko et al., Reference Nazarenko, Schmidt, Miller, Tausnev, Kelley, Ruedy, Russell, Aleinov, Bauer, Bauer, Bleck, Canuto, Cheng, Clune, Del Genio, Faluvegi, Hansen, Healy, Kiang, Koch, Lacis, LeGrande, Lerner, Lo, Menon, Oinas, Perlwitz, Puma, Rind, Romanou, Sato, Shindell, Sun, Tsigardis, Unger, Voulgarkis, Yao and Zhang2015). However, Schmidt et al. (Reference Schmidt, Shindell and Tsigaridis2014) reported that these future simulations of meteorological parameters depend on the climate model and how it reproduces the information provided for preindustrial, historical and current processes.
Wheat is the staple food for the majority of the Indian population, and the country is the second largest producer in the world, contributing 13% to the global wheat supply (Zaveri and Lobell, Reference Zaveri and Lobell2019). It is highly sensitive to temperature increase; Lobell et al. (Reference Lobell, Schlenker and Costa-Roberts2011) have reported a 5.5% decrease in wheat yield during the past 30 years (1980–2010) due to a decadal temperature increase of 0.13°C. With further predicted rise in temperatures, many studies have reported a decline in wheat production in the world (Asseng et al., Reference Asseng, Ewert, Martre, Rötter, Lobell, Cammarano, Kimball, Ottman, Wall, White, Reynolds, Alderman, Prasad, Aggarwal, Anothai, Basso, Biernath, Challinor, De Sanctis, Doltra, Fereres, Garcia-Vila, Gayler, Hoogenboom, Hunt, Izaurralde, Jabloun, Jones, Kersebaum, Koehler, Müller, Naresh Kumar, Nendel, Leary, Olesen, Palosuo, Priesack, Eyshi Rezaei, Ruane, Semenov, Shcherbak, Stöckle, Stratonovitch, Streck, Supit, Tao, Thorburn, Waha, Wang, Wallach, Wolf, Zhao and Zhu2015) and in various countries like Egypt (Mohammad Ali et al., Reference Mohammad Ali, Ibrahim, El Baroudy, Fullen, Omar El-Said, Ding and Saad Kheir2020), Iran (Eyshi Rezaie and Bannayan, Reference Eyshi Rezaie and Bannayan2012; Paymard et al., Reference Paymard, Yaghoubi, Nouri and Bannayan2019), Russia and India (Zhao et al., Reference Zhao, Liu, Piao, Wang, Lobell, Huang, Huang, Yao, Bassu, Ciais, Durand, Elliott, Ewert, Janssens, Li, Lin, Liu, Martre, Müller, Peng, Peñuelas, Ruane, Wallach, Wang, Wu, Liu, Zhu, Zhu and Asseng2017). These studies have mainly used climate model projections as input in crop simulation models or statistical crop models which help in assessing the climate change impact on global and regional crop productivity. These impacts have led to experiments on adaptation measures which would be able to minimize the climate change effects. The adaptations can be done by taking various agronomic measures such as changing planting dates, choice of crop cultivars, crop rotations, irrigation, fertilization and tillage practices.
Global circulation models (GCMs) provide accurate predictions for future climate change and these data can be efficiently used in crop simulation models to analyse the climate change impact and what optimization can be taken into account under future conditions to recover yield losses. The increasing concentration of GHGs leads to changes in the climatic factors under the future scenarios (Aggarwal, Reference Aggarwal2003) which is a cause of concern as these changes directly or indirectly impact the food production systems (Krupa, Reference Krupa2003). Thus, these concerns have been taken into account by the policy makers and researchers (Mall et al., Reference Mall, Singh, Gupta, Srinivasan and Rathore2006; Lobell et al., Reference Lobell, Schlenker and Costa-Roberts2011) as they threaten food security of developing countries like India where climate is the major factor affecting agricultural production (Kumar and Parikh, Reference Kumar and Parikh2001; Dubey and Sharma, Reference Dubey and Sharma2018). These problems are inherent in Indian conditions where majority of population depends on rainfed agriculture (Mendelsohn et al., Reference Mendelsohn, Dinar and Williams2006) which has less adaptive capacity and technological advancement (Birthal et al., Reference Birthal, Khan, Negi and Agarwal2014). The lower crop yield in India maybe attributed to aberrant rainfall conditions and lack of irrigation facilities (Pal and Mitra, Reference Pal and Mitra2018) on which 48% of the cultivated area depends (Government of India, 2013). In the last few decades, India has observed a temperature upsurge of 0.3–0.8°C per decade (Goswami et al., Reference Goswami, Venugopal, Sengupta, Madhusoodanan and Xavier2006) and during 2100 the temperature is projected to rise by 2–4°C with higher and erratic rainfall during rainy season (Kumar, Reference Kumar2009). Chaturvedi et al. (Reference Chaturvedi, Joshi, Jayaraman, Bala and Ravindranath2012) reported an increase in projected rainfall by 6–14% during the end century (2080) with increased intensity and skewed distribution.
In India, wheat is grown during winter season with its sowing commencing in November and harvesting completed in April. Since 85% of the wheat cultivated area is irrigated, rainfall does not significantly impact the grain yield. However, an increase in temperature supplemented by increase in CO2 concentrations leads to an increase in straw yield, leaf area duration, number of ears/m2 and kernel weight (Mohsen and Yamada, Reference Mohsen and Yamada1991; Rawson, Reference Rawson1995; Pleijel et al., Reference Pleijel, Gelang, Sild, Danielsson, Younis, Karlsson, Wallin, Skärby and Selldén2000; Wang et al., Reference Wang, Cai, Jiang, Liu, Dai and Cao2011). Many studies have reported that wheat crop is extremely sensitive to temperatures above 34°C since it causes accelerated senescence (Ferris et al., Reference Ferris, Ellis, Wheeler and Hadley1998; Asseng et al., Reference Asseng, Foster and Turner2011; Lobell et al., Reference Lobell, Schlenker and Costa-Roberts2011). The entire growth period of wheat crop requires an optimum temperature of 17–23°C with maximum temperatures not higher than 37°C (Porter and Gawith, Reference Porter and Gawith1999). As per the IPCC (2007), the minimum temperature is expected to increase by 0.5°C during winters which would decrease wheat productivity in India by 0.45 tons/ha (Easterling et al., Reference Easterling, Aggarwal, Batima, Brander, Erda, Howden, Kirilenko, Morton, Soussana, Schmidhuber, Tubiello, Parry, Canziani, Palutikof, van der Linden and Hanson2007). Under future climatic scenarios of India, Guiteras (Reference Guiteras2009) reported reduction in wheat yield by 4–9% during the early century (2010–2039) and by 25% during the late century (2070–2099) without any adaptation measures. Lianga et al. (Reference Lianga, Lia, Zhang, Sun, Sund, Duand, Xud and Wue2018) used SPACSYS model to simulate wheat yield under different climate change scenarios (RCP 2.6, RCP 4.5, RCP 6.0 and RCP 8.5) of northern China and observed a decline in average wheat yield by 3.8% in comparison to the baseline. Daloz et al. (Reference Daloz, Rydsaa, Hodnebrog, Sillmann, van Oort, Mohr, Agrawal, Emberson, Stordal and Zhang2021) used regional climate model (Weather Research and Forecasting model) to simulate climate change impact on wheat yield in the Indo-Gangetic region (Punjab, Haryana, Uttar Pradesh and Bihar) and reported yield losses between 1 and 8% with climate change alone while these losses increased under the RCP 8.5 when limitations on irrigation amount were analysed. The long dry spells just after early planting (Stern et al., Reference Stern, Dennett and Dale1982; Sivakumar, Reference Sivakumar1988) cause crop failure but late planting results in shorter growing season which leads to reduced crop productivity (Laux et al., Reference Laux, Kunstmann and B́ardossy2008). The decision when to plant is a challenging task for the farmers as it affects cost of inputs and perceived economic losses due to climate hazards.
The above review emphasized the fact that climatic factors have a direct adverse impact on crop productivity causing significant loss to the food production. However, significant differences have been reported on regional basis which highlight the need for regional studies to be carried out especially in a climatically diverse variable and populous country like India. Though many beneficial technologies have been introduced to nullify the climate change impact but these technologies might be a failure itself or a failure in their delivery mechanisms (Cooper et al., Reference Cooper, Dimes, Rao, Shapiro, Shiferawa and Twomlow2008; Renkow and Byerlee, Reference Renkow and Byerlee2010). As these technologies are region specific, the regional prejudice is the major issue that should be taken into consideration while framing suitable farming practices to mitigate climate change (Antwi-Agyei et al., Reference Antwi-Agyei, Dougill and Stringer2013).
A regional study on projected climate changes by Prabhjyot-Kaur et al. (Reference Prabhjyot-Kaur, Sandhu, Kaur, Singh and Dhir2020) has reported changes in temperature during wheat season in Punjab. They concluded an increase in maximum temperature during the wheat season from the baseline (25.0°C) by 0.5 (RCP 2.6), 0.8(RCP 4.5), 0.5 (RCP 6.0) and 1.0°C (RCP 8.5) during 2020–2049 but a decrease by −1.6(RCP 2.6), −0.3(RCP 4.5) and −0.1(RCP 6.0) and increase by 1.0°C (RCP 8.5) during 2066–2095. On the other hand, minimum temperature was predicted to increase from the baseline (10.0°C) by 2.5 (RCP 2.6), 2.9 (RCP 4.5), 2.5 (RCP 6.0) and 3.1°C (RCP 8.5) during 2020–2049 and by 2.7(RCP 2.6), 4.0 (RCP 4.5), 4.2(RCP 6.0) and 6.4°C (RCP 8.5) during 2066–2095. This would imply a decline in the diurnal range of temperature which is not favourable for net photosynthetic accumulation. Hence it becomes imperative to evaluate the effect of these climatic changes on wheat crop in Punjab state of India. So the present study investigated the adaptation strategies/suitable management practices (sowing dates, cultivars and nitrogen management) for wheat crop under future climatic conditions of the four agroclimatic zones (ACZs) in Punjab state under four RCPs scenarios (RCP 2.6, 4.5, 6.0 and 8.5).
Material and methods
Study area
The study area, the state of Punjab lies in the north-western India and has a latitudinal and longitudinal extent of 29033” to 32034”N and 73053” to 76056”E, respectively (Fig. 1). The state is subdivided into six ACZs, i.e. north eastern regions (ACZ I and II) having sub-mountain and undulating plain region (covering 18.5% of available land area and having rainfall >800–900 mm), central and western plain region (ACZ III and IV – covering 55% of available land area and having rainfall 500–800 mm) and south western region (ACZ V – covering 20% of available land area and with rainfall <200 mm). The sixth ACZ comprises of flood plain region for four major rivers (Ghaggar, Sutlej, Beas and Ravi) with a land area of 7% (Anonymous, 2021). In the present study, four ACZs of Punjab encompassing seven locations were considered for the study which covers the major wheat-growing areas of the state. These zones were ACZII (Ballowal Saunkhri), ACZIII (Ludhiana, Amritsar and Patiala), ACZIV (Bathinda) and ACZV (Abohar and Faridkot) where the average baseline yield of wheat was simulated as 4528, 4548, 3360 and 4611 kg/ha, respectively. The average maximum/minimum temperature and rainfall during the wheat season respectively at Ballowal Saunkhri are 25.6/10.0°C and 159 mm, Ludhiana 24.6/10.0°C and 126 mm, Amritsar 24.9/8.4°C and 144 mm, Patiala 25.4/11.1°C and 125 mm, Bathinda 25.8/9.9°C and 90 mm, Abohar 24.6/11.0°C and 68 mm and at Faridkot are 24.5/13.7°C and 87 mm (Prabhjyot-Kaur et al., Reference Prabhjyot-Kaur, Sandhu, Singh, Kaur, Singh and Kaur2016). Amongst the four ACZs, the highest maximum (25.8°C) and minimum (13.7°C) temperatures are reported for ACZIV (Bathinda) and ACZV (Faridkot), respectively. Currently, the sowing of wheat crop starts from last week October and extends up to mid-December. However, first fortnight of November is considered as optimum sowing period for wheat in Punjab state.
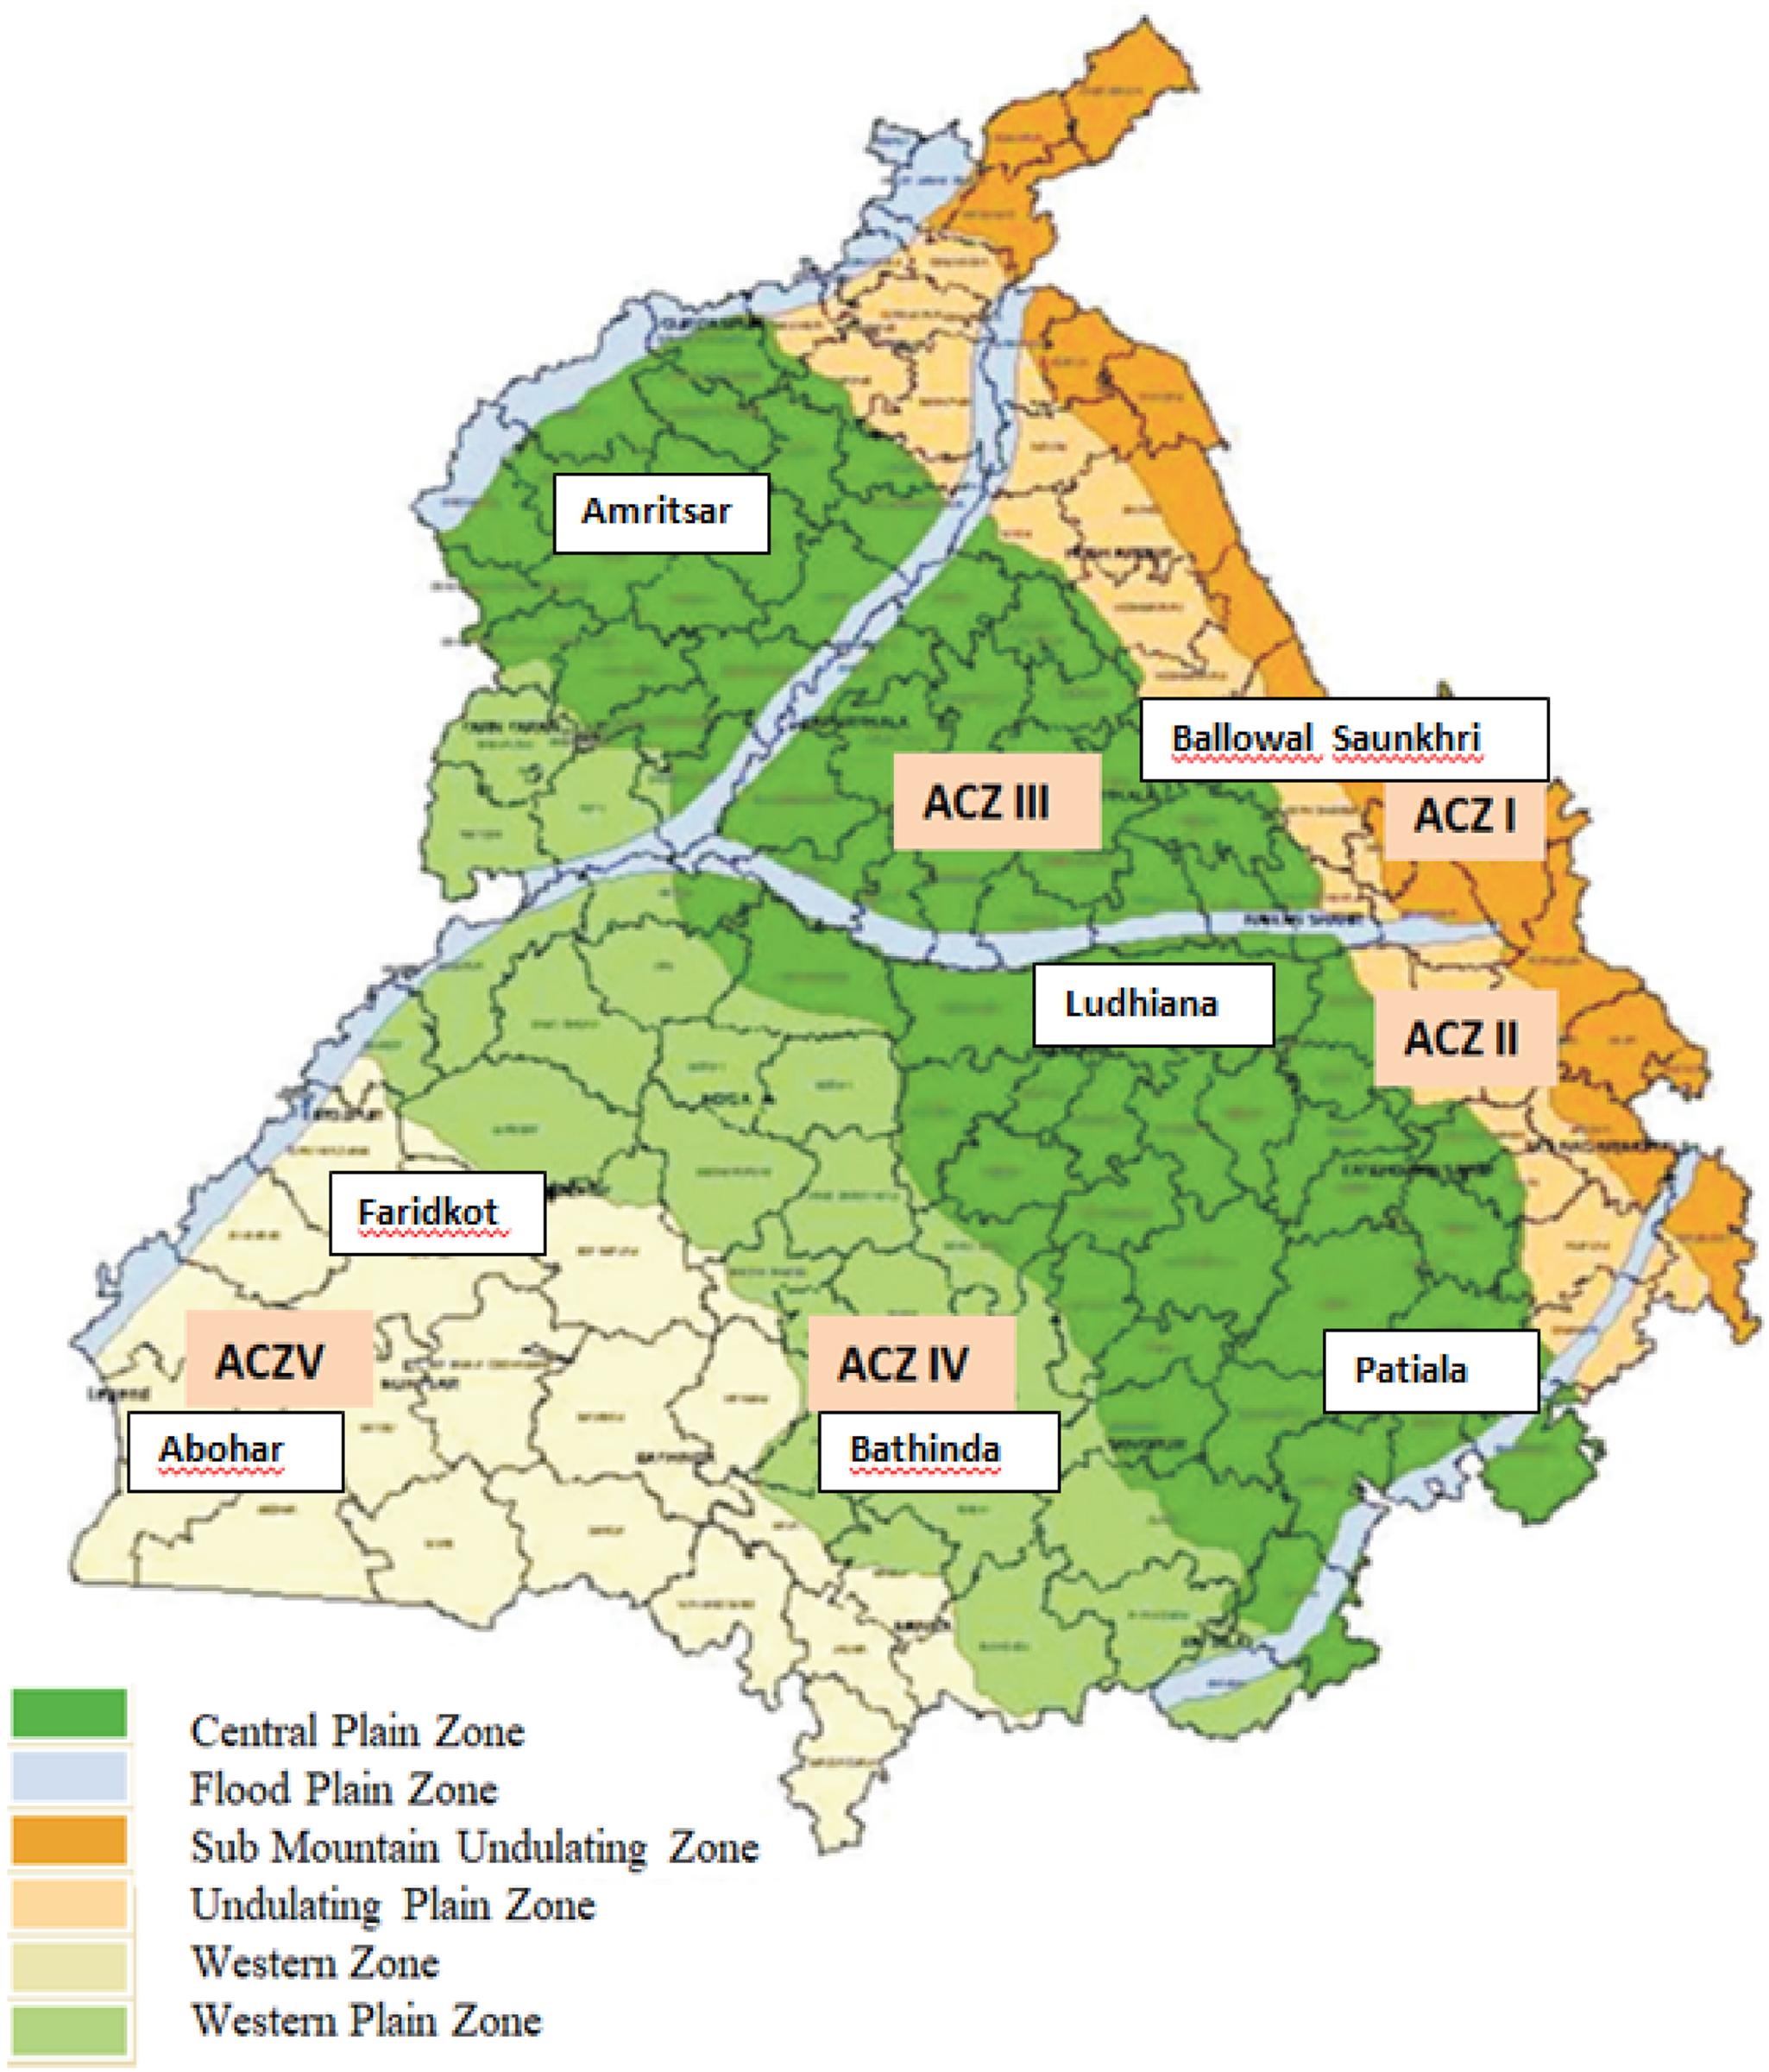
Figure 1. Location map of study area.
Crop modelling
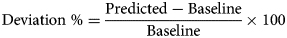
The temperature and rainfall data as projected by the Ensemble model were downloaded (http://gismap.ciat.cgiar.org/MarkSimGCM/) and bias corrected as per procedures described by Kaur et al. (Reference Kaur, Prabhjyot-Kaur and Kaur2020) for the four emission-based scenarios (RCPs 2.6, 4.5, 6.0 and 8.5). The bias-corrected weather parameters from 2030 to 2090 were used as input to the calibrated and evaluated (Prabhjyot-Kaur et al., Reference Prabhjyot-Kaur, Sandhu, Kothiyal and Kaur2022) CERES-Wheat model embedded in the Decision Support System for Agrotechnology Transfer (DSSAT V 4.7.5) (Hoogenboom et al., Reference Hoogenboom, Porter, Boote, Shelia, Wilkens, Singh, White, Asseng, Lizaso, Moreno, Pavan, Ogoshi, Hunt, Tsuji, Jones and Boote2019), to simulate crop yield for two commonly sown high-yielding wheat cultivars HD2967 (plant height 101 cm matures in 157 days with average yield of 5350 kg/ha) and PBW725 (plant height 105 cm matures in 154 days with average yield of 5725 kg/ha). The model was run for baseline period of 11 years (2010–2021) considering optimized sowing date (24 November) and currently recommended nitrogen dose (125 kg/ha) to simulate the baseline crop duration and yield. During the baseline period simulations, the model was run with the actual carbon dioxide data recorded at the Mauna Loa, Hawaii observatory. But when the wheat yield was simulated under four RCP scenarios, the additional fertilization effect of carbon dioxide was not considered in the study. The per cent deviations in yield (Eqn 1) and growth duration (Eqn 2) of wheat cultivars for the three future time slices; 2030–2050: early century (EC), 2050–2070: mid-century (MC) and 2070–90: late century (LC) for optimized sowing date and different doses of nitrogen application (150, 190 and 230 kg/ha) were assessed from the baseline as:

Results
Agroclimatic zone II (Ballowal Saunkhri)
At Ballowal Saunkhri, the optimized sowing date for the cultivars HD2967 and PBW725 was 24 November where higher yield with supplemented N doses was simulated than the baseline yield under the four RCP scenarios during the three time slices though the days to maturity decreased by 22–34 days.
The yield of cv. HD2967 increased from the baseline (4663 kg/ha) with optimized sowing date under the RCPs 2.6, 4.5 and 6.0 scenarios during EC by 9, 10 and 10%, respectively, MC by 11, 10 and 11%, respectively and LC by 10, 8 and 8%, respectively. When the optimized sowing date was supplemented with three N doses, the yield of cv. HD2967 for the three scenarios increased during EC by 16–29, 18–30 and 20–31%, respectively, MC by 19–32, 17–29 and 19–32%, respectively and LC by 18–30, 15–28 and 16–29%, respectively (Fig. 2). Similarly, the yield of cv. PBW725 increased from the baseline (4393 kg/ha) with optimized sowing dates under the RCP 2.6, 4.5 and 6.0 scenarios during EC by 9, 10 and 10%, respectively, MC by 9, 9 and 8%, respectively and LC by 7, 7 and 4%, respectively. When the optimized sowing date was supplemented with three N doses, then the increase in yield of cv. PBW725 for the three scenarios during EC ranged from 18 to 33, 19 to 30 and 19 to 31%, respectively, MC by 18 to 30, 17 to 30 and 18 to 31%, respectively and LC by 16 to 32, 15 to 28 and 14 to 28%, respectively (Fig. 3).
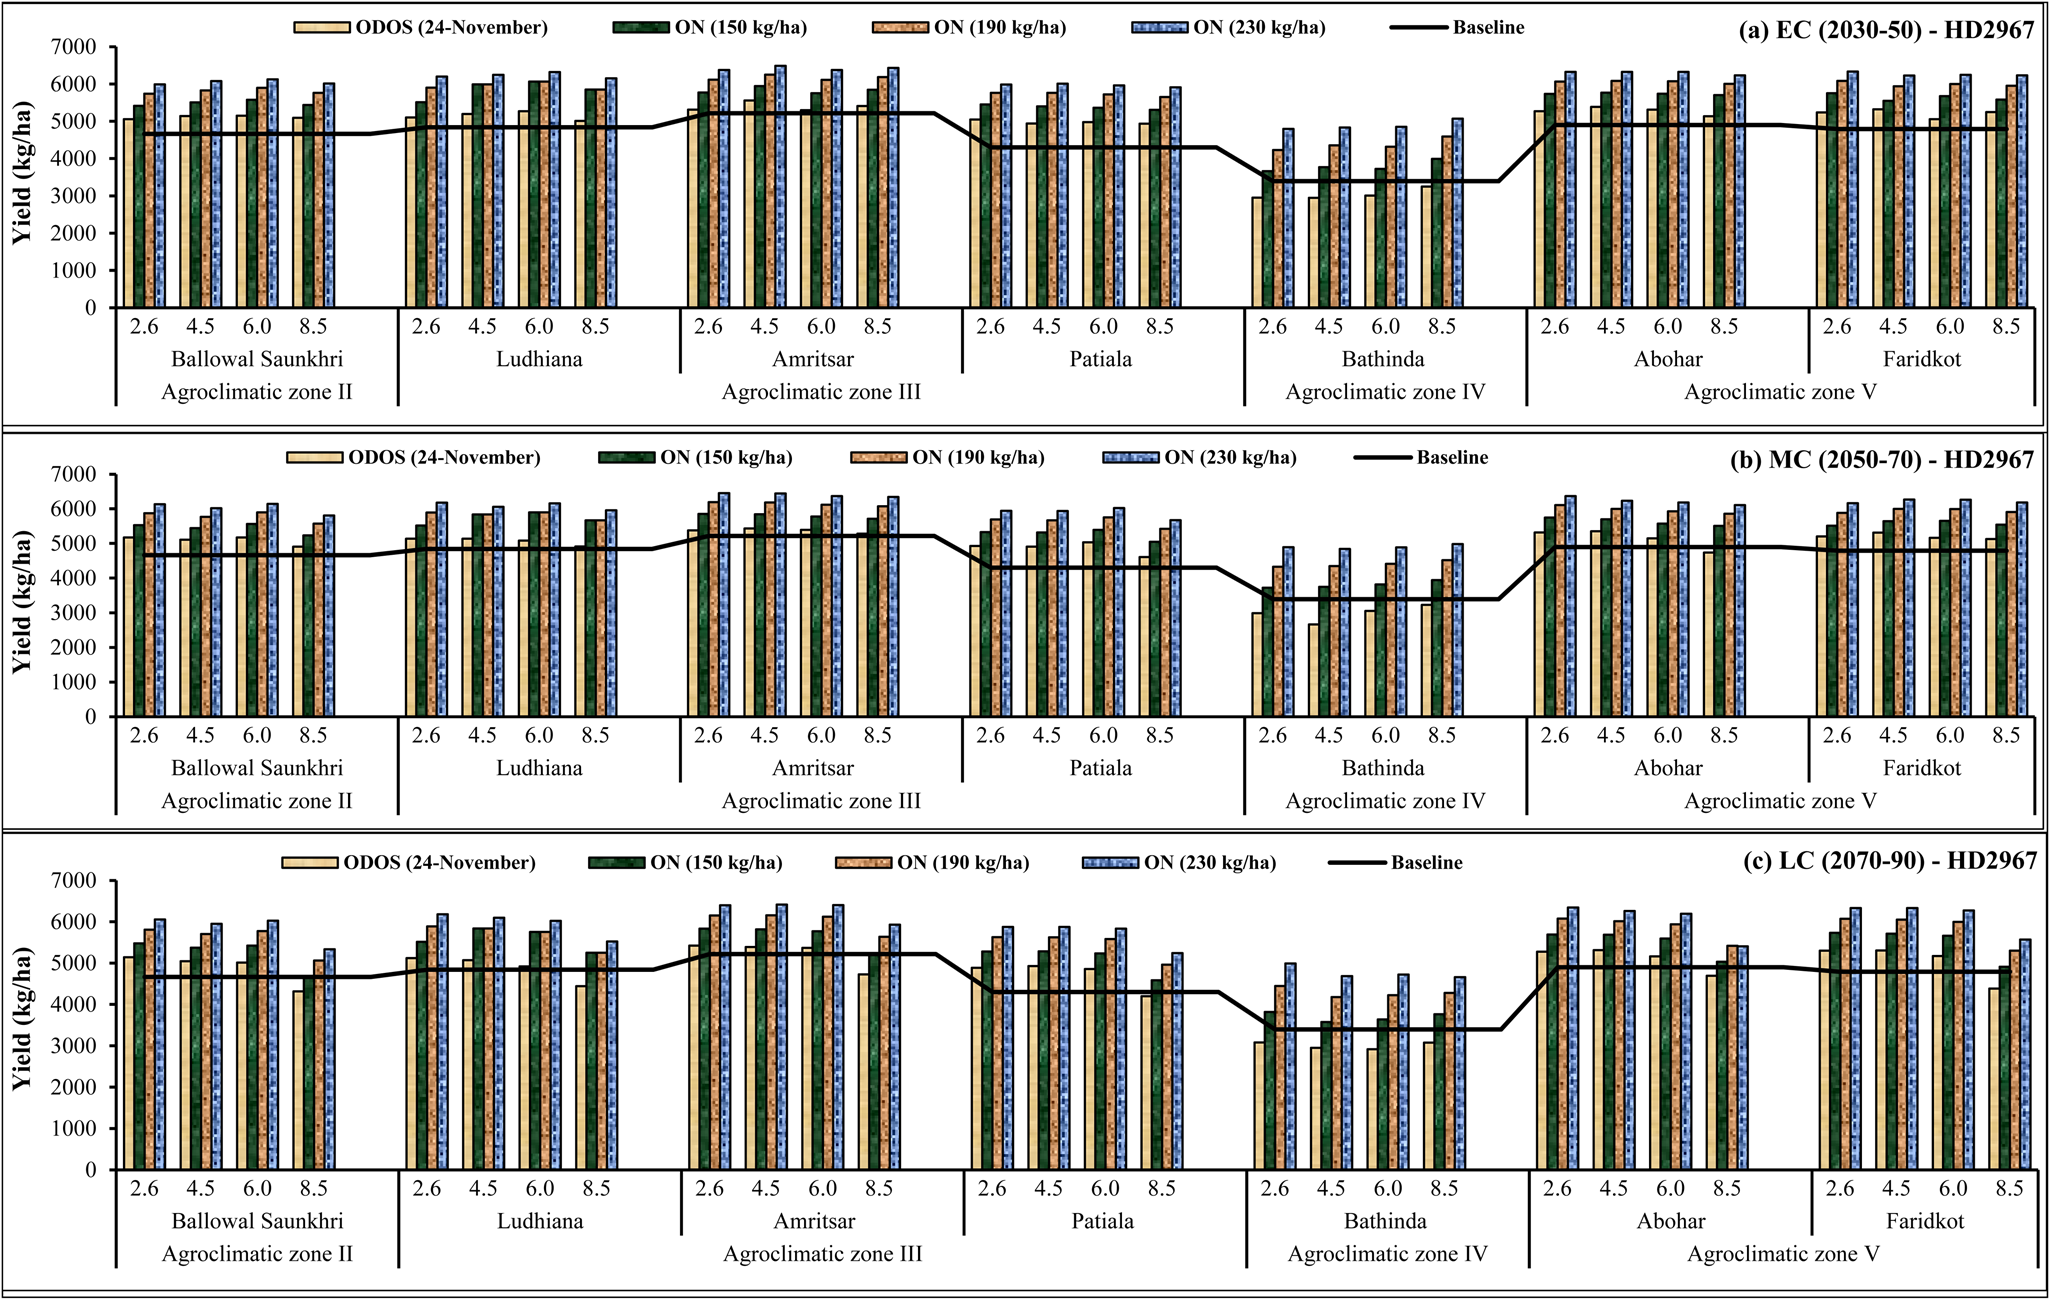
Figure 2. Wheat yield trend of cv. HD2967 under baseline, optimized sowing date and optimized sowing date supplemented with higher N-doses under the RCP 2.6, 4.5, 6.0 and 8.5 scenarios during (a) EC (early century), (b) MC (mid-century) and (c) LC (late century). ODOS, optimized date of sowing; ON, optimized nitrogen doses.
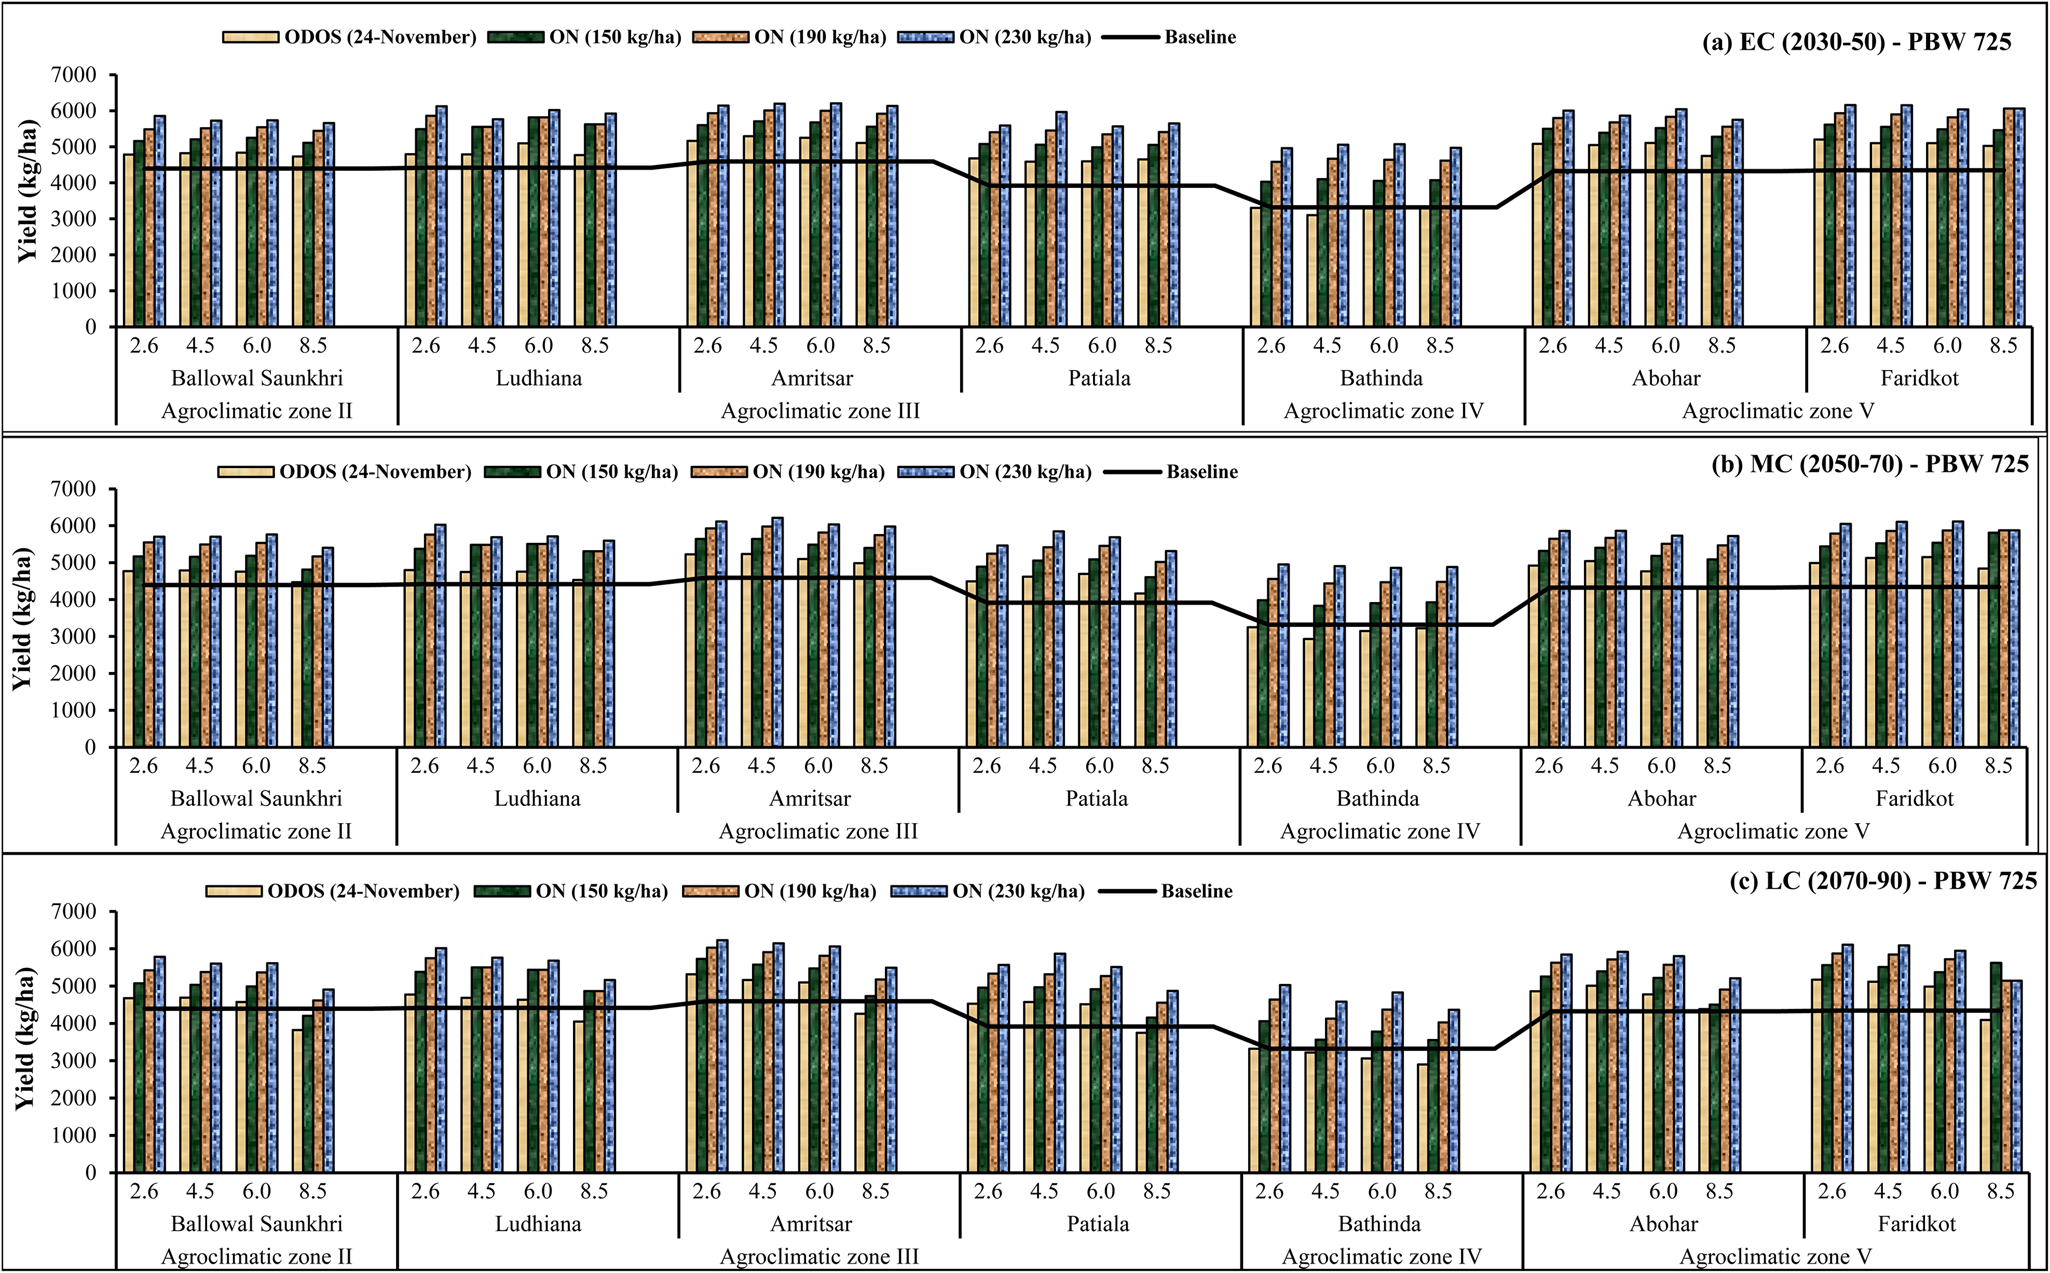
Figure 3. Wheat yield trend of cv.PBW725 under baseline, optimized sowing date and optimized sowing date supplemented with higher N-doses under the RCP 2.6, 4.5, 6.0 and 8.5 scenarios during (a) EC (early century), (b) MC (mid-century) and (c) LC (late century). ODOS, optimized date of sowing; ON, optimized nitrogen doses.
In case of the RCP 8.5 scenario, the yield of cvs. HD2967 and cv. PBW725 increased with optimized sowing date during EC by 9 and 8%, respectively and MC by 5 and 2%, respectively and decreased during LC by 7 and 13%, respectively (Figs 2 and 3). When the optimized sowing date was supplemented with three N doses, the yield of cv. HD2967 and cv. PBW725 deviated from the baseline yield during EC by 17–29 and 16–29%, respectively, MC between 12–25 and 10–23%, respectively and LC between 0.3–15 and −4 to 12%, respectively.
Under the RCP 2.6, 4.5, 6.0 and 8.5 scenarios the days to maturity for cv. HD2967 decreased from the baseline (171 days) by 24, 24 ± 2, 24 ± 3 and 25 ± 8 days, respectively (Fig. 4) and for cv. PBW725 from the baseline (167 days) by 22 ± 1, 23 ± 2, 23 ± 3 and 23 ± 9 days, respectively (Fig. 5).
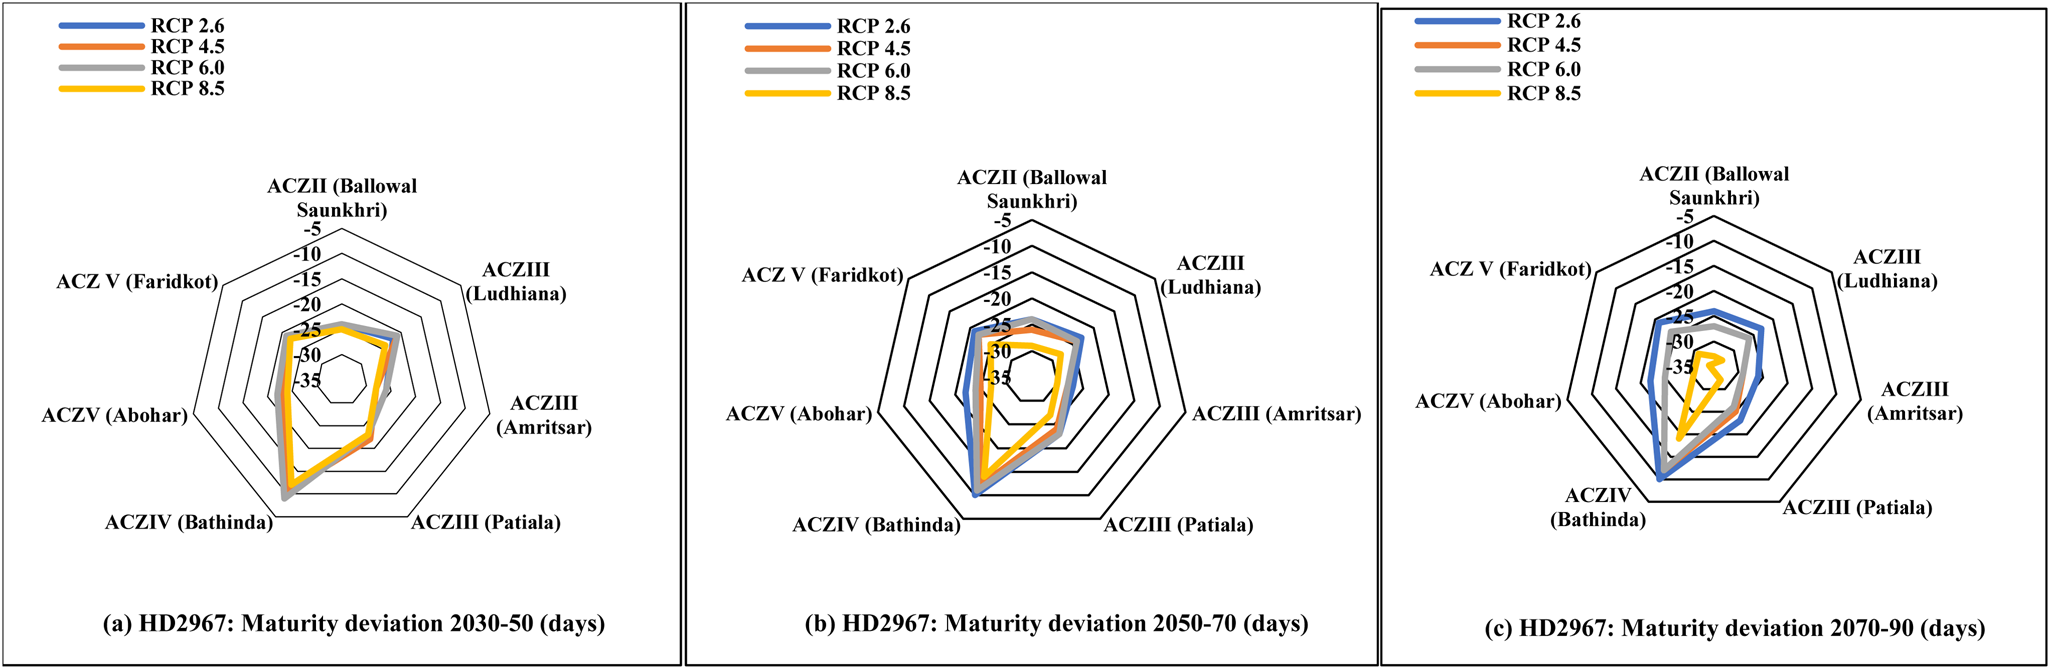
Figure 4. Deviation of maturity days in cv. HD2967 under the four RCP scenarios in different agroclimatic zones (ACZs) of Punjab during three time slices (a) EC: 2030–50; (b) MC: 2050–70 and (c) LC: 2070–90.
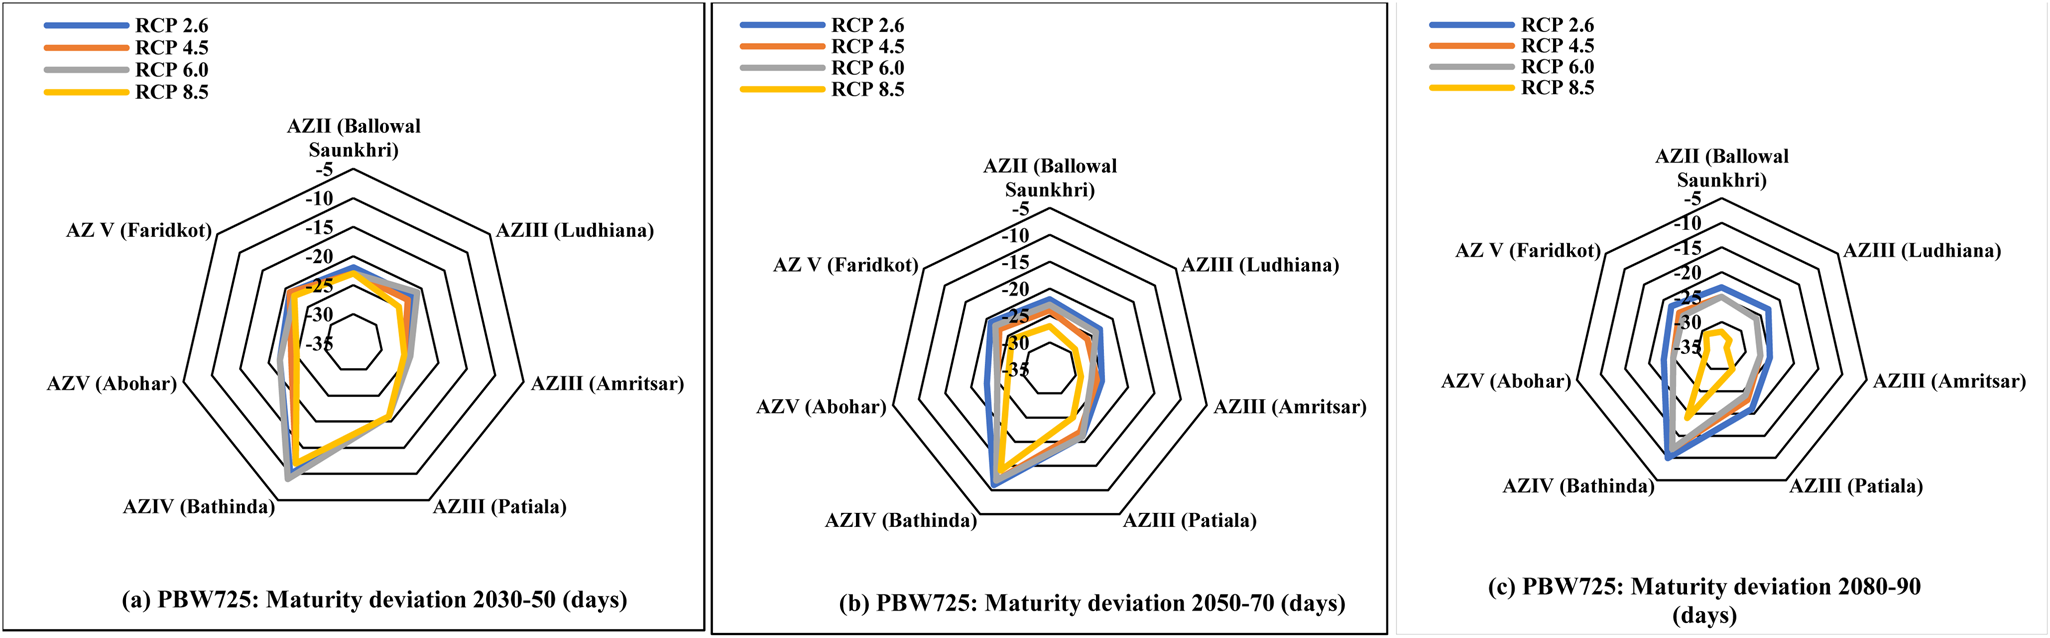
Figure 5. Deviation of maturity days in cv. PBW725 under the four RCP scenarios in different agroclimatic zones (AZs) of Punjab during three time slices (a) EC: 2030–50; (b) MC: 2050–70 and (c) LC: 2070–90.
Agroclimatic zone III (Ludhiana, Amritsar and Patiala)
Ludhiana
At Ludhiana, the optimized sowing date for the cultivars HD2967 and PBW725 under four RCP scenarios and three time periods was 24 November where the yield increased from the baseline with supplemented N doses while the days to maturity days shortened by 21–33 days.
Under the RCP 2.6, 4.5 and 6.0 scenarios, the yield of cv. HD2967 increased from its baseline (4840 kg/ha) with optimized sowing date during EC by 6, 7 and 9%, respectively, MC by 6, 6 and 5%, respectively and LC by 6, 5 and 2%, respectively. When the optimized sowing date was supplemented with three N doses, the yield of cv. HD2967 for the three scenarios increased during EC by 14–28, 24–29 and 25–31%, respectively, MC by 14–28, 21–25 and 22–27%, respectively and LC by 14–28, 21–26 and 19–24%, respectively (Fig. 2). Similarly, the yield of cv. PBW725 under the RCP 2.6, 4.5 and 6.0 scenarios increased from its baseline yield (4418 kg/ha) with optimized sowing date during EC by 9, 9 and 15%, respectively, MC by 9, 7 and 8%, respectively and LC by 8, 6 and 5%, respectively. When the optimized sowing date was supplemented with three N doses, the yield of cv. PBW725 for the three scenarios increased during EC by 24–39, 26–31 and 32–36%, respectively, MC by 22–37, 24–29 and 25–29%, respectively and LC by 22–36, 25–30 and 23–29%, respectively (Fig. 3).
In case of the RCP 8.5 scenario, the yield of cvs. HD2967 and PBW725 increased with optimized sowing date during EC by 4 and 8%, respectively and MC by 2 and 3%, respectively, but decreased during LC by 8% each (Figs 2 and 3). When the optimized sowing date was supplemented with three N doses, the increase in yield of cvs. HD2967 and PBW725 during EC ranged from 21 to 27 and 27 to 34%, respectively, MC from 17 to 23 and 20 to 27%, respectively and LC from 9 to 14 and 10 to 17%, respectively.
Under the RCPs 2.6, 4.5, 6.0 and 8.5, the days to maturity for cv. HD2967 shortened from the baseline (170 days) by 22 + 1, 24 ± 3, 21 ± 5 and 22 ± 11 days, respectively (Fig. 4) and for cv. PBW725 from the baseline (168 days) by 21 ± 2, 23 + 3, 23 ± 3, 21 ± 5 and 22 ± 12 days, respectively (Fig. 5).
Amritsar
At Amritsar, the optimized sowing date for cvs. HD2967 and PBW725 for the four RCP scenarios and three time slices was 24 November where an increase in yield from the baseline was observed with supplemented N doses, while the days to maturity shortened by 25–36 days.
Under the RCP 2.6, 4.5 and 6.0 scenarios, the yield of cv. HD2967 increased from its baseline (5219 kg/ha) with optimized sowing date during EC by 2, 7 and 2%, respectively, MC by 3, 4 and 3%, respectively and LC by 4, 3 and 3%, respectively. When the optimized sowing date was supplemented with three N doses, the yield of cv. HD2967 for the three scenarios increased during EC by 11–22, 14–24 and 10–22%, respectively, MC by 12–24, 12–23 and 11–22%, respectively and LC by 12–23, 11–23 and 11–23%, respectively (Fig. 2). Similarly, the yield of cv. PBW725 was increased with optimized sowing date from its baseline (4594 kg/ha) under the RCP 2.6, 4.5 and 6.0 scenarios during EC by 12, 15 and 14%, respectively, MC by 14, 14 and 11%, respectively and LC by 16, 12 and 11%, respectively. When the optimized sowing date was supplemented with three N doses, the yield of cv. PBW725 for the three RCPs increased during EC by 22–34, 24–35 and 24–35%, respectively, MC by 23–33, 23–35 and 19–31%, respectively and LC by 25–36, 21–34 and 19–31%, respectively (Fig. 3).
In case of the RCP 8.5 scenario, the yield of cvs. HD2967 and PBW725 with optimized sowing date increased from their baseline yield during EC by 4 and 11%, respectively and MC by 2 and 9%, respectively, but decreased during LC by 9 and 7%, respectively. When the optimized sowing date was supplemented with three N doses, the yield of cvs. HD2967 and PBW725 during EC increased by 12–23 and 21–34%, respectively, MC by 10–22 and 18–30%, respectively and LC by −0.4 to 14 and 3–20%, respectively.
Under the RCP 2.6, 4.5, 6.0 and 8.5 scenarios, the days to maturity for cv. HD2967 decreased from baseline (177 days) by 26 + 1, 28 ± 1, 26 ± 3 and 28 ± 6 days, respectively (Fig. 4) and for cv. PBW725 from baseline (173 days) by 21 ± 1, 26 + 1, 25 ± 2 and 26 ± 8 days, respectively (Fig. 5).
Patiala
At Patiala, the optimized sowing date for cvs. HD2967 and PBW725 under the four RCP scenarios and three time slices was 24 November where the yield increased from the baseline yield with supplemented N doses while the days to maturity decreased by 21–32 days.
Under the RCP 2.6, 4.5 and 6.0 scenarios, the yield of cv. HD2967 increased from its baseline yield (4300 kg/ha) with optimized sowing date during EC by 18, 15 and 16%, respectively, MC by 15, 14 and 17%, respectively and LC by 14, 15 and 13%, respectively. When the optimized sowing date was supplemented with three N doses, the yield of cv. HD2967 under the three RCP scenarios increased during EC by 27–39, 26–40 and 25–39%, respectively, MC by 24–38, 24–38 and 25–40%, respectively and LC by 23–37, 23–37 and 22–36%, respectively (Fig. 2). Similarly, the yield of cv. PBW725 increased from its baseline yield (3917 kg/ha) under the RCP 2.6, 4.5 and 6.0 scenarios with optimized sowing date during EC by 19, 17 and 17%, respectively, MC by 15, 18 and 20%, respectively and LC by 16, 17 and 15%, respectively. When the optimized sowing date was supplemented with three N doses, the yield of cv. PBW725 under the three RCP scenarios increased during EC by 30–43, 29–52 and 27–42%, respectively, MC by 25–40, 29–49 and 30–45%, respectively and LC by 27–42, 27–50 and 26–41%, respectively (Fig. 3).
In case of the RCP 8.5 scenario, the yield of cvs. HD2967 and PBW725 with optimized sowing date increased during EC by 15 and 19%, respectively and MC by 7 and 6%, respectively, but decreased during LC by 2 and 4%, respectively (Figs 2 and 3). When the optimized sowing date was supplemented with three N doses, the yield of cvs. HD2967 and PBW725 increased during EC by 24–38 and 29–44%, respectively, MC by 17–32% and 18–36%, respectively and LC by 7–22% and 6–25%, respectively.
For RCPs 2.6, 4.5, 6.0 and 8.5, the days to maturity for cv. HD2967 (Fig. 4) decreased by 23, 22 ± 3, 23 ± 3 and 23 ± 9 days, respectively and for cv. PBW725 (Fig. 5) by 21, 21 ± 3, 21 ± 2 and 21 ± 9 days, respectively.
Agroclimatic zone IV (Bathinda)
At Bathinda, the optimized sowing date (24 November) for the two wheat cultivars did not increase yield from the baseline yield unless supplemented with the three doses of N. The crop maturity shortened by 9–19 days for both the cultivars.
Under the RCP 2.6, 4.5 and 6.0 scenarios, the yield of cv. HD2967 decreased from its baseline (3397 kg/ha) with optimized sowing date during EC by 13, 13 and 11%, respectively, MC by 12, 22 and 10%, respectively and LC by 9, 13 and 14%, respectively. But when the optimized sowing date was supplemented with three N doses, the yield of cv. HD2967 for three RCPs increased during EC by 8–41, 11–42 and 10–43%, respectively, MC by 10–44, 10–43 and 12–44%, respectively and LC by 12–47, 5–38 and 7–39%, respectively (Fig. 2).
The yield of cv. PBW725 under the RCP 2.6, 4.5 and 6.0 scenarios decreased with optimized sowing date from its baseline (3322 kg/ha) during EC by 0.5, 7 and 1%, respectively, MC by 2, 12 and 6%, respectively and LC by 0, 3 and 8%, respectively. When the optimized sowing date was supplemented with three N doses, the yield of cv. PBW725 for the three RCPs increased during EC by 21–49, 23–52 and 22–53%, respectively, MC by 20–49,15–48 and 17–46%, respectively and LC by 22–51, 7–38 and 14–45%, respectively (Fig. 3).
In case of the RCP 8.5 scenario, the yield of cv. HD2967 (Fig. 2) and cv. PBW725 (Fig. 3) with optimized sowing date either increased or decreased during EC by −4 and 0.7%, respectively, MC by −5 and −3%, respectively and LC by −9 and −13%, respectively. When the optimized sowing date was supplemented with three N doses, the yield of cvs. HD2967 and PBW725 increased during EC by 18–49% and 23–50%, respectively, MC by 16–47% and 18–47%, respectively and LC by 11–37% and 7–31%, respectively.
Days to maturity of cv. HD2967 from the baseline (168 days) for the four RCPs decreased by 9 ± 1, 11 ± 4, 9 ± 3 and 12 ± 7 days, respectively and for cv. PBW725 from the baseline (156 days) by 21 ± 1, 12 + 3, 9 ± 3 and 12 ± 7 days, respectively (Figs 4 and 5).
Agroclimatic zone V (Abohar and Faridkot)
Abohar
The optimized sowing date for cvs. HD2967 and PBW725 at Abohar was 24 November where an increase in wheat yield from the baseline was simulated, which further improved when optimized sowing date was supplemented with three N doses, though the growth duration decreased by 22–32 days.
Under the RCP 2.6, 4.5 and 6.0 scenarios, the yield of cv. HD2967 increased from its baseline (4898 kg/ha) with optimized sowing date during EC by 8, 10 and 9%, respectively, MC by 9, 9 and 5%, respectively and LC by 8, 9 and 5%, respectively. When the optimized sowing date was supplemented with three N doses, the increase in yield of cv. HD2967 for the three RCPs during EC ranged from 17 to 29, 18 to 29 and 17 to 29%, respectively, MC by 17 to 30, 16 to 27 and 14 to 26%, respectively and LC by 16 to 30, 16 to 28 and 14 to 27%, respectively (Fig. 2).
The yield of cv. PBW725 increased from its baseline (4324 kg/ha) under the three RCP 2.6, 4.5 and 6.0 scenarios with optimized sowing date during EC by 18, 17 and 18%, respectively, MC by 14, 17 and 10%, respectively and LC by 13, 16 and 11%, respectively. When the optimized sowing date was supplemented with three N doses, the increase in yield of cv. PBW725 for the three RCPs during EC ranged from 27 to 39, 25 to 36and 28 to 40%, respectively, MC by 23 to 36, 25 to 36 and 20 to 33%, respectively and LC by 22 to 35, 25 to 37 and 21 to 34%, respectively (Fig. 3).
In case of the RCP 8.5 scenario, the yield of cvs. HD2967 and PBW725 with optimized sowing date increased during EC by 5 and 10%, respectively but decreased during MC by 3 and 0.7%, respectively and LC by 4 and 1%, respectively (Figs 2 and 3). Further, when supplemented with three N doses, the yield of cvs. HD2967 and PBW725 increased during EC by 17–27% and 22–33%, respectively, MC by 13–25% and 18–32%, respectively and LC by 3–10% and 4–21%, respectively.
Maturity duration under the RCP 2.6, 4.5, 6.0 and 8.5 scenarios for cv. HD2967 from baseline (172 days) decreased by 22, 23 ± 2, 22 ± 3 and 24 ± 7 days and for cv. PBW725 from baseline (170 days) by 22 ± 1, 24 ± 1, 22 ± 3 and 25 ± 7 days, respectively (Figs 4 and 5).
Faridkot
The optimized sowing date for cvs. HD2967 and PBW725 at Faridkot was 24 November when an increase in yield was observed from the baseline, though the days to maturity decreased by 21–31 days.
Under the RCP 2.6, 4.5 and 6.0 scenarios, the yield of cv. HD2967 increased from its baseline (4790 kg/ha) with optimized sowing date during EC by 9, 11 and 6%, respectively, MC by 9, 11 and 8%, respectively and LC by 11, 11 and 8%, respectively. The optimized sowing date together with three N doses increased the yield of cv. HD2967 for the three RCPs during EC by 20–32, 16–30 and 19–30%, respectively, MC by 15–29, 18–31 and 18–31%, respectively and LC by 20–32, 19–32 and 18–31%, respectively (Fig. 2).
The yield of cv. PBW725 increased from its baseline (4344 kg/ha) under the RCP 2.6, 4.5 and 6.0 scenarios with optimized sowing date during EC by 20, 18 and 17%, respectively, MC by 15, 18 and 19%, respectively and LC by 19, 18 and 15%, respectively. When the optimized sowing date was supplemented with three N doses, then the increase in yield of cv. PBW725 during EC ranged from 29 to 42, 28 to 42 and 26 to 39%, respectively, MC from 25 to 39, 27 to 41 and 28 to 41%, respectively and LC from 28 to 41, 27 to 40 and 24 to 37%, respectively (Fig. 3).
In case of the RCP 8.5 scenario, the yield of cv. HD2967 with optimized sowing date deviated from the baseline yield during EC, MC and LC by 10, 7 and −9%, respectively but when supplemented with three N doses the increase in yield ranged from 17 to 30, 16 to 29 and 3 to 16%, respectively (Fig. 2). Similarly for cv. PBW725, the deviation in yield from the baseline with optimized sowing date during EC, MC and LC were 16, 12 and −6%, respectively. Together with supplementary N doses, the increase in yield ranged from 26 to 40, 34 to 35 and 19 to 30% for the three time slices, respectively (Fig. 3).
Maturity duration under the RCP 2.6, 4.5, 6.0 and 8.5 scenarios for cv. HD2967 (Fig. 4) from baseline (171 days) was decreased by 21, 21 ± 3, 21 ± 3 and 22 ± 9 days and for cv. PBW725 (Fig. 5) from baseline (169 days) by 21, 21 ± 3, 22 ± 3 and 22 ± 9 days, respectively.
Discussion
Wheat crop is a cool season crop and is highly vulnerable to the rise in temperature. Punjab, Haryana, Uttar Pradesh and Bihar are the major wheat-producing states in the Indo Gangetic plains (IGP) of India, so climate change-induced temperature increase will affect their yield and ultimately total production. Therefore, it is important to develop adaptation strategies to climate change so as to increase and sustain wheat production in India. So to assess the effect of projected climate change under four RCP (2.6, 4.5, 6.0 and 8.5) scenarios and evaluate the suitable adaptation measures for wheat crop in Punjab, a calibrated and evaluated CERES-Wheat (V4.7.5) model was used. The study area included the four ACZs and the future three time slices considered were EC: 2030–2050, MC: 2050–2070 and LC: 2070–2090 in Punjab. The adaptation measures included optimized sowing date and its supplementation with higher N doses, i.e. 150, 190 and 230 kg/ha. The deviations in wheat yield and days to maturity from the baseline period during three time slices were studied.
The simulation study showed that simple shifting of sowing date for wheat to 24 November in Punjab state was the most suitable measure to nullify the impact of climate change for three climatic zones (ACZs II, III and IV). Only in the ACZIV, higher yield was achieved when the optimized sowing date (24 November) was supplemented with higher N doses. When both the adaptation measures were considered, wheat cultivars gave higher yield than the baseline yield during EC, MC and LC under the RCP 2.6, 4.5 and 6.0 emission scenarios, but under the RCP 8.5 emission scenario none of the cultivar could perform well during the LC. The maximum shortening in crop growth period was observed under the high emission (RCP 8.5) scenario. Between the two cultivars, cvs. HD2967 and PBW725, not much difference in yield was simulated and both were found to be suitable under future climate scenarios.
Climate change effect on crop yield
Under climate change, the crop yield is affected due to decline in both total biomass production and harvest index. Biomass production is reduced due to shortening of life cycle and overall decrease in net photosynthesis during crop growth period; whereas harvest index is reduced due to poor seed set and grain filling. In a recent study, Schierhorn et al. (Reference Schierhorn, Hofmann, Gagalyuk, Ostapchuk and Muller2021) reported that wheat crop stages are highly sensitive to climatic parameters and their extremes especially the heat waves. Daloz et al. (Reference Daloz, Rydsaa, Hodnebrog, Sillmann, van Oort, Mohr, Agrawal, Emberson, Stordal and Zhang2021) reported a decrease in yield of wheat by 1–8%, if only climate change is considered. But if the limitations on water availability for irrigation are also considered, then yield losses between 4 and 36% are estimated. For the future time periods, Kumar et al. (Reference Kumar, Aggarwal, Swaroopa Rani, Saxena, Chauhan and Jain2014) have reported decrease in yield of wheat in India between 6–23 and 15–25% during 2050s and 2080s, respectively.
The climate data predictions by GCMs can be used as an input in crop models for evaluating the adaptive strategies for sustaining crop production levels. Earlier studies have shown that the sub-grid scale features like clouds, topography sometimes cannot be properly modelled by the GCMs due to their coarse spatial resolution and so the predicted climate parameters have an inherent bias which needs to be corrected before using it in impact analysis studies (Christensen et al., Reference Christensen, Boberg, Christensen and Lucas Picher2008; Haerter et al., Reference Haerter, Hagemann, Moseley and Piani2011). In concurrence with these observations, a regional study by Kaur et al. (Reference Kaur, Prabhjyot-Kaur and Kothiyal2022) reported that the GCMs available at http://gismap.ciat.cgiar.org/MarkSimGCM/ overestimated the annual maximum temperature in the range 1.76–2.73°C while the minimum temperature was both underestimated (0–0.6°C) and overestimated (0–0.2°C). The rainfall was overestimated in the range 635–997 mm for Punjab state. Therefore, in the present study, bias-corrected data of ensemble model (Kaur et al., Reference Kaur, Prabhjyot-Kaur and Kaur2020) was used as an input in CERES-Wheat model to analyse the effect of optimized farming practices (sowing window and N fertilizer) during the three future time slices; EC: 2030–2050, MC: 2050–2070 and LC: 2070–2090.
Adaptive strategies
Shifting sowing time of a crop is one of the most easily adaptable strategies. However, whether to sow early or late to adapt to climate change at a given site would depend on the current climatic conditions and future changes in climate. For example, Lhomme et al. (Reference Lhomme, Mougou and Mansour2009) used the weather data simulated by ARPEGE-Climate model for A1B scenario for two stations of Tunisia (Jendouba and Kairouan) and reported that it would be profitable to sow the wheat crop 1 month earlier because the start of the autumn would provide favourable water conditions for the crop. In the present study, however, instead of current practice of normal sowing window (first to third week November), 24 November was simulated to be the suitable sowing date under the climate change scenarios at seven locations within the selected ACZs.
Though the geographical area of Punjab state is only 50 362 km2, the geographical characteristics are very typical. On north eastern parts are the sub-mountainous terrains of Shivaliks while on south western side it shares the soil types highly influenced by sand dunes of Rajasthan state. The central parts of the state have fertile soils of the IGP. Hence, the yield of wheat and the adaptation measures were evaluated in four diverse ACZs of the state. In the neighbouring state of Uttar Pradesh, Patel et al. (Reference Patel, Mall, Jaiswal, Singh and Chand2022) reported wide variations in the impact of climate change on wheat under the RCP scenarios at the different ACZs of the state. In their study, the crop growth duration of wheat was shortened by 1–17 days across the ACZs affecting overall crop growth. In the present simulation study too, a shortening of the growth period for wheat cultivars was observed. During the three time periods and four RCP scenarios, the shortening of crop duration ranged between 24 and 34 days in ACZII, 21 and 36 days in ACZIII, 9 and 19 days in ACZIV and 21 and 32 days in ACZV of Punjab state. However, the decline in wheat yield could be countered with a simple adaptation of sowing date. The lowest baseline yield was simulated at Bathinda station, wherein the present time normal maximum temperature is highest (Prabhjyot-Kaur et al., Reference Prabhjyot-Kaur, Sandhu, Singh, Kaur, Singh and Kaur2016) and so the decline in yield could not be nullified by shifting of sowing date alone.
Patel et al. (Reference Patel, Mall, Jaiswal, Singh and Chand2022) also reported decrease in wheat yield in the different ACZs of Uttar Pradesh. During the 2050s, the wheat yield is predicted to decrease up to 20 and 30% under the RCP 4.5 and RCP 8.5, respectively. The loss in wheat yield is further projected to increase up to 41% under the RCP 8.5 scenario during 2080s and so adaptation measures need to be adopted to sustain the productivity levels of wheat in the region. Dubey et al. (Reference Dubey, Pathak, Chakrabarti, Singh, Gupta and Harit2020) employed INFOCROP model to simulate the effect of terminal heat stress in wheat. They reported a reduction in wheat yield by 11.1% during 2050 scenarios in the IGP of India. This reduction in yield may be checked with a combination of adaptation options, i.e.10 days earlier sowing from recommended planting with additional nitrogen fertilizer (30 kg N/ha) and a supplemental irrigation at the grain filling stage. Another study by Ishtiaque et al. (Reference Ishtiaque, Singh, Lobell, Balwinder-Singh, Fishman and Jain2022) also reported that later sown wheat in IGP of India suffered from terminal heat stress, leading to loss in yield. A very simple adaptation of earlier sowing of wheat could check this loss in yield.
In the present simulation study, shifting of sowing of wheat to 24 November was able to increase the wheat yield in ACZII, ACZIII and ACZV. However, in ACZIV (Bathinda), the wheat yield increased only when the additional dose of nitrogen fertilizer was also applied. Under the RCP 2.6, 4.5 and 6.0 emission scenarios and across the three time slices, the per cent increases in yield of a given cultivar with combined adaptation measures were more or less similar at a given location in an ACZ, except for the Bathinda site. However, under the RCP 8.5 (high emission) scenario, the increase in wheat yield of a cultivar at a given location in an ACZ was much lower in three time slices and especially in MC and LC. These responses in yield to adaptation measures at a given location for the cultivars correlate very well with the increases in both maximum and minimum temperatures under the four RCP scenarios and time periods as reported earlier for Punjab state by Prabhjyot-Kaur et al. (Reference Prabhjyot-Kaur, Sandhu, Kaur, Singh and Dhir2020). The increases in crop yield due to combined adaptation measures in different ACZs were inversely related to the baseline yield at a location, i.e. lower the baseline yield higher the per cent increase in yield and vice-versa, indicating the potential to enhance yield at a location under climate change.
Conclusion
In Indian Punjab, the wheat yield is expected to decrease under the predicted climate change scenarios. The results of the present simulation study using CERES-Wheat model showed that the wheat crop could perform well under future climate scenarios at different locations of Punjab, if adaptation measures like shift in sowing dates, change in N doses and selection of cultivar were done appropriately. Thus, the above study holds the importance for a country like India where wheat is a staple food for majority of population and the state of Punjab is known as the food bowl of India. The current agricultural practices might fail under the future weather conditions, so suitable adaptation measures need to be decided to prevent food scarcity.
Author contributions
All authors contributed to the study conception and design. Material preparation, data collection and analysis were performed by Prabhjyot-Kaur and S. S. Sandhu, Jatinder Kaur and Shivani Kothiyal. The first draft of the manuscript was written by Shivani Kothiyal and Prabhjyot-Kaur and all authors commented on previous versions of the manuscript. All authors read and approved the final manuscript.
Funding statement
The funding support from Science and Engineering Research Board, New Delhi through Core Grant project funding no. CRG/2019/002856: ‘Optimizing cereal productivity under RCP projected climatic scenarios by mid and end of 21st century in Punjab’ is duly acknowledged. The field datasets used in modelling collected under the Indian Council of Agricultural Research (ICAR) research scheme ‘All India Coordinated Research Project on Agrometeorology’ are duly acknowledged.
Competing interests
The authors have no relevant financial or non-financial interests to disclose.
Ethical standards
Not applicable
Data availability
The datasets generated during and/or analysed during the current study are not publicly available because it is currently being used for further research purpose so cannot be made available but are available from the corresponding author on reasonable request.


