


Introduction
Entanglement in static fishing gear is one of the leading causes of whale mortality globally (Read et al., Reference Read, Drinker and Northridge2006; Parsons et al., Reference Parsons, Clarks, Warham and Simmonds2010; Meyers et al., Reference Meyers, Best, Anderson-Reade, Cliff, Dudley and Kirkman2011; Berkenbusch et al., Reference Berkenbusch, Abraham and Torres2013; Thomas et al., Reference Thomas, Reeves and Brownell2016). In particular, creel (also known as the crate or pot) fisheries have been frequently associated with baleen whale entanglement (Kraus, Reference Kraus1990; Lien, Reference Lien1994; Caswell et al., Reference Caswell, Fujiwara and Brault1999; Robbins and Mattila, Reference Robbins and Mattila2001; Johnston et al., Reference Johnston, Thorne and Read2005; Neilson et al., Reference Neilson, Straley, Gabriele and Hills2009; Meyers et al., Reference Meyers, Best, Anderson-Reade, Cliff, Dudley and Kirkman2011; Kraus et al., Reference Kraus, Fasick, Werner and McFarrow2014) given their spatial overlap with whale habitats. Whale entanglement is a concern for animal welfare as well as conservation. During an entanglement, if unable to free itself, a whale may die of: asphyxiation through failure to reach the surface to breathe (Laist, Reference Laist and Coe1987); an inability to forage (Cassoff et al., Reference Cassoff, Moore, McLellan, Barco, Rostein and Moore2011; Moore and Van der Hoop, Reference Moore and Van der Hoop2012); or in the case of larger whales, increased energy expenditure due to trailing gear (Van der Hoop et al., Reference Van der Hoop, Corkeron, Kenney, Landry, Morin, Smith and Moore2016). Entanglement in creel lines can also cause severe injuries such as haemorrhaging, blood vessel lacerations, or the embedding of rope into bone, all of which can be fatal (Meyers et al., Reference Meyers, Best, Anderson-Reade, Cliff, Dudley and Kirkman2011). Moreover, the high stress of an entanglement incident can have chronic effects, such as reduced reproductive output and life span (Meyers et al., Reference Meyers, Best, Anderson-Reade, Cliff, Dudley and Kirkman2011). Certain whale populations are seriously threatened by entanglement, such as the endangered North Atlantic right whale (Eubalaena glacialis) population in the Northwest Atlantic, and humpback whale (Megaptera novaeangliae) populations in Southeast Alaska and east coast of the USA (Cole et al., Reference Cole, Hartley and Garron2006; Cassoff et al., Reference Cassoff, Moore, McLellan, Barco, Rostein and Moore2011; Knowlton et al., Reference Knowlton, Clark, Hamilton, Kraus, Pettis, Rolland and Schick2022).
In Scotland, entanglement is the largest cause of non-natural mortality in baleen whales and is unsustainable in the case of humpback whales (Northridge et al., Reference Northridge, Cargill, Coram, Mandleberg, Calderan and Reid2010; Ryan et al., Reference Ryan, Leaper, Evans, Dyke, Robinson, Haskins, Calderan, van Geel, Harries, Froud and Brownlow2016; MacLennan et al., Reference MacLennan, Leaper, Brownlow, Calderan, Jarvis, Hartny-Mills and Ryan2020). From interviewing fishers, it was estimated that 30 minke whales are entangled annually in Scottish waters (MacLennan et al., Reference MacLennan, Leaper, Brownlow, Calderan, Jarvis, Hartny-Mills and Ryan2020) with an 84% fatality rate accounting for 2.3% of regional abundance estimates (Leaper et al., Reference Leaper, MacLennan, Brownlow, Calderan, Dyke, Evans, Hartny-Mills, Jarvis, McWhinnie, Philp, Read, Robinson and Ryan2022). While a willingness exists among the fishers to address this problem (MacLennan et al., Reference MacLennan, Leaper, Brownlow, Calderan, Jarvis, Hartny-Mills and Ryan2020, Reference MacLennan, Hartny-Mills, Read, Dolman, Philp, Dearing, Jarvis and Brownlow2021; Leaper et al., Reference Leaper, MacLennan, Brownlow, Calderan, Dyke, Evans, Hartny-Mills, Jarvis, McWhinnie, Philp, Read, Robinson and Ryan2022), a full scientific understanding of the impact of entanglement on whale populations is greatly limited by underreporting, and the low likelihood of retrieving whale carcasses (Cole et al., Reference Cole, Hartley and Garron2006; Northridge et al., Reference Northridge, Cargill, Coram, Mandleberg, Calderan and Reid2010; Cassoff et al., Reference Cassoff, Moore, McLellan, Barco, Rostein and Moore2011). Therefore, reported figures for entanglement-related whale mortality are likely to be only a small fraction of the actual number (Ryan et al., Reference Ryan, Leaper, Evans, Dyke, Robinson, Haskins, Calderan, van Geel, Harries, Froud and Brownlow2016; MacLennan et al., Reference MacLennan, Leaper, Brownlow, Calderan, Jarvis, Hartny-Mills and Ryan2020). To date, global efforts to understand and prevent whale entanglement have included research into the ability of whales to detect and avoid fishing gear (Kot et al., Reference Kot, Sears, Anis and Nowacek2012), and potential gear alterations (Kraus et al., Reference Kraus, Fasick, Werner and McFarrow2014; Knowlton et al., Reference Knowlton, Robbins, Landry, McKenna, Kraus and B. Werner2016). Ground lines, that often float, are the source of 83% of minke entanglements in Scotland (Leaper et al., Reference Leaper, MacLennan, Brownlow, Calderan, Dyke, Evans, Hartny-Mills, Jarvis, McWhinnie, Philp, Read, Robinson and Ryan2022). The use of sinking ground lines, as mandated in the US lobster fishery (NMFS et al., 2007) has been suggested as one possible mitigation measure in Scotland (MacLennan et al., Reference MacLennan, Leaper, Brownlow, Calderan, Jarvis, Hartny-Mills and Ryan2020, Reference MacLennan, Hartny-Mills, Read, Dolman, Philp, Dearing, Jarvis and Brownlow2021; Leaper et al., Reference Leaper, MacLennan, Brownlow, Calderan, Dyke, Evans, Hartny-Mills, Jarvis, McWhinnie, Philp, Read, Robinson and Ryan2022). One method to inform entanglement mitigation is by spatial assessments of risk, to describe the overlap between whale habitat and fishing effort. This approach is already used to study the impact of shipping and coastal developments on whale populations (Hatch et al., Reference Hatch, Clark, Merrick, Van Parijs, Ponirakis, Schwehr, Thompson and Wiley2008; Ritter, Reference Ritter2010; Williams and O'Hara, Reference Williams and O'Hara2010; Erbe et al., Reference Erbe, MacGillivray and Williams2012; Martins et al., Reference Martins, Andriolo, Engel, Kinas and Saito2013), and to assess the risk of by-catch for large marine animals (Gilman et al., Reference Gilman, Owens and Kraft2014; Brown et al., Reference Brown, Reid and Rogan2015). Identifying areas of high risk to a population can aid management decisions on where preventative action may have the greatest impact, e.g., moving shipping lanes to mitigate against ship-strikes (Ward-Geiger et al., Reference Ward-Geiger, Silber, Baumstark and Pulfer2005). In the case of whale entanglement, Northridge et al. (Reference Northridge, Cargill, Coram, Mandleberg, Calderan and Reid2010) used this approach to identify areas with a high entanglement risk for minke whales in western Scotland. Combining this approach with modelled predictions of habitat use (for instance as in Williams and O'Hara, Reference Williams and O'Hara2010; Martins et al., Reference Martins, Andriolo, Engel, Kinas and Saito2013) can provide more robust results for identifying high-risk areas.
Because factors such as environmental conditions, fishing activity, and animal habitat-use fluctuate over time, risk is also likely to change. Therefore, continual, dedicated long-term monitoring should strengthen risk assessments, allowing for the estimation of temporal and spatial risk. Here, we use habitat modelling to develop a method for assessing risk-level and consistency to ultimately identify areas where whale entanglement in static fishing gear has remained consistently high over a seven-year period.
Minke whales (Balaenoptera acutorostrata) are one of the most abundant cetaceans in UK waters, and the most abundant baleen whale. They are seasonally resident on the west coast of Scotland, with peak occurrence during summer months (Macleod et al., Reference Macleod, Fairbairns, Gill, Fairbairns, Gordon, Blair-Myers and Parsons2004; Anderwald et al., Reference Anderwald, Evans, Dyer, Dale, Wright and Hoelzel2012). The highest densities of minke whales in Europe occur in Scottish waters where abundance has fluctuated (Hammond et al., Reference Hammond, Lacey, Gilles, Viquerat, Börjesson, Herr, Macleod, Ridoux, Santos, Scheidat and Teilmann2017) in relation to environmental changes (Macleod et al., Reference Macleod, Fairbairns, Gill, Fairbairns, Gordon, Blair-Myers and Parsons2004; Anderwald et al., Reference Anderwald, Evans, Dyer, Dale, Wright and Hoelzel2012). The area also hosts a creel fishery of significant economic importance both locally and nationally. The fishery mainly targets crustaceans such as European lobster, velvet crab, edible crab, crawfish, and Norway lobster (Northridge et al., Reference Northridge, Cargill, Coram, Mandleberg, Calderan and Reid2010). A conservative estimate of rope deployed by the fishery is 7500 km, which poses an entanglement threat to whales (Northridge et al., Reference Northridge, Cargill, Coram, Mandleberg, Calderan and Reid2010). Minke whales are particularly vulnerable to fatal entanglement given their high use of coastal areas where creel fisheries also operate, in addition to their small size and thus greater risk of drowning in situ (Horwood, Reference Horwood1990; Kim, Reference Kim1999; Shrimpton and Parsons, Reference Shrimpton and Parsons2000; Glass et al., Reference Glass, Cole, Garron, Merrick and Pace2008; Song et al., Reference Song, Kim, Zhang and Kim2009; Northridge et al., Reference Northridge, Cargill, Coram, Mandleberg, Calderan and Reid2010). Leaper et al. (Reference Leaper, MacLennan, Brownlow, Calderan, Dyke, Evans, Hartny-Mills, Jarvis, McWhinnie, Philp, Read, Robinson and Ryan2022) reported that 84% of minke whale entanglements were fatal and estimated fatal entanglement rates suggest there is a risk of localized depletion for the west coast of Scotland.
Our study applied a novel spatio-temporal risk analysis to assess the entanglement of minke whales in creel lines in western Scotland. The aim was to determine both the level and consistency of entanglement risk, over a seven-year monitoring period, based on the assumption that high co-occurrence of whales and creel fleets elevates entanglement risk.
Materials and methods
Data collection
Data were collected by the Hebridean Whale and Dolphin Trust (HWDT) from the auxiliary powered sailing research vessel Silurian during dedicated surveys off the west coast of Scotland (Figure 1). Surveys were conducted during the known peak in minke whale occurrence (March–October) between 2008 and 2014 (Table 1). Standard visual line transect methods were used to collect minke whale and creel sightings data (as in Embling et al., Reference Embling, Gillibrand, Gordon, Shrimpton, Stevick and Hammond2010). The surveys aim to achieve non-biased spatial coverage throughout the survey area each season (Figure 2), however, equal coverage is not possible due to the location of anchorages and limited suitable conditions to survey certain areas (Hebridean Whale and Dolphin Trust, 2018). During survey effort, the vessel maintained an average speed of six knots, travelling by sail whenever possible.

Figure 1. Surveys are in western Scotland.
Table 1. Sightings (minke whales and creel fleets) and survey effort (km) for visual line transect surveys carried out by HWDT from 2008 to 2014

The survey effort reported here refers to the distance surveyed after data had been divided into 2 km transect segments for analysis. Number of sightings/km is the number of sightings divided by distance.

Figure 2. All sightings of minke whales (blue) and creel fleets (red) from 2008 to 2014, with survey effort track lines.
Teams of trained observers carried out cetacean visual surveys under the supervision of an experienced marine mammal observer. During visual surveys, two observers stood on the front deck of the vessel (2 m above sea level), continuously scanning their respective windows (270° to 5° and −5° to 90° relative to the vessel transect line) using the naked eye and 7 × 50 mm binoculars. Each observer changed sides of the vessel for observation after 30 min, and retired for rest after 1 h of observation, in order to avoid observer fatigue. When possible short deviations from the dedicated visual survey transect line were made to capture images of cetaceans and basking sharks for photo-identification (under NatureScot research licence 159755). During these deviations, sightings of whales continued to be recorded whereas creels were not routinely documented. This data has been included in the analysis. This study focussed on the sightings of both minke whales (Balaenoptera acutorostrata) and pairs of creel marker buoys which are on the endlines of the submerged creel fleets (Figure 3). In Scotland, the gear configuration typically comprises: a buoy at each end with vertical lines on each, leading to weights on the seabed. Connecting them is a floating groundline, to which creels are attached by floating branch lines, typically 50–60 per fleet (Leaper et al., Reference Leaper, MacLennan, Brownlow, Calderan, Dyke, Evans, Hartny-Mills, Jarvis, McWhinnie, Philp, Read, Robinson and Ryan2022). In the event of a sighting, the time, GPS coordinates, and distance to animal/creel buoy within 1 km from the boat, were recorded on a computer using software developed by the International Fund for Animal Welfare (IFAW; Logger 2000 up until 2010/2011 and Logger 2010 for remaining years). The GPS coordinates and speed of the vessel were also automatically recorded every 10 s, and additionally when survey effort changed. During visual surveys, environmental conditions known to introduce perception bias (Beaufort sea state, visibility, glare) were recorded every 15 min.

Figure 3. Generalized diagram of a creel fleet used to catch crustaceans.
Data analysis
Habitat modelling
Using GPS data, survey transects were divided into 2 km segments, since sightings were only recorded within 1 km of the vessel. Analysis was carried out on the presence or absence (occurrence) of minke whale sightings for each 2 km segment.
Before modelling, Spearman's rank correlation tests were used to examine correlation between variables. For any two variables with a significant (P < 0.05) correlation (−0.7 > r > 0.7), only the most biologically relevant variable was retained in the model. Habitat modelling was then carried out using generalized additive modelling (GAM) techniques using R statistics software (R Core Team, 2015) and the mgcv package (Wood, Reference Wood2006a). Modelling aimed to relate the occurrence of minke whales in 2 km transect segments to environmental conditions that affect sightings rates (detectability) and to associated environmental and temporal variables (Table 2). Data were divided into two temporal groupings, 2008–2011 and 2012–2014, and two different models were developed from these data groups. Model training was carried out on a 75% subsample of the data, selected at random. The remaining 25% of data was held back as a test set for model evaluation (Guisan and Zimmermann, Reference Guisan and Zimmermann2000).
Table 2. Description of model terms

The minke whale occurrence data was modelled with a binomial distribution and log-link function (Wood, Reference Wood2006b). The creel fleet occurrence data was modelled with a Poisson distribution. Forward stepwise selection was carried out, with term selection based on minimizing the Unbiased Risk Estimator (UBRE) score, for those variables that showed a significant relationship (P < 0.05) with minke whale occurrence (as in Embling et al., Reference Embling, Gillibrand, Gordon, Shrimpton, Stevick and Hammond2010; Anderwald et al., Reference Anderwald, Evans, Dyer, Dale, Wright and Hoelzel2012) and contributed at least 1% to the deviance explained by the model (Embling et al., Reference Embling, Gillibrand, Gordon, Shrimpton, Stevick and Hammond2010). Minimizing the UBRE score indicates a better model fit and is related to the similar Akaike's Information Criterion (AIC) measure (Wood, Reference Wood2006b).
As in Embling et al. (Reference Embling, Gillibrand, Gordon, Shrimpton, Stevick and Hammond2010), variables that affect the ability to see animals were included first in models to explain any influence on sighting probability. Sea state, visibility, swell, and glare, were all included in analysis given the potential for these variables to affect the probability of an observer sighting a minke whale or creel buoy (i.e. perception bias). Vessel speed is particularly important to consider for its influence on sighting long-diving marine mammals (Barlow, Reference Barlow1999), since higher speeds may result in passing the animal before it surfaces (i.e. availability bias). Furthermore, Macleod et al. (Reference Macleod, Fairbairns, Gill, Fairbairns, Gordon, Blair-Myers and Parsons2004) reported that it was significantly harder to sight minke whales above Beaufort Sea state 2.
Second, the following environmental variables were introduced to the model: depth, slope (degrees), seabed substrate, and a combination of tidal and wave energy. Depth and slope data were extracted from a raster bathymetry map obtained from Edina Digimaps. Substrate and combined wave and tidal energy data (CombEnergy as defined by EUNIS) were extracted from a seabed habitat map for the North Sea and Celtic Sea, obtained from the European Marine Observation Data Network (EMODnet) Seabed Habitats project (funded by the European Commission's Directorate-General for Maritime Affairs and Fisheries; SeaZone Solutions Ltd). The categorical habitat descriptions in this map followed the EUNIS 2007–2011 classification system (Appendix 1 & 2). Previous research has shown a relationship between minke whale habitat and water depth, showing that occurrence peaks around 60 m depths (Skov et al., Reference Skov, Durink, Danielsen and Bloch1995; Hooker et al., Reference Hooker, Whitehead and Gowans1999; Macleod et al., Reference Macleod, Fairbairns, Gill, Fairbairns, Gordon, Blair-Myers and Parsons2004). Depth and seabed sediment are also known to influence the distribution of sand eels, Ammodytes spp. (Wright and Begg, Reference Wright and Begg1997) and herring, Clupea harengus (Saville et al., Reference Saville, Bailey and Black1984) two of the minke whales' most important prey species in Scottish waters (Nordoy and Blix, Reference Nordoy and Blix1992; Olsen and Holst, Reference Olsen and Holst2001; Pierce et al., Reference Pierce, Santos, Reid, Patterson and Ross2004). Many studies have therefore suggested that the reported relationship between sandy sediments and minke whale habitat (Naud et al., Reference Naud, Long, Brethes and Sears2003; Macleod et al., Reference Macleod, Fairbairns, Gill, Fairbairns, Gordon, Blair-Myers and Parsons2004) is based on the habitat of their prey. Seabed slope has previously been found to influence minke whale habitat, with highest occurrence around 15° (Macleod et al., Reference Macleod, Fairbairns, Gill, Fairbairns, Gordon, Blair-Myers and Parsons2004; Anderwald et al., Reference Anderwald, Evans, Dyer, Dale, Wright and Hoelzel2012). Furthermore, there is some evidence to suggest a relationship between minke whale foraging and travelling with tidal energy (Anderwald et al., Reference Anderwald, Evans, Dyer, Dale, Wright and Hoelzel2012). Previous research has found minke whales to be encountered more frequently in areas where increased tidal energy and upwelling may have attracted prey species (Johnston et al., Reference Johnston, Thorne and Read2005; Ingram et al., Reference Ingram, Walshe, Johnston and Rogan2007).
Finally, temporal and spatial variables were introduced to the model. Month was related to minke whale occurrence given previous reports of minke habitat seasonality (Gill and Fairbainrns, Reference Gill and Fairbainrns1995; Macleod et al., Reference Macleod, Fairbairns, Gill, Fairbairns, Gordon, Blair-Myers and Parsons2004). Year was also included in this portion of the analysis, to include temporal changes on a larger scale. Finally, latitude and longitude were included in modelling to relate any remaining changes in spatial habitat distribution with minke whale occurrence.
Predictions of minke whale occurrence were made in R over a 4 × 4 km grid cell (dimensions twice the length of transect segments as suggested by Hedley, Reference Hedley2000) in the study area. Since we were mainly interested in spatial changes in minke whale habitat use, we assigned a single value for all temporally varying variables for spatial prediction: the average boat speed across all years in each group; Beaufort Sea State 1 (as the most minke whales were sighted at this sea state); July (given that minke sightings peaked during this month); and the year in which there were peak sightings (2011 and 2014, respectively). The other environmental variables were taken from the midpoints of each grid cell, and predictive values were calculated for both groups.
The final model was evaluated using the test set of data. The ability of the model to make predictions based on the test set (25% subsample) was tested by observing the receiver operating characteristics (ROC) graph and calculating the area under the curve (AUC) score, using the pROC package in R. The ROC indicates the balance between true and false positives in the predictive output of the model (Fawcett, Reference Fawcett2006).
Calculating the risk of entanglement
For both groups of years, the prediction values for minke whale occurrence and creel fleet occurrence were multiplied together to calculate an index called risk of entanglement (RoE) for each 4 × 4 km cell within the survey area (method adapted from Northridge et al., Reference Northridge, Cargill, Coram, Mandleberg, Calderan and Reid2010). Higher predictive values indicated a greater likelihood of minke-creel co-occurrence, and thus a higher entanglement risk, while lower predictive values indicated a lower likelihood of entanglement.
Identifying areas of consistent high risk
For each 4 × 4 km grid cell, the mean and standard deviation between RoE from each year grouping were calculated. The mean RoE indicated the risk level, which was divided into low (60% of cells), medium (20% of cells), and high (20% of cells). Standard deviation from the mean was used to indicate the consistency of risk, where lower standard deviation indicates higher consistency. For example, areas with a high mean RoE but with a low standard deviation were considered to have the most consistent high risk of entanglement. This information was presented in a map detailing the risk level as well as the standard deviation for each grid cell across the study area.
Results
Data exploration
During the seven-year study period (2008–2014) 44,799 km of survey effort were conducted off the west coast of Scotland. There was some variation in the survey effort between years with the lowest effort in 2012 (4443 km), and the highest effort in 2009 (7659 km). However, the seasonal coverage was comparable across years between March and October. For all years, from 2008 to 2014 combined, there were 0.00703 minke whale sightings/km and 0.414 creel fleet sightings/km. The highest density of minke whales was in 2011 (0.0094 sightings km−1) and the highest density of creel fleets was in 2013 (0.476 sightings km−1) (Table 1). The lowest density of minke whales was recorded in 2013 (0.00537 sightings km−1) and the density of creel fleets was lowest in 2010 (0.319 sightings km−1) (Table 1). Sightings of minke whales during the seven-year study period occurred throughout the survey area, whilst creel fleets were concentrated in coastal areas (Figure 2).
Habitat modelling and predictions
Spearman's rank correlation tests for both 2008–2011 and 2012–2014 revealed correlations (P < 0.05, −0.07 > r > 0.07) among sea state and swell, depth and CombEnergy, and substrate and CombEnergy. Additionally, for the years 2008–2011 there were correlations between depth and slope, and depth and substrate. Thus sea state was retained over swell, depth, and substrate over CombEnergy, and depth over slope and substrate during model training. When presented with a test set of data our models for minke whale occurrence scored AUC values of 0.882 (2008–2011) and 0.829 (2012–2014), showing good performance.
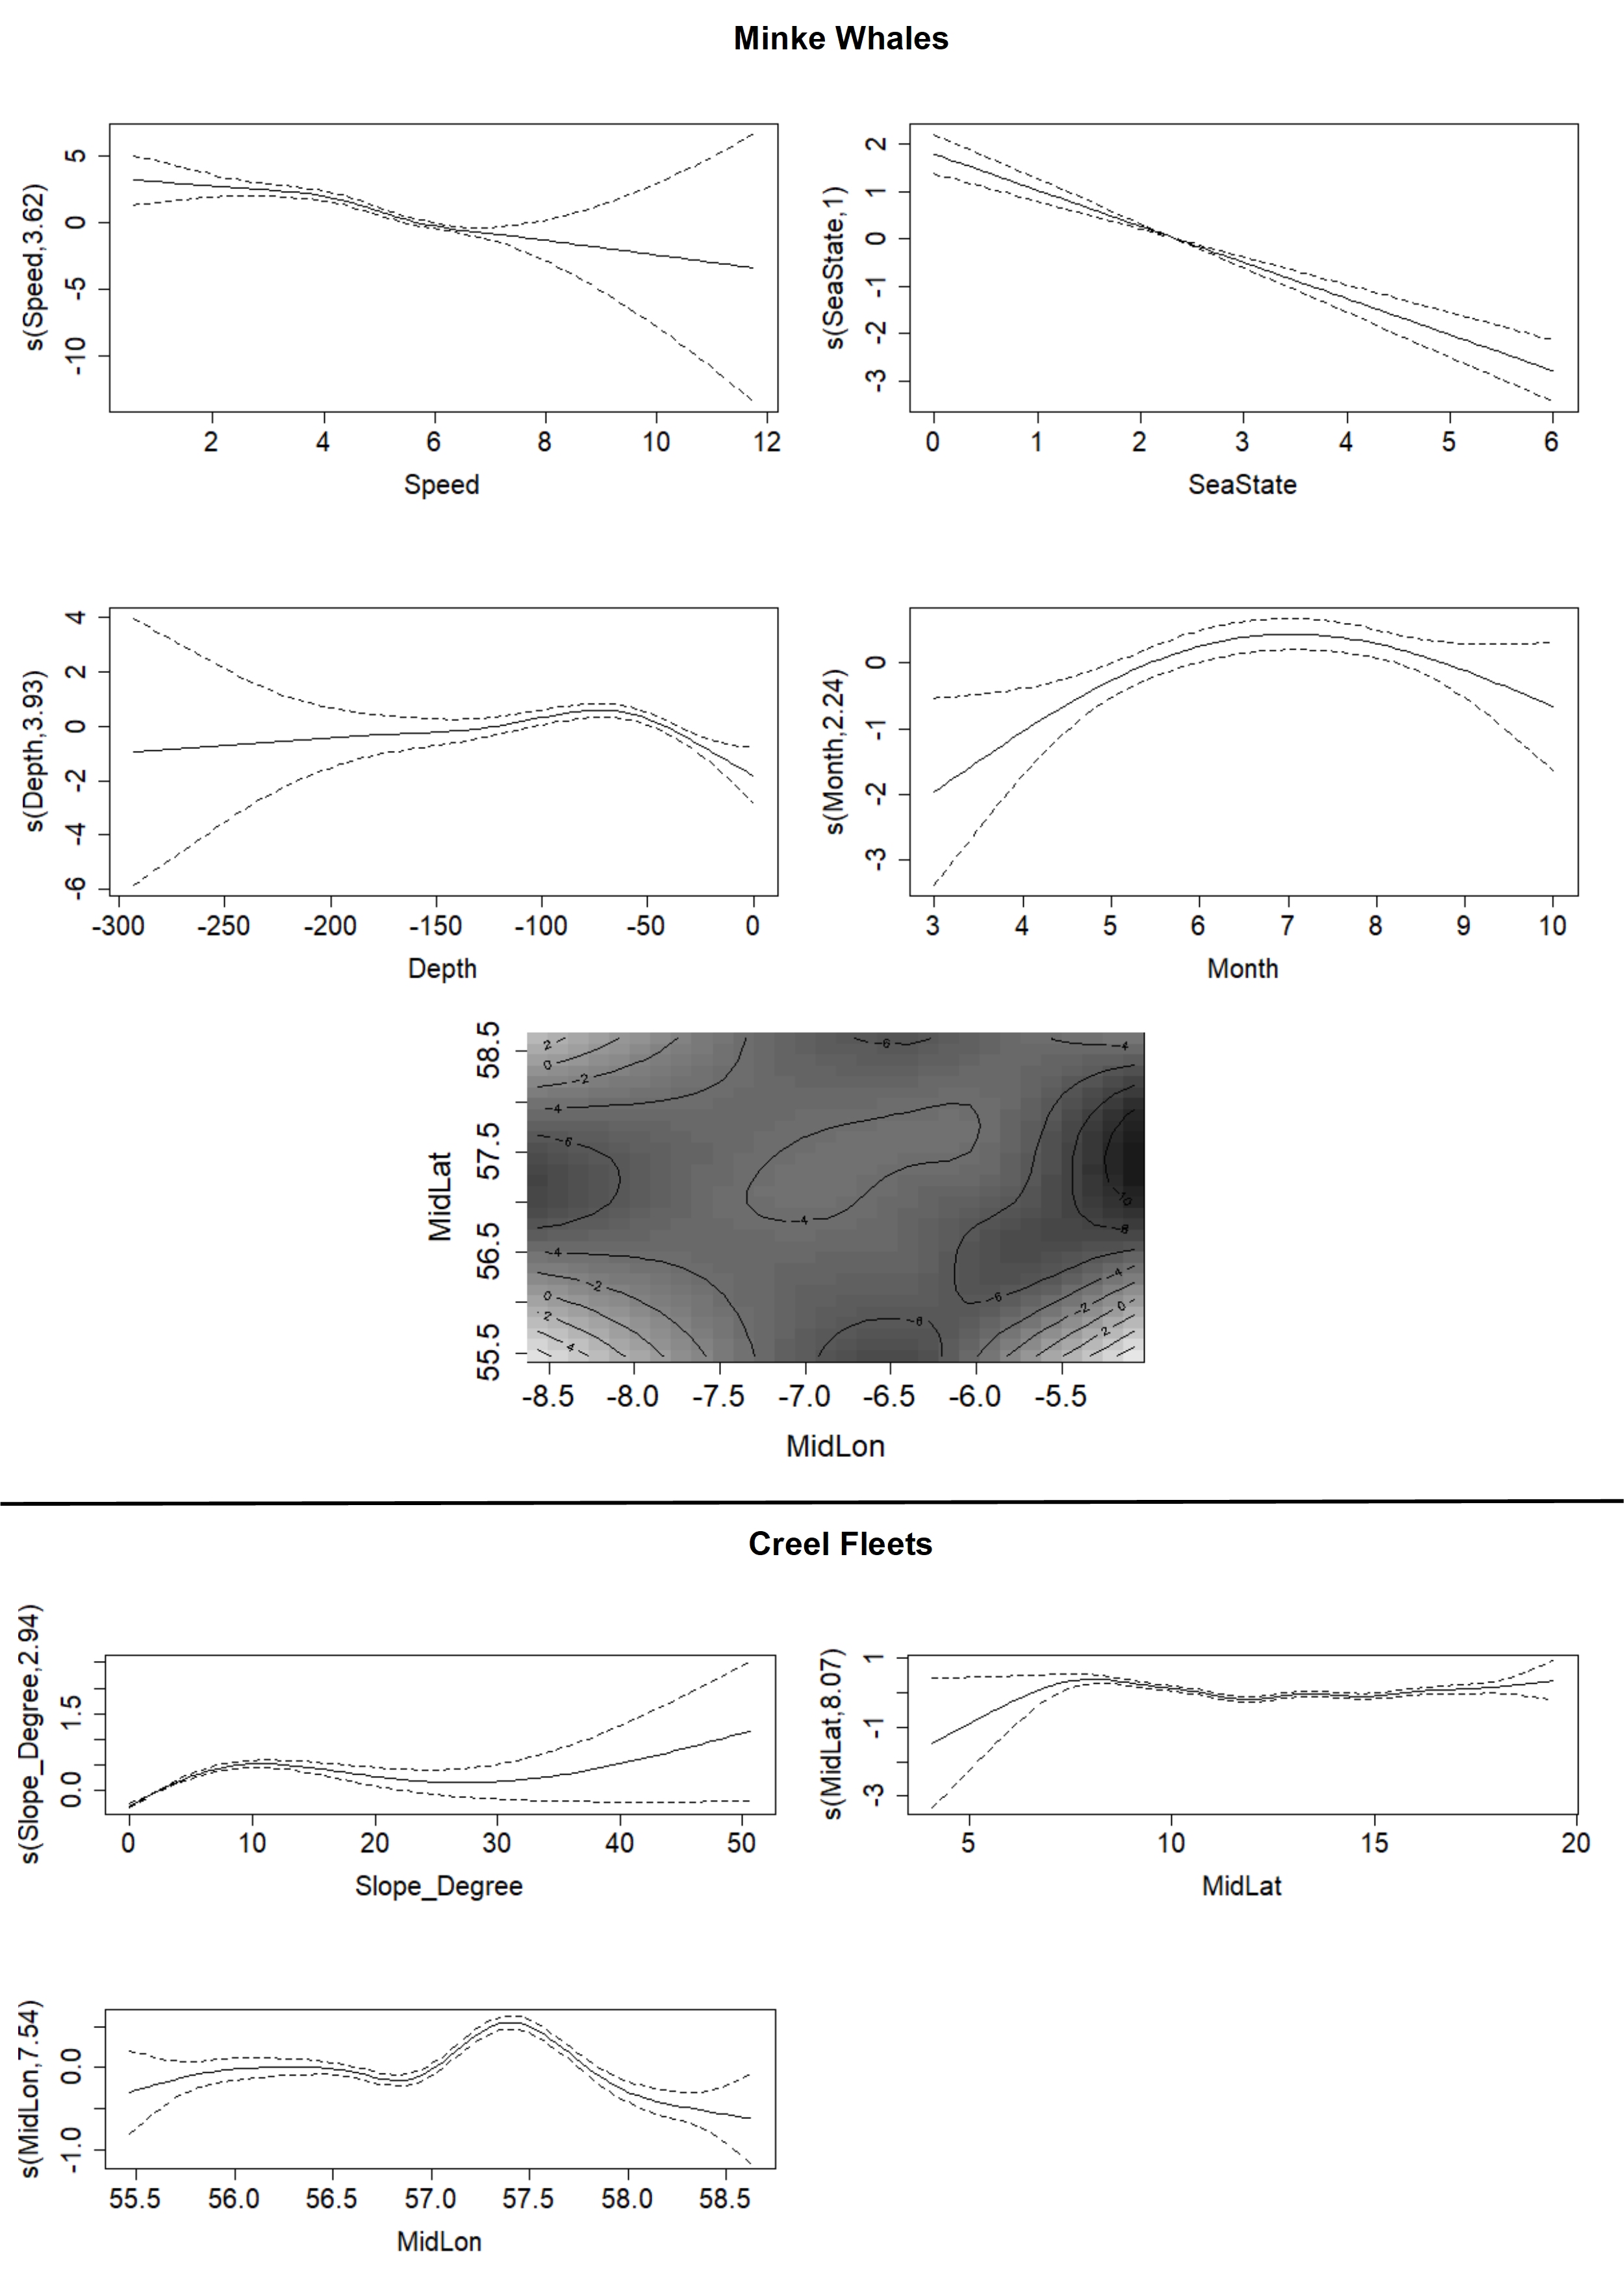
The final models revealed that minke whale occurrence was related to vessel speed, sea state, depth, month, and longitude in both year groups, and in 2012–2014 minke whale occurrence was also related to year (Figure 4). Minke whale occurrence models for 2008–2011 and 2012–2014 explained 22.7 and 23.0% deviance in the data respectively (Table 3). There was a decline in detected minke whale occurrence when vessel speed exceeded four knots (Figure 4). Minke whale occurrence also decreased as the sea state increased (Figure 4). In each year group, depth was the only environmental variable that could be related to minke whale occurrence, with peak occurrences at around 70 m and reduced occurrence at <40 m (Figure 4). Minke whale occurrence peaked in July (Figure 4).

Figure 4. Relationships between model terms and minke whale or creel fleet occurrence in the Hebrides in 2012–2014. Terms were related using GAMs. Solid lines indicate smooth estimate, and dashed lines indicate ± 2 standard error intervals around the mean.
Table 3. Summary of terms selected as predictors of minke whale and creel fleet occurrence on the west coast of Scotland during step-wise forward selection, and their influence on the model (GAM)

UBRE, unbiased risk estimator; edf, estimated degrees of freedom; P, probability.
All terms were smoothers unless specified.
The final models also showed that in 2008–2011 the occurrence of creel fleets was related to substrate, slope, latitude, and longitude, while in 2012–2014 they were related to slope, CombEnergy, depth, substrate, and longitude (Table 3). Final creel fleet occurrence models for 2008–2011 and 2012–2014 explained 16.9% and 25.7% deviance in the data, respectively (Table 3). There was a peak in the occurrence of creel fleets at water depths of 40 m, and a seabed slope of 10° (Figure 4). Creel fleet occurrence was related to CombEnergy with a peak of 3 (high energy), and substrate type with peak occurrence in sand and mud (Figure 4). Latitude and Longitude were also related to creel occurrence, with peaks around 57°N, 7.5°W, and 6°W (Figure 4).
Risk of entanglement
Risk of entanglement (RoE) was not evenly distributed throughout the study area, ranging from zero to 1524.7 in 2008–2011, and near zero (3.5 × 10⁻⁶) to 5.084 in 2012–2014 for 4 × 4 km cells. The large discrepancy between the two-year groups was a result of different variables being used in each predictive model. For cells a with a lower RoE value, there was a lower likelihood of a minke whale coinciding with creel fishing gear, based on habitat modelling and spatial overlap. In cells with higher RoE, there was the greatest likelihood of a minke whale coinciding with creel fishing gear, and therefore the greatest risk of an entanglement event. Our results indicate that risk of entanglement was highest around Raasay and the Inner Sound (Figure 5).

Figure 5. Consistent risk of entanglement in the Hebrides (2008–2014) based on habitat modelling and risk analysis. Darker cells within each risk level colour band indicate greater consistency of risk (lower standard deviation from the mean).
Consistent areas of high risk
Standard deviation from the mean ranged from 0 to 2.77 for high-risk cells, 0 to 0.019 for medium-risk cells, and 0 to 0.012 for low-risk cells (Figure 5). A low standard deviation from the mean indicated a greater consistency of risk level in that 4 × 4 km cell. Three areas that were identified as having a consistently high risk of entanglement were the Inner Sound and Sound of Raasay, east of North and South Uist, and north of The Small Isles (Figure 5). The areas with more consistent RoE are concordant with, albeit less widespread than, the areas of high RoE.
Discussion
This study considered the interaction between minke whales and the creel fishery in western Scotland, where entanglement has been identified as the largest cause of anthropogenic mortality for this species (Northridge et al., Reference Northridge, Cargill, Coram, Mandleberg, Calderan and Reid2010; MacLennan et al., Reference MacLennan, Leaper, Brownlow, Calderan, Jarvis, Hartny-Mills and Ryan2020). The level and consistency of risk for minke whale entanglement in creel fishing gear was unevenly distributed around the Hebrides, from 2008 to 2014. Areas were identified with a consistently medium or high risk of entanglement throughout the study period, where there was a greater probability of minke–creel interactions which may result in entanglement. Assuming that whale distribution and fishing efforts continue to overlap, this information highlights appropriate locations to further study or mitigate against entanglement.
RoE and risk consistency
High- and medium-risk areas were highly clumped and mostly coastal, chiefly driven by higher creel densities. Three discrete areas stand out for exhibiting relatively consistent high risk: the Inner Sound and Sound of Raasay, east of North and South Uist, and north of the Small Isles. As this study only used data collected during summer months, we cannot provide a year-round understanding of risk consistency throughout 2008 and 2014. However, both minke whale occurrence and creel fishing peak during the summer (Northridge et al., Reference Northridge, Cargill, Coram, Mandleberg, Calderan and Reid2010), and therefore the time period reported here is the most relevant for informing management of minke–creel entanglement.
Our results are comparable with previous research by Northridge et al. (Reference Northridge, Cargill, Coram, Mandleberg, Calderan and Reid2010) and MacLennan et al. (Reference MacLennan, Hartny-Mills, Read, Dolman, Philp, Dearing, Jarvis and Brownlow2021), who identified areas of high risk for minke whale entanglement in creel gear around Scotland, and MacLennan et al. (Reference MacLennan, Leaper, Brownlow, Calderan, Jarvis, Hartny-Mills and Ryan2020, Reference MacLennan, Hartny-Mills, Read, Dolman, Philp, Dearing, Jarvis and Brownlow2021), who investigated incidents of whale entanglement in Scotland. Our findings are consistent with these studies in finding the highest risk levels and incidence of entanglement around Skye, Raasay, and the Uists. MacLennan et al. (Reference MacLennan, Hartny-Mills, Read, Dolman, Philp, Dearing, Jarvis and Brownlow2021) reported the same high-risk areas to the East of North Uist, around Rasaay, and the Small Isles that have been identified here. Northridge et al. (Reference Northridge, Cargill, Coram, Mandleberg, Calderan and Reid2010) showed that there were greater amounts of creel fishing gear around South Uist as well as the Inner Sound near Skye. This is supported by our results, which show medium and high consistent RoE cells in each of these areas (Figure 5). Northridge et al. (Reference Northridge, Cargill, Coram, Mandleberg, Calderan and Reid2010) also reported high-risk areas around the Small Isles, similar to the high-risk areas we identified there, most notably to the north. The Clyde region was also classed as high risk, albeit with a higher standard deviation (Figure 5), as effort was minimal in this area (Figure 3). The predictions generated for the Clyde region and any other areas with limited survey data should be interpreted with caution. Despite taking effort into consideration (by removing low effort grids), the Clyde area only had one minke whale sighting and relatively low density of creel fleets. Further refinement of the methodology outlined here, for example, using stricter rules on the exclusion of low effort or low sightings areas, may improve the predictions.
High RoE areas generally match the areas with the highest amount of minke whale strandings and reported entanglements in Scotland (Northridge et al., Reference Northridge, Cargill, Coram, Mandleberg, Calderan and Reid2010; MacLennan et al., Reference MacLennan, Hartny-Mills, Read, Dolman, Philp, Dearing, Jarvis and Brownlow2021; Leaper et al., Reference Leaper, MacLennan, Brownlow, Calderan, Dyke, Evans, Hartny-Mills, Jarvis, McWhinnie, Philp, Read, Robinson and Ryan2022). Leaper et al. (Reference Leaper, MacLennan, Brownlow, Calderan, Dyke, Evans, Hartny-Mills, Jarvis, McWhinnie, Philp, Read, Robinson and Ryan2022) presented all the stranded minke whale entanglement cases determined and assessed by the Scottish Marine Animal Stranding Scheme (SMASS) between 2008 and 2019 and those documented from fisher interviews. Our results are in accordance with the distribution of reports of entanglement cases from interviews, but not those from strandings found and reported to SMASS (Figure 3 in Leaper et al., Reference Leaper, MacLennan, Brownlow, Calderan, Dyke, Evans, Hartny-Mills, Jarvis, McWhinnie, Philp, Read, Robinson and Ryan2022). The discrepancy between interview-based and strandings-based cases appears to be greatest along the eastern coasts of North and South Uist and western Skye: areas where our analysis predicted a high risk of entanglement (Figure 5). It is possible that strong tides in this area drift carcasses away from here, coupled with a lower probability of strandings being found and reported to SMASS due to the inaccessible nature of these coastlines.
The consistently high-risk areas around the Small Isles and South Uist, fall within a designated Marine Protected Area (MPA) for minke whales (NatureScot, 2020), however, the areas identified around Raasay do not. Risk ought to be continually monitored as it is likely to change with the fluctuating distribution of whales and creel fleets, in addition to evolving fisheries management scenarios. The introduction of management measures in this region should be implemented in a way that ensures fishing effort is not displaced into other areas with high densities of animals, or around the MPA boundary (as in Burke, Reference Burke2015; Rees et al., Reference Rees, Sheehan and Attrill2021).
Risk analysis can be used to observe spatial overlap between two potentially conflicting components. In marine mammal ecology, risk analysis has been used to study interactions between whale populations and human activity such as shipping, coastal development, and by-catch (Hatch et al., Reference Hatch, Clark, Merrick, Van Parijs, Ponirakis, Schwehr, Thompson and Wiley2008; Ritter, Reference Ritter2010; Williams and O'Hara, Reference Williams and O'Hara2010; Erbe et al., Reference Erbe, MacGillivray and Williams2012; Martins et al., Reference Martins, Andriolo, Engel, Kinas and Saito2013; Gilman et al., Reference Gilman, Owens and Kraft2014; Brown et al., Reference Brown, Reid and Rogan2015). Studying spatial overlap is of value to conservation and management actions, as it provides a means to locate areas of high risk where preventative efforts would be the most effective (Brown et al., Reference Brown, Reid and Rogan2015). Whilst previous cetacean research has used modelling and spatial overlap techniques to identify high-risk areas (Hatch et al., Reference Hatch, Clark, Merrick, Van Parijs, Ponirakis, Schwehr, Thompson and Wiley2008; Herr et al., Reference Herr, Fock and Siebert2009; Ritter, Reference Ritter2010; Williams and O'Hara, Reference Williams and O'Hara2010; Erbe et al., Reference Erbe, MacGillivray and Williams2012; Martins et al., Reference Martins, Andriolo, Engel, Kinas and Saito2013; Redfern et al., Reference Redfern, Mckenna, Moore, Calambokidis, Deangelis, Becker, Barlow, Forney, Fiedler and Chivers2013; Sims et al., Reference Sims, Cox and Lewison2008) to inform management (Brown et al., Reference Brown, Reid and Rogan2015), the consistency of risk levels over time has not been considered. Given that human use of the marine environment is constantly changing, it is important not to rely on temporal snapshots of data when assessing risk. Here we have developed a methodology for measuring risk consistency, which can be used to observe changes in risk, temporally as well as spatially.
Understanding the ways in which risk levels can vary or persist in different areas may be of importance in policy-making, conservation, and fisheries management, since it is more cost and effort efficient to take preventative action in areas where high risk is consistent, rather than where risk levels have fluctuated. Measuring risk consistency could be applied to a wide range of risk interactions in the marine environment, including those currently predominant in the literature such as cetacean-shipping conflicts (e.g. Ritter, Reference Ritter2010; Williams and O'Hara, Reference Williams and O'Hara2010; Erbe et al., Reference Erbe, MacGillivray and Williams2012; Redfern et al., Reference Redfern, Mckenna, Moore, Calambokidis, Deangelis, Becker, Barlow, Forney, Fiedler and Chivers2013). This method will be the most effective when used with quantitative data on environmental factors. Lastly, it is beyond the scope of this study to suggest mitigation measures to reduce the risk of entanglement in minke whales. However, efforts are ongoing in an industry-led approach through the Scottish Entanglement AllianceFootnote 1 to determine what measures will be most appropriate to mitigate against whale entanglement in this fishery. Lessons learned from where this issue has arisen elsewhere indicate that successful approaches are likely to be those led by fishers. Indeed, there is currently a willingness to do so in Scotland, with mitigation measures such as the use of sinking lines as well as ropeless gear being tested (MacLennan et al., Reference MacLennan, Hartny-Mills, Read, Dolman, Philp, Dearing, Jarvis and Brownlow2021; Leaper et al., Reference Leaper, MacLennan, Brownlow, Calderan, Dyke, Evans, Hartny-Mills, Jarvis, McWhinnie, Philp, Read, Robinson and Ryan2022). The modelling approach used here to assess entanglement risk is a useful tool to identify areas where these mitigation methods will be the most effective.
Habitat modelling
Habitat modelling is a powerful tool for understanding the interactions between species occurrences and the wide range of variables that influence them (Canadas et al., Reference Canadas, Sagarminaga, De Stephanis, Urquiola and Hammond2005; Redfern et al., Reference Redfern, Ferguson, Becker, Hyrenbach, Good, Barlow, Kaschner, Baumgartner, Forney, Balance, Fauchald, Halpin, Hamazaki, Pershing, Qian, Read, Reilly, Torres and Werner2006). Cetaceans are mobile species that spend the majority of their time submerged, and therefore studying occurrence based on sightings records of these animals is inherently limited, and habitat modelling can provide a more complete picture of habitat use. In this study, generalized additive modelling (GAM) was used to relate the observations of minke whales to vessel speed, sea state, depth, month, year, latitude, and longitude. Models for each year group scored AUC > 0.75, which indicates good model performance (Elith et al., Reference Elith, Graham, Anderson, Dudik, Ferrier, Guisan, Hijmans, Huettmann, Leathwick, Lehmann, Li, Lohmann, Loiselle, Manion, Moritz, Nakamura, Nakazawa, Overton, Peterson, Phillips, Richardson, Scachetti-Pereira, Schapire, Soberon, Williams, Wisz and Zimmermann2006; Best et al., Reference Best, Halpin, Read, Fujioka, Good, LaBrecque, Schick, Roberts, Hazen, Qian, Palka, Garrison and McLellan2012). The model results also align with actual minke whale and creel sightings (Figure 2), even those not used in model training, thus the model can be considered a good fit to the data (Lobo et al., Reference Lobo, Jimenez-Valverde and Real2008). Minke whale sightings were related to boat speed and sea state, which are known to affect both availability and perception biases respectively and therefore help to compensate for these effects (Barlow, Reference Barlow1999; Macleod et al., Reference Macleod, Fairbairns, Gill, Fairbairns, Gordon, Blair-Myers and Parsons2004). Of the environmental variables, minke whale occurrence was related to depth, showing a peak around 70 m. This is consistent with previous research that suggests a peak occurrence at 60 m (Skov et al., Reference Skov, Durink, Danielsen and Bloch1995; Hooker et al., Reference Hooker, Whitehead and Gowans1999; Ainley et al., Reference Ainley, Jongsomjit, Ballard, Thiele, Fraser and Tynana2012; Anderwald et al., Reference Anderwald, Evans, Dyer, Dale, Wright and Hoelzel2012), though it can depend on the habitat available (Naud et al., Reference Naud, Long, Brethes and Sears2003).
Our models related creel fleets to inshore areas, with peak occurrence in areas with sandy and muddy seabed, sloped at 10 degrees, around depths of 40 m, with high levels of tidal and wave movement. These findings are in line with previous sightings reports of higher densities of creel fleets in the coastal waters of western Scotland (Northridge et al., Reference Northridge, Cargill, Coram, Mandleberg, Calderan and Reid2010). Whilst minke whales eat a range of prey species in some areas, in Scottish waters they mainly feed on lesser sand eel (Nordoy and Blix, Reference Nordoy and Blix1992; Olsen and Holst, Reference Olsen and Holst2001; Macleod et al., Reference Macleod, Fairbairns, Gill, Fairbairns, Gordon, Blair-Myers and Parsons2004; Pierce et al., Reference Pierce, Santos, Reid, Patterson and Ross2004), which occupies sandy substrates during spring. Therefore, it has been suggested that minke whales are found in areas with sandy sediments (Naud et al., Reference Naud, Long, Brethes and Sears2003) where they can find their prey. Although our models could not relate minke occurrence to seabed substrate, it is likely that minke whales show the same preference for the sandy substrate as the creel fishery, due to feeding. The use of categorical sediment data in this study may have prevented the relation of seabed substrate to minke whale occurrence, and future research might consider the use of continuous data (e.g. Embling et al., Reference Embling, Gillibrand, Gordon, Shrimpton, Stevick and Hammond2010). Such an approach would need to accommodate prey-switching by minke whales from sand eel to spawning clupeids which occurs in late summer (Macleod et al., Reference Macleod, Fairbairns, Gill, Fairbairns, Gordon, Blair-Myers and Parsons2004).
Finally, there were several temporal variables included in the final models for minke whales. The month was related to minke whale occurrence, with a peak in July, which is concurrent with previous research (Northridge et al., Reference Northridge, Cargill, Coram, Mandleberg, Calderan and Reid2010). The year was also related to minke whale occurrence, with peaks in the years 2012 and 2014. Minke whales are likely to vary inter-annually, however, sightings and survey efforts also vary with weather conditions (Teilmann, Reference Teilmann2003). Latitude and longitude were also related to both minke whale occurrence and creel fleet sightings, showing a slight increase in occurrence towards lower and higher longitudes within the study area (Figure 4E). This indicates a preference for inshore waters, closer to land, although it could also be influenced by survey efforts.
Habitat modelling can be of great value to conservation, and there is a growing demand for this type of research to support management decisions (Redfern et al., Reference Redfern, Ferguson, Becker, Hyrenbach, Good, Barlow, Kaschner, Baumgartner, Forney, Balance, Fauchald, Halpin, Hamazaki, Pershing, Qian, Read, Reilly, Torres and Werner2006). In the past, modelling has been used to support the development of marine protected areas (Hooker et al., Reference Hooker, Whitehead and Gowans1999; Canadas et al., Reference Canadas, Sagarminaga, De Stephanis, Urquiola and Hammond2005; Embling et al., Reference Embling, Gillibrand, Gordon, Shrimpton, Stevick and Hammond2010), as well as to understand cetacean interactions with fisheries (Torres et al., Reference Torres, Rosel, D'Agrosa and Read2003; Kaschner, Reference Kaschner2004). Here, habitat modelling has allowed for a more robust understanding of minke whale habitat use and creel fleet occurrence in western Scotland, beyond the various limitations of scientific surveys.
Conclusion
Studying the overlap between potentially conflicting components is a useful tool for identifying critical areas of high risk in which to focus management (Brown et al., Reference Brown, Reid and Rogan2015). Whale entanglements result in economic losses to fishers, and are the leading cause of non-natural whale mortality in the UK (Northridge et al., Reference Northridge, Cargill, Coram, Mandleberg, Calderan and Reid2010). Annual entanglement deaths were estimated to be around 2.2% of the abundance estimate for this study area (MacLennan et al., Reference MacLennan, Leaper, Brownlow, Calderan, Jarvis, Hartny-Mills and Ryan2020). Minimizing negative human impacts on this species where possible is a welfare priority and should serve as an early warning in terms of conservation management (Papastavrou et al., Reference Papastavrou, Leaper and Lavigne2017). Presently, any increase in minke whale density will increase minke whale mortality in the Hebrides. Our study presents a methodology for identifying key areas where entanglement mitigation measures ought to be prioritized, and a way to monitor risk on an ongoing basis as fisheries scenarios change. By estimating risk consistency, our approach could provide advice to management that accounts for changes in entanglement risk.
Supplementary Material
The supplementary material for this article can be found at https://doi.org/10.1017/S0025315423000930
Acknowledgements
We extend our thanks to all the volunteers, staff and crew, past and present, who have contributed to the Silurian monitoring programme at the Hebridean Whale and Dolphin Trust, without which this work would not have been possible. Thank you to Dan Țicărat for illustrating a generalized creel fleet diagram.
Financial Support
The Hebridean Whale and Dolphin Trust's long-term, boat-based species monitoring programme has been supported by members, donors, and funders over the past 18 years including: Heritage Lottery Fund, The Nàdair Trust, NatureScot (formally Scottish Natural Heritage), WWF-UK, Coastal Communities Fund, William Grant Foundation and Sea-Changers.


 Open access