


Introduction
Tests of the flexural strength of temperate lake ice have been performed at two test sites in New Hampshire, U.S.A. The first series of tests, conducted during the 1973–74 winter, was restricted to in situ cantilever beams. These tests yielded a maximum strength of 7.1 kg cm-2 (7 × 1O5 N m-2). The minimum strength, unrelated to failure along pre-existing cracks in the ice, was 2.9 kg cm-2 (2.8 × 10⁵ N m-2). The results compare favorably with those obtained by Reference FrankensteinFrankenstein (1959) on a combination cover of snow-ice underlain by lake ice, similar to that tested in the present series of measurements. Frankenstein's measurements ranged from a maximum of 9.1 kg cm-2 (8.9 × 10⁵ N m-2) to a minimum of 0.8 kg cm-2 (0.8 × 10⁵ N m-2). Most of the present tests were performed in the push-down mode after it was discovered that beams tested in the pull-up mode, which places the bottom surface in tension, frequently break prematurely along cracks in the bottom of the ice. Premature failures of this kind usually occurred at stresses of 2–3 kg cm-2 (2–3 × 10⁵ N m-2). Data further demonstrated (see Fig. la) that the intrinsic strength of lake ice decreased significantly as the surface temperature went to 0°C. Ice that had just become isothermal, but had not yet begun to candle, had a strength of about 4 kg cm-2 (3.9 × 10⁵ N m-2); ice that had been subjected to prolonged periods of air temperatures above freezing point generally failed at stresses of 3 kg cm-2 (2.9 × 10⁵ N m-2) or less (see Fig. 1b). Tests also indicated that cold, unrecrystallized snow-ice is as strong as the underlying lake ice. However, high-temperature deterioration of the snow-ice layer can lead to a very significant decrease in the effective thickness of the ice cover. For example, in the tests of 3 April (Fig. 1b) the snow-ice layer degenerated into a weak condition during testing and this decay, while not causing any change in the actual thickness of the ice cover, caused the intrinsic strength of the ice to decrease by about 25% over that of an isothermal but structurally unmodified ice sheet. Tests of the effect of crystalline structure suggest that ice composed of crystals with their c-axes horizontal is stronger than ice in which the c-axes are oriented vertically. Further details of this series of tests are reported in Reference Gow and LangstonGow and Langston (1975).

Fig 1. Cantileuer beam test data showing (a) variation of flexural strength with temperature and (b) near-constant strength of partially candled, isothermal lake ice. On 3 April, the top 60 mm of snow-ice had been reduced to an essentially strengthless condition, thereby reducing the effective thickness of the ice from 400 to 340 mm. Data denoted by open circles, were computed on the basis of the absolute thickness (400 mm) of the ice cover.
The cantilever test was chosen mainly for its convenience. It is a relatively simple test that has been widely used to measure the flexural strength of river ice and sea ice as well as lake ice. However, the generally low values of flexural strength obtained with cantilever beams in the present series of tests aroused suspicions that the test results were being unduly influenced by external stress concentrations at the butt ends of the beams. Comparative tests of in situ cantilever and simply supported beams by Reference ButyaginButyagin (1966) do not seem to show any significant difference in failure strength that can be attributed to external stress concentrations. Reference FrankensteinFrankenstein (1968) also believes that if a stress concentration exists at the butt end of the cantilever beam then the effect must be very small. However, Reference Brown and KingeryBrown (1963) infers from tests made on “Plexiglass” that the stress concentration factor for sea-ice beams could be as high as 2.8. In an attempt to resolve this question, a test device was fabricated which permits beams used in the cantilever tests to be tested in the simply supported mode as well, and this automatically eliminates any possibility of external stress concentrations. It is the purpose of this paper to present the results of this dual beam test program.
Details of the tests
Test sites and ice-cover properties
The majority of tests were performed on Post Pond, located near Lyme, New Hampshire. Additional tests were also performed on Canaan Street Lake situated near the town of Canaan, New Hampshire. Tests were begun in February 1975 and completed during the winter of 1975–76.
Typically, the ice cover on both lakes was composed of two major ice components: true lake ice, formed by the freezing of lake water; and snow-ice which overlies the lake ice and is formed by the freezing of water-saturated snow.
Vertical sections of ice-sheet stratigraphy and structure from Post Pond are presented in Figure 2. The structure in an ice beam from Canaan Street Lake is illustrated in Figure 3. In both sections of ice from Post Pond the lake ice can be distinguished easily from the overlying snow-ice. Crystals in the structural section (Fig. 2) are all oriented with their c-axes vertical. Occasionally, crystals with sub-horizontal c-axes occur in the top or earliest-formed ice but such crystals are soon eliminated in favor of crystals with vertical c-axes. The transition to equi-granular snow-ice is especially well marked in the structure section. Both lakes developed vertical c-axis structure during the 1974–75 winter and essentially identical structure was observed in the winter ice cover of 1975–76. It is of interest to note that fluctuations in freezing rate, as clearly reflected in the bubble stratigraphy (Fig. 2), appear to have exerted little effect on the crystalline texture or fabric of the ice.

Fig 2. (left) Vertical sections illustrating (left) stratigraphic and (right) structural characteristics of a lake ice sheet, Post Pond, New Hampshire. Transition from snow-ice to lake ice is especially well marked. Lake ice is composed entirely of crystals with vertical c-axes.

Fig 3. (top right) Side view of ice beam showing white snow-ice component overlying distinctively stratified lake ice. In this example of ice from Canaan Street Lake, New Hampshire, the snow-ice and lake-ice components are present in about equal amounts.
Bulk density measurements show that the porosity of even the most bubbly ice rarely exceeds 3–4%. In the case of snow-ice, the porosity seldom exceeded 5%.
Apart from the entrapment of air bubbles, the freezing of water on both Post Pond and Canaan Street Lake resulted in substantial elimination of dissolved solids, the electrolytic conductivity of the melt water rarely exceeding 2 × 10⁻⁷ Ω-1 mm-1 compared with 4–8 × 10⁻⁶ Ω-1 mm-1 for the original lake water.
Beam testing
Actual test sites were carefully examined to ensure that they were as crack-free as possible. The general technique for preparing beams for cantilever tests is demonstrated in Figure 4. The object is to cut slots in the ice so as to isolate a U-shaped beam with its butt end still attached to the ice sheet. The beam is then loaded to failure to determine its flexural strength. Beam breaking was accomplished by means of a hydraulic jack and the force was measured directly with the aid of a proving ring and dial gage mounted on the unsupported end of the ice beam. With this technique the beam could be loaded to failure in less than 10 s. The flexural strength σf of the beam was determined according to the relation

Fig 4. (middle right) Preparing the ice for in situ cantilever beam tests. Also note the beam breaker device set up for a push-down test.
where P is the applied force, L the length of the beam, w the width of the beam, and h the ice thickness.
The test apparatus and the technique for measuring the flexural strength of simply supported center-loaded beams are illustrated in Figure 5. The test device consists of a reinforced aluminum frame fitted with end members to support the ice beam. The frame is placed in position over a slot in the ice and then adjusted until the bottom of the free-floating beam makes contact with the end supports. The beam is floated into position and the force is applied to the center of the ice beam by means of a manually operated screw jack to which is attached a load cell. By means of this technique the ice beams could be loaded to failure within 20 to 60 s. The load cell is connected to an amplifier and strip-chart data recorder. The effective length of the beam is determined by the distance between the supports, which in the current series of tests was maintained at 2.75 m. The beam breaker is designed to accommodate beams up to 0.6 m thick. With this device the cantilever beams can be easily rolled over in the water so as to facilitate testing with either the top or bottom surface in tension. The beam widths and thicknesses were approximately the same, and their lengths were maintained at between five and eight times the ice thickness. Ice beam thickness and width were measured to the nearest 5 mm; beam lengths were measured to the nearest 10 mm. During testing, frequent measurements of air temperatures were made 0.1 m above the ice surface.

Fig 5. Close-up view of device used for measuring the flexural strength of simply supported center-loaded ice beams.
The flexural strength σf of the simply supported beams was computed according to the relationship
where P is the force at failure, L is the length of the beam, and w and h are the width and the thickness of the ice beam respectively.
Results
The current series of tests involved measurements of 136 beams in the cantilever mode. Of this number, 90 beams were also tested in the simply supported mode. All cantilever tests were confined to push-down tests, which place the top surface of the ice cover in tension. Measurements of simply supported beams were about equally divided between tests with the top surface in tension and the bottom surface in tension. Fracture surfaces at the butt end of the cantilever beams were generally planar and vertical. A notch extending inwards about 10–20 mm from the fracture surface and 20–30 mm up from the bottom surface (compression surface) is especially characteristic. Occasional “short” breaks could always be traced to pre-existing cracks in the ice. Most of the freely supported beams failed at the center along a fracture surface that was generally vertical and planar. However, in the cases of “off-center” breaks (these generally comprised less than 30% of the failures in any test series), the fracture surfaces tended to be curved in the manner described by Reference LavrovLavrov (1969, p. 38).
Some typical results obtained with eight separate series of beam tests (two series from Canaan Street Lake and six from Post Pond) are shown in Tables I-VIII. Beams are identified according to which surface was placed in tension during the test. TT signifies the beam was tested with the top surface in tension; BT signifies the beam was tested with the bottom surface in tension. Ratios of strengths for the different types of tests were also calculated.
Table I. Beam Test Data, Canaan Street Lake, 6–7 March 1975

Table II. Beam Test Data, Canaan Street Lake, 12 March 1975
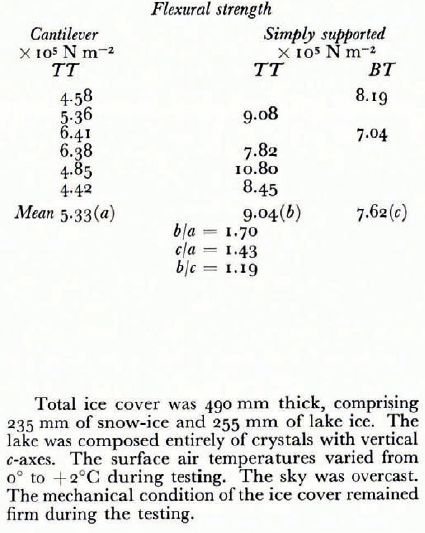
Table III. Beam Test Data, Post Pond, 3 March 1975

Table IV. Beam Test Data, Post Pond, 22 January 1976
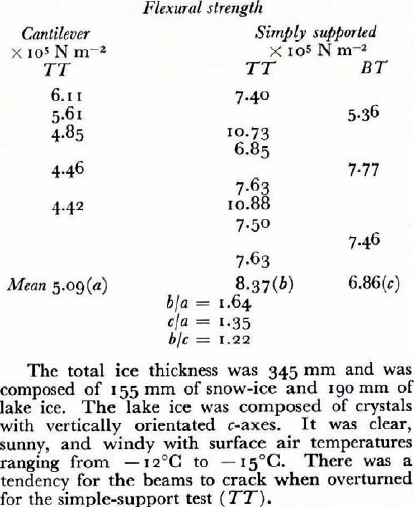
Table V. Beam Test Data, Post Pond, 4 February 1976

Table VI. Beam Test Data, Post Pond, 5 February 1976
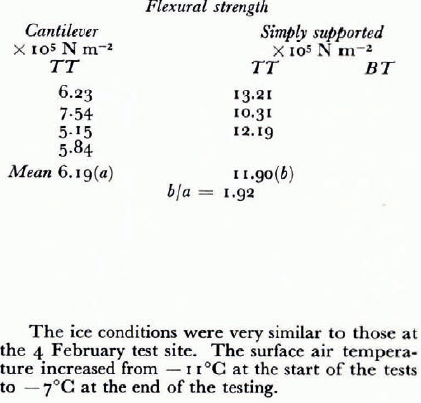
Table VII. Beam Test Data, Post Pond, 26 February 1976

Table VIII. Beam Test Data, Post Pond, 15 March 1976

Discussion
In all tests reported here the ice cover was of composite structure and included a more substantial proportion of snow-ice than is usually the case for lakes in New Hampshire. Stratigraphic and crystalline characteristics of the underlying lake ice were essentially identical at both sites during 1975 and these conditions did not change significantly in 1976. The highest flexural strengths were obtained on sheets of cold lake ice, unaffected by cracking or thermal degradation (i.e. candling, Tables V and VI). These observations imply that the strength on any particular day is sensitive to both the ambient air temperature arid to the prior history of weather conditions which largely determine the mechanical state of the ice at the time of testing.
In cold, structurally unmodified ice, simply supported, center-Ioaded beams generally yielded much higher flexural strengths than the same beams tested in the in situ cantilever mode. This was especially true of simply supported beams tested with tension induced in the top (snow-ice) surface (Fig. 6). Only after the ice cover has been subjected to prolonged periods with the air temperature above freezing does this difference in flexural strength between simply supported and cantilever beams begin to diminish (see, for example, Tables VII and VIII). The ratios of strengths for the beams tested with the top surface in tension frequently exceeded 2.0 in individual tests but a mean value of between 1.2 and 1.7 appears to be more typical of the tests as a whole. These test data deviate appreciably from those of Reference ButyaginButyagin (1966) who detected no significant differences in the flexural strength of cantilever and simply supported beams. However, our results agree generally with those obtained by Reference FrankensteinFrankenstein (1961). In three separate series of tests involving cantilever and simply supported beams with tensions induced in the top surface, Frankenstein's data are found to yield b/a values of 1.71, 3.40 and 1.26 respectively.

Our tests also show that simply supported beams generally give larger flexural strengths when the top surface is in tension. These differences (expressed as b/c ratios in Tables IȁVIII) also tend to diminish in ice that has undergone extensive structural modifications, especially thermal degradation leading to granulation of the snow-ice layer. In three similar series of tests by Reference FrankensteinFrankenstein (1961), a re-evaluation of his data in terms of b/c ratios has yielded values of 1.44, 1.10 and 1.49. These ratios agree very closely with results from the current series of tests. Our b/c ratios occasionally exceed 2.0 but the mean values are generally located in the range of 1.2–1.6.
The top layer of all beams tested in the current series of measurements was composed of snow-ice. The observation that simply supported beams were stronger when the top of this layer was placed in tension is entirely compatible with the mechanical properties of snow-ice; it is characteristically fine-grained and firmly bonded at sub-freezing temperatures and is generally crack-free. The bottom ice, by contrast, is usually composed of very large crystals, is always at temperatures close to its melting point, and is usually intersected by cracks—factors that collectively could be expected to cause beams to fail more rapidly when tension is applied to the bottom surface. It is perhaps significant that beams in which the major component is snow-ice also yielded the highest flexural strengths—both in the simply supported and cantilever modes. Flexural strengths in excess of 15 × 105 N m-2 (see Table V) obtained with this kind of ice are among the highest ever reported with large simply supported beams.
Our method of testing ice beams differs from the procedures of most other researchers in that the same beam is used for both tests. This ensures that the cross-sectional dimensions and structure of the beam are kept constant and that the temperature of the beam will not change substantially during testing. Accordingly, the generally lower strengths observed with the cantilever tests must be due either to the existence of an appreciable stress concentration at the corners of these beams or to fundamental differences in the failure mechanics of simply supported and cantilever beams.
Both Reference ButyaginButyagin (1966) and Reference LavrovLavrov (1969) argue against the existence of significant external stress concentrations: Butyagin on the basis of comparative tests that failed to demonstrate any apparent difference in the strengths of simply supported and cantilever beams, and Lavrov on the basis of tests performed on cantilever beams with their corners flared to reduce external stress concentrations. However, Lavrov, unlike Butyagin, acknowledges the fact that the flexural strengths of simply supported beams generally exceed those of cantilever beams.
Lavrov attributes these differences in strength to differences in the mechanics of failure of cantilever and simply supported beams. He suggests that the bending strength of the ice cover can be obtained from cantilever tests by multiplying the measured strengths by a correction factor that varies with the length-to-thickness ratio of the beams. For beams with a length-to-thickness ratio of 7 to 8, this factor is about 1.5 which agrees rather well with the average strength difference factor we observed in our tests. A similar strength differ ence factor was also observed in the several series of tests conducted by Reference FrankensteinFrankenstein (1961).
Our explanation of the current series of tests is that a significant stress-concentration factor may exist in the case of cantilever beams, but that the magnitude of the stress concentration depends critically on the thermal and structural condition of the ice. In the case of cold, brittle ice this factor may exceed 2.0 if the strength difference ratio (b/a) can be a ttributed entirely to stress-concentration effects. In ice that has undergone extensive thermal degradation, any appreciable loss of cohesion between grains and crystals in the ice is probably sufficient to override stress concentration effects at the fixed corners of cantilever beams. This condition apparently occurs when flexural strengths fall below about 3 × 10⁵ N m-2. In ice of intermediate strength, the strength difference ratio tends to be in the range of 1.2–1.7.
Conclusions
Parallel testing of large in situ cantilever and simply supported beams of lake ice have yielded the following data on flexural strengths.
1. Center-loaded simply suppor ted ice beams generally yield much higher flexural strengths than the same beams tested in the cantilever mode. Strength difference ratios frequently exceeded 2.0. Ice of intermediate flexural strengths generally gave ratios of 1.2–1.7. Strength difference ratios were reduced to about 1.0 when the average flexural strength fell below about 3 × 10⁵ N m-2. A maximum strength of 15.80 × 10⁵ N m-2 was obtained with a simply supported beam with tension induced in the top layer ; the same beam tested in the cantilever mode yielded a strength of 9.33 × 10⁵ N m-2. These data support the contention that sizeable stress concentrations can exist at the fixed corners of cantilever beams. The maximum effect is experienced with cold brittle ice substantially free of structural imperfections; in structurally degraded ice the stress-concentration factor may be eliminated entirely.
2. Center-loaded, simply supported beams generally test much stronger when the top surface is placed in tension. T he behavior is a ttributed largely to differences in ice types; the fine-grained, crack-free top layer of snow-ice generally reacting more strongly in tension than the coarse-grained, crack-prone, bottom ice. The ratio of strength for the top in tension to that for the bottom in tension may occasionally exceed 2.0 but average values generally occur in the range of 1.2–1.6.
Acknowledgements
I wish to thank H. Ueda for designing and fabricating the device used for testing simply supported ice beams. The assistance of J. Ricard in field tests is gratefully acknowledged. Thanks are also due to J. Kalafut for assistance with instrumentation.


