


Introduction
There is a new frontier in helminthology: time (Harmon et al., Reference Harmon, Littlewood and Wood2019; Cook et al., Reference Cook, Arai and Armién2020; Thompson et al., Reference Thompson, Phelps and Allard2021; Wood & Vanhove, Reference Wood and Vanhove2022). Many of the most contentious questions that concern the ecology of helminths could be resolved with data on helminth abundance and host use in the past few decades or centuries. For example, the dilution effect hypothesis posits that the erosion of host biodiversity leads to increases in parasite transmission (Ostfeld & Keesing, Reference Ostfeld and Keesing2000). This hypothesis has primarily been tested with space-for-time substitutions: for example, comparisons between forested and clear-cut areas (McKenzie, Reference McKenzie2007), forest fragments of large and small size (Allan et al., Reference Allan, Keesing and Ostfeld2003) and fished vs. unfished regions (Wood & Lafferty, Reference Wood and Lafferty2015). In some cases, the biodiversity of entire ecosystems has been experimentally manipulated and the effects on parasite transmission tracked (Wood et al., Reference Wood, Summerside and Johnson2020). But the dilution effect hypothesis has rarely been tested by tracking whether actual, long-term biodiversity change is correlated with change in parasite abundance. Will the erosion of biodiversity leave behind only competent hosts, increasing parasite transmission? Or will it remove the host biodiversity on which parasites depend? The answers to these questions will tell us whether the world faces a ‘rising tide’ of disease as biodiversity destruction continues (Harvell, Reference Harvell2019) or if parasites are in fact declining alongside their hosts (Carlson et al., Reference Carlson, Hopkins and Bell2020a). Only multi-decadal, temporally resolved data can provide a biologically realistic test of these predictions, resolving one of the most important (Poulin, Reference Poulin2021) and contentious (Randolph & Dobson, Reference Randolph and Dobson2012; Lafferty & Wood, Reference Lafferty and Wood2013; Ostfeld & Keesing, Reference Ostfeld and Keesing2013; Wood & Lafferty, Reference Wood and Lafferty2013; Wood et al., Reference Wood, Lafferty, DeLeo, Young, Hudson and Kuris2014, Reference Wood, Lafferty, DeLeo, Young, Hudson and Kuris2016; Levi et al., Reference Levi, Massey, Holt, Keesing, Ostfeld and Peres2016) questions in contemporary parasite ecology.
But the dilution effect is not the only hypothesis that could be addressed with temporal data on helminths. Managers concerned with parasite impacts on valued host populations may be interested in estimating ‘baselines’ – that is, in knowing how parasite abundances have changed in historical time. Invasion biologists may be curious about whether a particular parasite was always present in a host population where it currently occurs. Those interested in global warming may wish to understand how the geographical ranges of hosts and parasites have shifted in response to climate change. Temporal data on parasite abundance can also answer other questions, including ones on how climate change (Lafferty & Holt, Reference Lafferty and Holt2003; Morley & Lewis, Reference Morley and Lewis2014; Paull & Johnson, Reference Paull and Johnson2014; Claar & Wood, Reference Claar and Wood2020), pollution (Lafferty, Reference Lafferty1997; Blanar et al., Reference Blanar, Munkittrick, Houlahan, Maclatchy and Marcogliese2009; Vidal-Martínez et al., Reference Vidal-Martínez, Pech, Sures, Purucker and Poulin2010), urbanization (Meyer et al., Reference Meyer, Paul and Taulbee2005; Walsh et al., Reference Walsh, Roy, Feminella, Cottingham, Groffman and Morgan2005; Violin et al., Reference Violin, Cada, Sudduth, Hassett, Penrose and Bernhardt2011; Booth et al., Reference Booth, Roy, Smith and Capps2016), invasive species (Torchin et al., Reference Torchin, Lafferty, Dobson, McKenzie and Kuris2003; Roy et al., Reference Roy, Handley, Schönrogge, Poland and Purse2011) and other human impacts might bend the trajectory of parasite abundance through time.
Unfortunately, temporally resolved data on helminth abundances are hard to come by. Datasets that reproducibly document parasite abundances in the recent past are rare, and the few that exist pertain to just a handful of species (e.g. Cort et al., Reference Cort, Hussey and Ameel1960; Keas & Blankespoor, Reference Keas and Blankespoor1997; Byers et al., Reference Byers, Holmes and Blakeslee2016; Howard et al., Reference Howard, Davis, Lippert, Quinn and Wood2019; Quinn et al., Reference Quinn, Lee, Greeley, Gehman, Kuris and Wood2021). This handful represents just a tiny fraction of the total number of parasite species on Earth; the helminth endoparasites of vertebrates alone number between 100,000 and 350,000 species (Carlson et al., Reference Carlson, Dallas, Alexander, Phelan and Phillips2020b). Palaeo-parasitological and archaeo-parasitological techniques, like the quantification of helminth eggs in coprolites (Wood, Reference Wood2018), can shed light on change in parasite burdens over deep time horizons (thousands to millions of years; Wood & Vanhove, Reference Wood and Vanhove2022). But if helminthologists want a means of resurrecting information on many parasite species across the Anthropocene (i.e. the past few hundred years), we will need to find a new approach.
That approach exists but is, for the moment, badly underutilized: parasitological dissection of fluid-preserved specimens held in natural history collections (DiEuliis et al., Reference DiEuliis, Johnson, Morse and Schindel2016; Harmon et al., Reference Harmon, Littlewood and Wood2019). Simple parasitological dissections of specimens held in natural history collections can yield reliable information on the helminth and arthropod parasites of vertebrate hosts (Fiorenza et al., Reference Fiorenza, Leslie, Torchin, Maslenikov, Tornabene and Wood2020). Because the world's museums hold billions of suitable specimens collected over more than a century (Constable et al., Reference Constable, Guralnick, Wieczorek, Spencer and Peterson2010; Holmes et al., Reference Holmes, Hammond and Wogan2016; Harmon et al., Reference Harmon, Littlewood and Wood2019), these potential parasitological datasets are broad in scope and finely resolved in taxonomic, temporal and spatial dimensions (Wood & Vanhove, Reference Wood and Vanhove2022). Those museums that allow researchers access to specimens usually do so at no cost, meaning that the only expenses associated with this work are in labour, travel, shipping and consumable supplies – no field excursions, permits, or animal use approvals are needed, and no new vertebrates are sacrificed. As if this were not enough advantage, natural history collections are also positioned to answer questions that are not answerable with fieldwork in contemporary ecosystems.
We wish to make the use of fluid-preserved specimens held in natural history collections more accessible to other parasite ecologists interested in metazoan parasites. Here, we set out best practices for a new sub-field – the historical ecology of parasitism – by outlining how to develop a project that is capable of revealing long-term change in parasite burden for vertebrate hosts (fig. 1). We discuss how to conceive of such a project, how to select specimens, how to engage curators and receive permission for your work, standard operating protocols for dissections and how to manage your data. We will briefly mention the use of molecular techniques, but maintain a primary focus on visual detection of parasites with dissection. Our hope is that other helminthologists will use this paper as a reference to expand their own research programmes along the dimension of time.

Fig. 1. How to use natural history collections to resurrect information on historical parasite abundances. This workflow is divided into subtasks that researchers will need to consider at each stage of the research process. Each of the questions above should be considered alongside a curator–partner.
What specimens exist?
The specimens that are on display in the public exhibits of a natural history museum are typically only a small fraction of the museum's entire holdings. In spaces that are off-limits to the public, curators care for collections of specimens that, for a single institution, can number in the millions (Holmes et al., Reference Holmes, Hammond and Wogan2016). Within each host species, specimens usually span a range of dates of collection, age-classes and sizes. Specimens are typically tagged with relevant meta-data, which almost always include the date and location of collection, and sometimes include information on the specific habitat (e.g. depth of collection for aquatic specimens) and capture method, making these specimens a tiny window on the parasitological reality of a particular time and place. By carefully assembling time series of specimens, helminthologists can answer a variety of questions, including ones regarding the trajectory of parasite community change through time. Researchers who work on fish, amphibian and reptile hosts are in luck: these specimens are typically preserved whole and in fluid, and so can yield ample data on metazoan parasites.
Although the details of preservation protocols vary among institutions (Simmons, Reference Simmons and Rose1995), the one most commonly used for fish is a 4-step process: a 10% buffered formalin solution soak of the specimen until fixation; then two 24-hour deionized water baths; and, finally, the specimen is placed into 70% ethanol for long-term storage. Reptiles and amphibians are often fixed similarly (Pisani, Reference Pisani1973). Tissues react to formalin based on their composition and thickness, as well as the animal's overall body size (i.e. internal organs of a large host will be less well-suffused by formalin than those of a small host). To account for this heterogeneity, the formalin-fixation process is often carefully monitored and it is at the discretion of collections staff to determine when the tissues have been fully fixed. Institutions may differ in the chemicals they choose for long-term storage, with ethanol being the most common choice, but some collections choosing isopropanol. Preservation states can therefore vary slightly among collections, species, and even different lots of the same species. Despite these small variations, the preservation accomplished by natural history collections is extremely faithful (Fiorenza et al., Reference Fiorenza, Leslie, Torchin, Maslenikov, Tornabene and Wood2020; fig. 2).
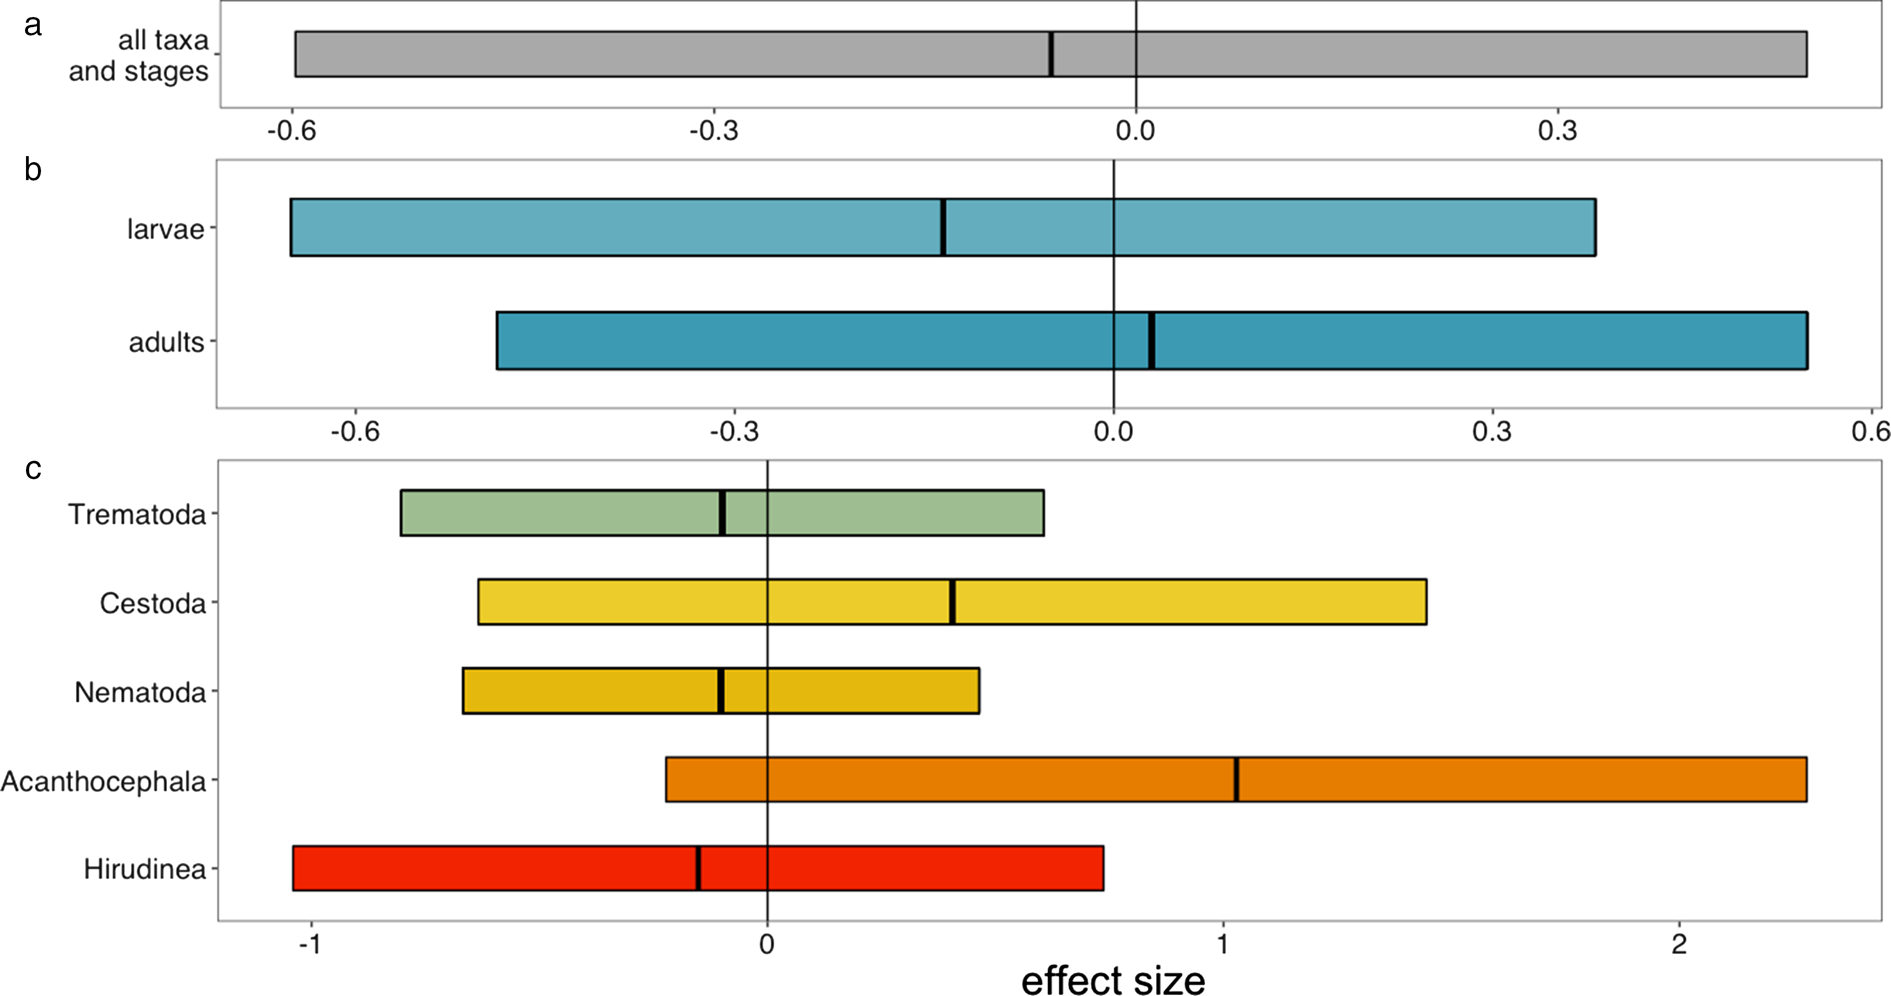
Fig. 2. Fiorenza et al. (Reference Fiorenza, Leslie, Torchin, Maslenikov, Tornabene and Wood2020) conducted a controlled experiment to test whether the detectability of metazoan parasites differed between fresh host specimens and host specimens preserved according to the fluid preservation protocols used by natural history collections. They found no systematic difference between the two treatments. Shown are meta-regression estimates for the effect of preservation on mean abundance of parasites. Positive values indicate higher abundance in preserved fish while negative values indicate higher abundance in control fish. Estimates are shown with 95% confidence intervals. Estimates of the effect sizes come from meta-regression models testing several hypotheses: (a) an overall effect of preservation on detectability; (b) that detectability is moderated by parasite life stage; and (c) that detectability is moderated by parasite taxonomic group. Figure reproduced with permission from Fiorenza et al. (Reference Fiorenza, Leslie, Torchin, Maslenikov, Tornabene and Wood2020).
In addition to being suitable for parasitological dissection, fluid-preserved vertebrate specimens are also abundant: just four United States collections hold eight million fish lots (where a lot is a sample of one or multiple individuals from a single collection location and time; Harmon et al., Reference Harmon, Littlewood and Wood2019) and 13 United States and European collections hold four million reptiles and amphibian lots (Holmes et al., Reference Holmes, Hammond and Wogan2016). Some invertebrates may also be preserved in fluid, with over 74 million marine invertebrates alone in 13 collections (Holmes et al., Reference Holmes, Hammond and Wogan2016). Birds and mammals are typically preserved only as study skins, meaning that their viscera are removed and discarded, and with them, all endoparasites. But these skins still retain many ectoparasites and may provide useful parasitological information, depending on the question. Birds and mammals are also sometimes preserved whole and in fluid (e.g. Banks et al., Reference Banks, Clench and Barlow1973 for United States and Canadian bird collections), often when individuals are of historical importance (Timm et al., Reference Timm, McLaren and Genoways2021) or belong to endangered species (Cervantes et al., Reference Cervantes, Vargas-Cuenca and Hortelano-Moncada2016). We will focus on fluid-preserved vertebrate specimens below, and provide guidelines for validating approaches for extracting parasitological information from other kinds of specimens (including study skins).
How to dream up a project
In most research projects, scientists begin with a question they wish to answer. Things need to start a little differently when natural history specimens are the raw material for data collection, because the questions that can be addressed are tightly constrained by the sampling that has been done in the past. You may begin with a question that could only be answered with specimens that do not exist or are unavailable for examination (e.g. too valuable for curators to allow for them to be loaned out or dissected). It is therefore important that researchers do not proceed into a project too attached to any one question or taxon and instead allow some flexibility in objectives as the project evolves. You might do this by asking a question that is broad or general (e.g. ‘how has the parasite community infecting marine fishes changed over time?’; Wood et al. Reference Wood, Welicky and Preisserin press), which allows for taxonomic (e.g. selecting for examination those host species with the greatest number of specimens available), geographical (e.g. selecting for investigation those geographical regions with the greatest number of specimens available) and temporal (e.g. selecting for investigation those time periods with the greatest number of specimens available) flexibility. You might also start with a general area of interest (e.g. historical parasite burden of a geographical region that is well-studied in contemporary time by your research group) and allow your question to be driven by the availability of specimens.
By the very nature of the time period that they most comprehensively cover (approximately the past century; Wood & Vanhove, Reference Wood and Vanhove2022), natural history collections lend themselves to answering questions about anthropogenic change in parasite communities. One powerful design approach that can harness retrospective data such as these is before–after–control–impact (BACI). In BACI studies, the researcher selects specimens collected from before and after an impact in areas that experienced the impact and similar, comparable areas that did not. For example, you might choose river fish collected above-stream and below-stream of an industrial effluent drainpipe (control–impact) before and after the pipe was installed (before–after). Comparing the trajectory of parasite abundance change between the control and impact sites allows the researcher to distinguish the change attributable to the impact from background change. Suites of specimens suitable for BACI designs are surprisingly easy to find within natural history collections. For example, we were interested in the impacts of urbanization on the parasites of river fishes; we searched for fish specimens in every major North American city (see How to select specimens, below) and found the greatest concentration in Albuquerque, New Mexico, USA. Now we have a major funded project that will disentangle the effects of urbanization from background change in parasite burden for fishes of the Rio Grande. If researchers can allow for flexibility in some dimensions (taxonomic, geographical or temporal) of their project, extremely powerful designs can be built around the available material.
Many readers will be starting from a particular taxon, ecosystem, or geographical area of interest, which provides a helpful nucleus from which to build a project. Whether you are a student starting out with a general interest in the historical ecology of parasitism or an established researcher looking to expand into the field for the first time with no particular system in mind, a good place to begin is from your core research themes: are you interested in one anthropogenic impact (e.g. climate change, habitat loss, invasive species) or conservation intervention (e.g. marine protected areas, National Park designation, species recovery plans)? One parasite or host taxon or ecological group (e.g. endoparasitic flatworms, freshwater fishes)? One geographical area (e.g. the United States Pacific Northwest)? Allow this to be the place you start your search for specimens. Having a broad research area of interest is an advantage at this stage in the process; it will make it easier for you to follow the availability of specimens to an interesting and answerable question.
How to select specimens
When using natural history specimens to answer parasite ecology questions, the development of the research question is necessarily entangled with the search for specimens: the researcher will need to toggle between dreaming up an interesting question and investigating whether the specimens that can provide an answer are available. Luckily, searching for specimens is remarkably easy, particularly for researchers interested in North American ecosystems, where the digitization process is well advanced.
‘Digitization’ is the process of transcribing specimen label information into publicly accessible, online databases (Nelson et al., Reference Nelson, Paul, Riccardi and Mast2012; Hedrick et al., Reference Hedrick, Heberling, Meineke and Turner2020). Many natural history collections are prioritizing the democratization of data through digitization, which means that researchers can query nearly complete online databases of specimen information for many major institutions; even better, data aggregators compile data across many collections, meaning that researchers can search for specimens in the collections of many major institutions with a single click. Data aggregators include VertNet (www.vertnet.com), FishNet2 (http://www.fishnet2.net), SCAN (Symbiota Collections of Arthropods Network; scan-bugs.org), Canadensys (http://www.canadensys.net), the European Distributed Institute of Taxonomy (https://cybertaxonomy.eu), Distributed System of Scientific Collections (DiSSCo; https://www.dissco.eu), the Atlas of Living Australia (https://www.ala.org.au), the Centro de Referência em Informação Ambiental (https://www.cria.org.br), Arctos (https://arctosdb.org/about/) and Specify (https://www.specifysoftware.org), which feed into global data portals like GBIF (Global Biodiversity Information Facility; gbif.org) and iDigBio (Integrated Digitized Biocollections; idigbio.org). Most of these portals allow users to search with multiple filters, including search terms for taxon, location, date range and institution where the specimen is held, as well as geographical coordinates that return all specimens within a specified geographical polygon. While digitization is being aggressively pursued, most collections fall short of the goal of 100% digitization (Page et al., Reference Page, MacFadden, Fortes, Soltis and Riccardi2015); relying on digital repositories of data is a good way to begin exploring options for a project, but once one or a few collections are identified as potential sources of specimens, researchers may need to rely on curators’ knowledge about their holdings (see How to approach curators, below).
As you are searching repositories for specimens, there are two competing priorities you will want to balance: maximizing replication and minimizing destruction of irreplaceable specimens. On one hand, you will need to maximize replication within each of your experimental units to rigorously test your research question; in one past project, we aimed for 15 individuals of each host species for each decade, across eight host species and about 100 years (Wood et al. Reference Wood, Welicky and Preisserin press). We strongly recommend performing a power analysis to determine the minimum number of specimens needed to achieve sufficient statistical power for a convincing test of your hypotheses, within your experimental design (for an example and R code, see Fiorenza et al., Reference Fiorenza, Leslie, Torchin, Maslenikov, Tornabene and Wood2020). A power analysis will help you figure out whether your question is answerable with the specimens available, show curators that you have done your homework (see How to approach curators, below) and allow you to waste no specimens: if you use the minimum number of specimens required to achieve sufficient statistical power, you will minimize the number of specimens that you must handle and possibly compromise.
Replication is a well-recognized constraint in historical ecology (McClenachan et al., Reference McClenachan, Ferretti and Baum2012, Reference McClenachan, Cooper, Hardt, McKenzie and Drew2016). When working on ecosystems of the past, our insight is constrained by the fact that only a fraction of once-extant evidence persists into the present day. Historical ecologists have several ways of overcoming this constraint, including using multiple lines of evidence (McClenachan et al., Reference McClenachan, Ferretti and Baum2012, Reference McClenachan, Cooper, Hardt, McKenzie and Drew2016). If you are lucky enough to have access to an additional line of evidence to bear on your hypothesis (e.g. field data that overlap in time and space with your natural history specimens; see Howard et al., Reference Howard, Davis, Lippert, Quinn and Wood2019), by all means use it. But there are also other ways to shore up scientific rigour, even where specimen availability is strongly constrained and alternative lines of evidence do not exist. For example, you may choose to broaden your research question and distribute sampling across multiple host and parasite species. In one project, our team focused on addressing a question about an entire suite of parasite taxa: parasites of marine fishes in Puget Sound, USA. We asked, ‘how has parasite abundance changed over time for a suite of parasites?’, which gave us the ability to include replicates across eight host species and 85 parasite taxa. We were not able to draw conclusions about individual parasite species due to low replication at the level of individual parasite species, but we had high statistical power for addressing questions about groups of parasite species (Wood et al. Reference Wood, Welicky and Preisserin press). If an extremely low number of specimens exist in your area of interest, you might alternatively consider re-orienting your question so that it requires only qualitative data (in which case taxonomic and geographical coverage are probably as crucial as statistical power); for example, simple presence/absence data have addressed questions about the date of invasion for non-native parasite species (Hartigan et al., Reference Hartigan, Phalen and Slapeta2010; Jorissen et al., Reference Jorissen, Huyse and Pariselle2020).
If your data collection technique is semi-destructive (like the approach we describe in How to perform parasitological dissections on fluid-preserved vertebrate specimens, below), you will want to select specimens in such a way as to minimize the impact you have on the collections from which your specimens are drawn. Natural history collections contain irreplaceable specimens; there will never be another opportunity to collect specimens from past time points. As mentioned above, performing a power analysis to identify the minimum number of specimens needed is a good first step toward using these irreplaceable specimens responsibly. You may also choose to distribute sampling across lots (where a lot is a sample of one or multiple individuals from a single collection location and time). Many collections contain substantial redundancy within lots; for example, some collections are repositories of government research surveys, which produce thousands of individuals from each time/place sampled (e.g. research trawls; Maslenikov, Reference Maslenikov2021). Destructive sampling of a subset of a lot containing many individuals does little to erode the future utility of that lot. We recommend selecting a handful of individuals across multiple lots; this allows some individuals in each lot to remain untouched and ensures that your sampling spans multiple collection times and locations, homogenizing variability across time and space. It is also prudent to consider selecting ‘back-up’ lots, if more lots exist than your study design requires. This allows you to be well-prepared in case some lots are difficult to locate, desiccated or otherwise damaged, or have already been loaned out for a different project. This will save time and facilitate discussions with the curator, as you will not have to go back to the drawing board when some of your requested samples are unavailable.
As in any scientific venture, you will need to design your study so as to minimize bias. But because you are working with a pre-selected subset of the specimens available at each time point (i.e. the specimens the collector chose to sample and enter into the collection, for their own reasons and by their own scheme), some amount of bias will be unavoidable. Most natural history collections are the product of non-random sampling, with selection based on taxonomic, geographical, temporal and trait preferences of the collector (Meyer et al., Reference Meyer, Weigelt and Kreft2016; Daru et al., Reference Daru, Park and Primack2018; Gotelli et al., Reference Gotelli, Booher and Urban2021; Meineke & Daru, Reference Meineke and Daru2021). It is rare to find documentation of these preferences or the scheme by which sampling was conducted, but several of these kinds of bias can be accounted for in parasitological studies. Bias in taxonomic, geographical and temporal representation can be overcome with careful selection of specimens or by re-orienting the scientific question; for example, you can choose to work on a host species that is well-represented in collections (overcoming taxonomic bias; see paragraph above), select specimens only from well-represented sampling locations (overcoming geographical bias), or you can work with a secondary source of specimens to fill temporal gaps in the specimen record of your primary natural history collection (overcoming temporal bias). However, bias in trait representation (i.e. discrimination for or against individuals with certain traits) is a special challenge for parasite studies. Body size is a common trait that curators use to select specimens for accessioning, in part because large-bodied individuals take up precious space in space-limited collections; as a result, the distribution of individual body size across time can be biased (Howard et al., Reference Howard, Davis, Lippert, Quinn and Wood2019) – probably especially so in recent decades due to administrative and financial constraints on transport of specimens from their location of collection (J. Snoeks, pers. comm., 8 August 2022). This is particularly problematic for parasitological studies, because host body size is a key determinant of parasite burden (Poulin, Reference Poulin1999). You can overcome this constraint by setting narrow criteria for minimum and maximum body sizes as you select specimens; if you apply these criteria consistently across time points, you will extract specimens of consistent body size across time, ensuring that you are always comparing apples to apples. You will also account for body size in your statistical analyses (see How to manage and analyse the data, below). But body size is not the only potential locus of bias among natural history specimens, and the biases might vary depending on the collection you are considering. We recommend reflecting on potential sources of bias in your targeted collection, with the input of the curators who know that collection (Meineke & Daru, Reference Meineke and Daru2021). Luckily, Gotelli et al. (Reference Gotelli, Booher and Urban2021) report that, for 17 coupled field and museum datasets, the abundances of species in the field are closely correlated with their abundance in museums (median r 2 of correlation between field and museum abundance = 0.43), suggesting that – although collectors unavoidably introduce some bias into the holdings of natural history collections – these collections still largely reflect the state of populations in nature.
With these considerations in mind (i.e. maximizing replication, limiting impact on collections and minimizing sampling bias), you will assemble a list of lots that you wish to target, and the number of individual specimens you would like to use within each lot. This will serve as a starting point for your collaboration with the curator in charge of the collection you wish to target.
How to approach curators
Curators are charged with the awesome responsibility of safeguarding the world's biodiversity heritage, specimens that are irreplaceable and, in many cases, our only window into ecosystems of the past. Their judgement is supreme and final; if curators decide that your project's outputs would not justify the loss of specimen utility that the project entails, your project, as currently envisioned, cannot proceed. However, we have found that curators are often very willing to allow sampling within their collections, provided that you approach them with a thoughtful research plan and are willing to compromise on dissection protocols and negotiate specimen lists. We have further found that involving curators in our research has greatly enriched the outputs of our projects.
When you make your initial approach to a curator, make sure that you can show you have done your homework. In your initial message, you should include a summary of the scientific goals of your project, a draft standard operating protocol for the dissection procedure you will follow (see How to perform parasitological dissections on fluid-preserved vertebrate specimens, below) and a draft list of lots requested (see above). Emphasize to the curator that the standard operating protocol and list of lots are a starting point – you are happy to modify according to their preferences. Assure the curator that you put the integrity of the collection ahead of any other considerations; your primary goal is to get your scientific questions answered with the minimum possible loss of specimens’ future utility. If appropriate, you might also offer to include the curator as a collaborator in the project (see below).
Once you have made your initial contact, it is time to negotiate. Together with your curator–partner, you will decide what dissection protocol you will use on which specimens. You will have to make judgments about which compromises would make it difficult for you to answer your research question. For example, when our team is performing a parasitological dissection of a freshly collected fish, we usually remove a fillet and examine the musculature for encysted parasites by squashing it between glass plates and viewing it under a stereomicroscope. We developed a modified protocol for natural history specimens, in which we spread open a ventral incision and pass a strong light through each side of the fish. Shadows indicate the position of encysted parasites. This ‘candling’ technique will certainly not yield as many parasites as the more destructive ‘squashing’ technique (Levsen et al., Reference Levsen, Lunestad and Berland2005); however, it can provide a reproducible relative measure of abundance for encysted parasites (Fiorenza et al., Reference Fiorenza, Leslie, Torchin, Maslenikov, Tornabene and Wood2020) and it was therefore a worthwhile concession to make, because it allows us to entirely preserve the external morphology of specimens that we dissect. You will also need to make compromises on your specimen list with your curator–partner. If you have followed our advice above and made sure to select only a few individuals from each lot, you are well on your way to a workable compromise; using a few individuals from a single sampling event does little to erode the future utility of that lot. But curators might choose not to allow sampling of particular lots, especially ones that are unique (e.g. type specimens), rare, or of historical importance. You will want to make appropriate accommodations for any ‘vetoed’ specimens in your experimental design.
After you and your curator–partner have decided on a dissection protocol and a specimen list, you will have to decide on the disposition of dissected organs and where the removed parasites will be accessioned. Once dissected according to our protocol (see How to perform parasitological dissections on fluid-preserved vertebrate specimens, below), many host organs will be morphologically compromised; however, they could have future use for genetic, stable isotope, or biochemical studies (and in some cases – for example carefully dissected gill arches – even for morphological work), and it would therefore be a waste to throw them away. Your curator–partner might decide that they would like you to stuff the dissected internal organs back into the body cavity of the corresponding host; with a few stitches of dental floss, the body cavity can be closed to permanently contain the dissected organs. Curators may prefer accessioning the dissected organs separately, with a catalogue number that links the organs to the original host lots. Alternatively, you might choose what we often do: we pack all of the dissected organs into a glass vial, label it with a unique identification number (usually the lot number plus a number indicating the individual host), label the host with the same unique identification number, fill the glass vial with preservative, stuff it with cotton and then return it to the same jar as its host. This way, any future researchers can immediately access the organs and associate them with the individual host of origin, even if there are multiple host individuals in the lot. Finally, you will need to decide with your curator–partner what will happen to the parasites you isolate from dissected hosts. You will remove them from the host and hold them using whatever means are convenient (e.g. 1.5-ml microcentrifuge tubes) for the lifetime of the project. But once you publish, what will become of these vouchers? Many curators ask that parasite vouchers be deposited in the invertebrate collection associated with their home museum. Others might prefer that the vouchers go to a dedicated parasite collection elsewhere, such as the Manter Laboratory of Parasitology at the University of Nebraska or the National Parasite Collection at the Smithsonian Institution. Each of these collections will have minimum requirements for specimen preparation (e.g. stained and mounted specimens, parafilmed vials). As only a fraction of parasite biodiversity has been formally described (e.g. 7 to 13% for marine monogenean flatworms as estimated by Appeltans et al., Reference Appeltans, Ahyong and Anderson2012) it is highly likely that your endeavours will lead to the discovery of new parasite species. To advance our understanding of parasite diversity and help ensure that parasite taxonomy does not become a lost art (Poulin et al., Reference Poulin, Presswell and Jorge2020; Poulin & Presswell, Reference Poulin and Presswell2022), you might consider formally describing these species (with the help of trained parasite taxonomists if you are not one yourself), in which case the parasite specimens in question will receive type material status. Whether new parasite species are described or not, the originating vertebrate collection and the invertebrate collection in which the parasite vouchers are deposited should update their databases to include references and/or links between the host and parasite specimen data, so that future researchers accessing the vertebrate database know where the parasites of a particular host can be found and researchers accessing the parasite database know which fish each parasite originated from. This may require the addition of new database fields (‘symbiont of’ or ‘host of’), and may be considered a status change for the host specimen to, for example, a symbiotype (Frey et al., Reference Frey, Yates, Duszynski, Gannon and Gardner1992; Brooks, Reference Brooks1993; Bradley et al., Reference Bradley, Bradley, Honeycutt, MacDonald, Amarilla-Stevens and Stevens2020). Depositing parasite vouchers should be considered a non-negotiable, required project outcome. These parasites came from a publicly available resource, and they should become publicly available in turn.
How to perform parasitological dissections on fluid-preserved vertebrate specimens
In this section, we offer the standard operating protocol that has worked for our team in projects focused on parasites from fluid-preserved specimens of fish hosts. These protocols may need to be modified (e.g. for an herbivorous fish species with a long intestine, the intestine may need to be rinsed through a sieve rather than squashed on glass plates), but can serve as a starting point for researchers building their own standard operating protocols.
Several preparatory steps precede dissection. As soon as specimens enter our laboratory, each is assigned an individual identification number. To create a unique identifier for each individual host, we combine the institution code (e.g. UWFC for University of Washington Fish Collection), the catalogue number assigned to the lot by the originating collection, and an individual specimen number (e.g. UW_1234_01 or UW_1234_02). If the specimen is already tagged with an individual number, we use the previously assigned number. This unique identifier allows us to track parasites and visceral organs directly back to the original host, even if there are multiple host individuals within a given lot/catalogue number. We make sure to have appropriate preservatives on hand for holding host tissues or parasites extracted during dissection; anything removed from the host will be held in containers of the same preservation fluid at the same concentration as the host's storage fluid (e.g. 70% ethanol or 50% isopropanol), which prevents specimen desiccation and mixing of preservation chemicals.
Dissections begin with an examination of external organs. As discussed above in How to approach curators, any destructive sampling protocols should be thoroughly discussed with curators prior to a project. Our curator–partners required that dissection of external organs be conducted only on the right side of each specimen, because the left side is the standard used for taxonomic research. Therefore, we begin by removing the right eyeball and gill arches. (The parasite counts from the bilateral organs, where only one side is examined, may be doubled in analysis to reflect the anticipated infection for the entire specimen.) If we are handling flatfishes, the blind side is dissected and the eyeballs are not removed at all. If extracted, the gills are placed in a separate container with clean preservation fluid and a cap, and then shaken vigorously to dislodge parasites.
To begin the dissection of the internal organs, make a ventral incision from the vent to the base of the throat or gill isthmus. For flatfishes, make a c-shaped incision on the blind side around the body cavity. These incisions should allow you to open the body cavity and view the internal organs. Locate and remove the visceral organs by severing the digestive tract at the oesophagus and vent. For some fish, you may need to remove the swim bladder in order to locate and remove the kidneys along the spine. Place all of the extracted organs into a Petri dish, ensure they are completely covered in clean preservation fluid and cover with a lid to minimize evaporation of the fluid prior to the parasitological examination. The vertebrate specimen is placed in a Petri dish when it is small enough to be completely submerged with preservation fluid. If a specimen is too large to fit in a Petri dish, we wrap it in a paper towel or cheesecloth saturated with clean preservation fluid and place it in a sealed ziplock bag until examination.
We then begin the parasitological examination, during which any parasite found is documented, removed, preserved and identified (see Parasite identification and preservation, below). The examination is performed under a stereomicroscope. The buccal cavity and body cavities should be thoroughly examined. Any ectoparasite seen during the external examination is documented, but only removed if we are able to do so without causing damage. When the muscle and skin tissue are thin enough for light to pass through, shine a bright, concentrated light through the body cavity to detect parasites. Any parasites we detect through this method may be extracted; we often decline to remove these parasites to avoid specimen destruction if we know (from previous extractions) what the parasite is likely to be. We then tag the specimen with its individual identification number and return the vertebrate to its lot, ensuring it is fully submerged in the preservation fluid.
Next, we examine each visceral organ individually. The fixation process can cause the tissues to be discoloured or to have a tough, rubbery texture, in contrast to fresh tissues and organs. For example, the liver, after being formalin-fixed, is often too thick and opaque to be smashed between glass plates and examined with transmitted light under a stereomicroscope. Instead, we examine the full surface area of the liver for any bumps or discoloration, which may indicate a parasite just under the surface. Often the parasites are on the surface of the liver or just below the surface, making detection and extraction feasible; the liver can also be broken apart and searched thoroughly with forceps. The heart, gonads, spleen, kidney and eyeball (once the lens is removed) are all pressed between clear glass plates and screened under a stereomicroscope. On larger fish specimens, this procedure may also need to be altered to accommodate thicker tissues by slicing the tissues into smaller pieces that can be pressed between glass or by carefully combing through the tissues with forceps. We then examine each section of the digestive system (stomach, pyloric caecae and intestine) individually by carefully scanning the outer lining and connective tissues and then using forceps or scissors to open up the tissues, being careful not to damage any parasites in the lumen. The swim bladder and gallbladder are examined in a similar fashion by observing the exterior and then opening the organ.
To examine gills, we pour the contents of the gill vial into a Petri dish and rinse the vial several times to ensure that everything is expelled into the dish. Parasites can easily be retrieved in the wash, while parasites remaining on the gills will be easier to see after this washing step, which dislodges mucus and debris. We inspect each side of the gill arch by combing through both rows of filaments over the length of each filament. The wash is thoroughly examined for any parasites (e.g. monogeneans or copepods) that were displaced during the vial shake or rinse.
Finally, we look through the preservation fluid left at the bottom of any Petri dishes that held tissues. Though we are sometimes not able to identify the original location of infection for a parasite collected during this step, we can still count the parasite toward the total number of parasites of that species for that host individual. All of the examined tissues are then placed into a glass vial, labelled with the individual identification number and a vial description (i.e. ‘visceral organs’), stuffed securely with a cotton ball, and returned to the host's original lot.
Parasite identification and preservation
During dissection, we perform a preliminary identification of each parasite detected (either species or, if species is not immediately known, morphotype descriptor) and remove all parasites into vials for storage and/or later identification (fig. 3). The parasites collected are temporarily vouchered in 70% ethanol in a 1.5-ml centrifuge tube, with a label containing the individual host identification number, parasite code (unique to each parasite species or morphotype) and the number of parasites vouchered. For each host species, we create a photographic parasite identification guide for use by the dissection team, where each parasite morphotype found is given a code, identified down to the lowest possible taxonomic classification via morphological traits and is described in terms of diagnostic features. When working with a dissection team, it is crucial that this is done immediately for each ‘new’ parasite species to ensure consistency across dissectors and to avoid multiple parasite codes being created for one species or morphotype.

Fig. 3. Representative examples of helminth parasites dissected from fluid-preserved vertebrate hosts: (a) nematodes in situ in the gut tract of a Gulf Stream flounder (Citharichthys arctifrons) held at Harvard University's Museum of Comparative Zoology (Cambridge, MA, USA). Each arrow points to one worm. Photograph courtesy of Whitney Preisser; (b) a monogenean (Cichlidogyrus sp.) in situ on the gill filament of a Nile tilapia (Oreochromis niloticus) held in the Royal Museum for Central Africa (Tervuren, Belgium). Photograph courtesy of Tiziana P. Gobbin; (c) acanthocephalan (Echinorhynchus gadi) from Atlantic cod (Gadus morhua) held in the Smithsonian Institution Museum of Natural History (Washington, DC, USA). Photograph courtesy of Chelsea Wood; (d) larval cestode (Tentacularia coryphaenae) removed from its cyst and (inset) within its cyst, from Atlantic cod (Gadus morhua) held in the Smithsonian Institution Museum of Natural History (Washington, DC, USA). Photograph courtesy of Chelsea Wood; (e) monogeneans (Microcotyle sebastis) from the gills of a copper rockfish (Sebastes caurinus) held in the University of Washington Fish Collection (Seattle, WA, USA). Photograph courtesy of Katie Leslie; and (f) adult trematode (family Hemiuridae), from Pacific herring (Clupea pallasii) held in the University of Washington Fish Collection (Seattle, WA, USA), stained and mounted according to protocols in Cable (Reference Frey, Yates, Duszynski, Gannon and Gardner1977). Photograph courtesy of Whitney Preisser.
For parasite identification, we rely heavily on morphology, as genetic sequencing can be challenging after formalin fixation. While the morphology of endoparasites and ectoparasites is relatively well-preserved alongside their formalin-fixed, ethanol-preserved hosts, their DNA is not. Formalin fixation causes DNA degradation (Zimmermann et al., Reference Zimmermann, Hajibabaei, Blackburn, Hanken, Cantin, Posfai and Evans2008), making genetic work more challenging (but not impossible) for parasites (e.g. Li et al., Reference Li, Liao and Yang2000; Hykin et al., Reference Hykin, Bi and McGuire2015). Even when it is possible to get genetic information from formalin-preserved parasites, there is not a substantial database of sequences to compare against at this time, especially for parasites of wildlife (Federhen, Reference Federhen2012). The resolution with which we can understand the historical ecology of parasites hence depends on the level of expertise available to morphologically identify parasites, which should be a powerful argument for the importance of systematic parasitology.
The chitin exoskeleton of crustaceans holds up well through the preservation process, allowing these organisms to be easily identified with a taxonomic key; soft-bodied parasites such as helminths, however, are often impacted by preservatives in ways that make morphological identification more challenging (e.g. reduced transparency of the body, twisted body position). Luckily, established laboratory parasitology techniques can help. For example, nematodes can be cleared using lactophenol or glycerine (Cable Reference Frey, Yates, Duszynski, Gannon and Gardner1977). Flatworms and acanthocephalans can be stained and cleared with Semichon's carmine and xylene, then mounted onto slides using Canada balsam (Cable Reference Frey, Yates, Duszynski, Gannon and Gardner1977; fig. 3f). Monogeneans may be stained in the same way, or instead can be mounted directly onto slides using Hoyer's medium (e.g. Vanhove et al., Reference Vanhove, Hermans, Artois and Kmentová2021). We often seek the advice of experienced parasite taxonomists when we are perplexed by a parasite. Once you have identified your parasites and published your data, parasite specimens can be transferred from their temporary vials into a permanent storage medium for accessioning into a natural history collection, according to the agreement that you have made with your curator–partner (see How to approach curators, above).
How to validate your intended approach
If you are planning to work on fluid-preserved fishes, a validation study has already established that there is no decay of parasite detectability with preservation (Fiorenza et al., Reference Fiorenza, Leslie, Torchin, Maslenikov, Tornabene and Wood2020; fig. 2); if you plan to work on other fluid-preserved vertebrates or the dried skins of birds and mammals, appropriate validation studies remain to be conducted. We have no reason to believe that parasite detectability would be strongly affected by fixation in other vertebrate collections but not ichthyological collections. Similarly, some indirect evidence suggests that the number of ectoparasites on preserved birds corresponds strongly with the number on freshly killed birds (Clayton & Drown, Reference Clayton and Drown2001; Eberhard, Reference Eberhard2003). However, formal validation studies must be conducted to create a strong foundation for temporal studies of parasites living on these hosts.
Validation studies must establish that there is no reduction of parasite presence, abundance, or detectability with preservation – that is, that preserved specimens accurately reflect the number of parasites infecting a host at the time of its demise. The anticipated outcome of these studies is a null result; that is, we are expecting that there will be no difference between the treatment (preservation) and control (no preservation) groups. Null results can arise from the true absence of an effect or from insufficient statistical power. Therefore, you should begin by conducting a power analysis to assess the level of replication needed to confidently rule out the existence of a treatment effect. Ideally, you will have sufficient power to detect even small effects (defined as effect size = 0.2; Cohen, Reference Cohen1988), but minimally you should clearly enunciate in your study the size of the smallest effect you can confidently detect. Having identified your target level of replication, you can proceed to obtain a sample of your target host, ideally individuals of a few species within your target group (e.g. a few species of amphibians of variable body size/morphology/habitat). Randomly assign individuals to treatments (e.g. preserved and not preserved) and preserve those assigned to the preservation group with standard methods. Then perform a parasitological dissection of identical procedures on each individual and compare the abundance of each parasite species between the two groups. If you perform multiple comparisons (e.g. of multiple parasite species), make sure to apply a correction for the consequent inflation of Type I error (Pike, Reference Pike2011). For an example of a validation study, see Fiorenza et al. (Reference Fiorenza, Leslie, Torchin, Maslenikov, Tornabene and Wood2020).
The validation study template described above provides information on whether the fixation process changes parasite detectability; an open question is whether parasite detectability decays with storage time. To address this question, we are currently performing an experiment to test whether parasite detectability degrades over the first ten years after preservation, a period we define as ‘long-term storage’. At the moment of this writing, our specimens were experimentally preserved 3.5 years ago. We are performing dissections at 2.5-year intervals, so we will have interim results soon and final results in a few years. Our curator–partners report little change in the quality of fish tissues over the span of decades (L Tornabene and K Maslenikov, pers comm, 1 January 2018), and new parasite species have been described from hosts collected as early as 1905 (Vanhove et al., Reference Vanhove, Hermans, Artois and Kmentová2021), suggesting little degradation of parasites across storage time. However, an answer to the question of whether parasite detectability changes over the course of long-term storage (at least, over the course of a decade) will come at the conclusion of our experiment. We encourage similar studies to test the same questions in preserved specimens of other taxa.
One important caveat to bear in mind concerns shifts in preservation technique over time. The scope of inference of any validation study extends only to specimens preserved with the same techniques used in that study. Formaldehyde was only discovered in 1859 (Butlerow, Reference Butlerow1859) and probably only became established as a fixative for natural history specimens in the early 1900s (Fox et al., Reference Fox, Johnson, Whiting and Roller1985). Older specimens may have been fixed in ethanol, which does not preserve tissues as well as formalin can (Pequingot et al., Reference Pequingot, Sarot, Duranthon, Pensel and Carillo-Baraglioli2011; but see Hahn (Reference Hahn2014), in which taxonomically identifiable monogenean parasites were extracted from ethanol-preserved fish specimens collected as early as 1876). In the absence of appropriate validation (e.g. comparing ethanol-fixation to formalin-fixation), specimens should not be compared across preservation techniques.
How to collect matched environmental data
Depending on your research question, by this point you may not need to collect any additional data. Perhaps you are interested in comparing modern to historical burdens of parasites for an economically valuable host species; once you have these baseline data, perhaps to assist in setting management targets, your data collection is complete. But if you would like to understand the environmental correlates of temporal change in parasite abundance, you will need matched environmental data. Of course, correlation does not imply causation; finding that parasite burden is positively correlated with temperature, for example, does not prove that climate change has caused an increase in parasite burden. But it can point in fruitful future directions for mechanistic studies to provide complementary information, which can establish causation. And in combination with such mechanistic studies, broad correlations between parasite burden and environmental factors can do something powerful: provide a biologically realistic test, over broad temporal and spatial scales, of how parasite burden responds to changes in the environment.
Luckily, matched environmental data are often reasonably easy to obtain, depending on the system in which you choose to work. When we were reconstructing parasite burden in Puget Sound, USA over the past century, we were able to recover temporally congruent data on sea surface temperature (1921–2019), 12 organic and heavy metal contaminants (1774–2005) and the density of the host species we were dissecting (1946–1977 or 1972–2011, depending on host species). Data were either publicly available for download (‘British Columbia Lightstation Sea-Surface Temperature and Salinity Data (Pacific), 1914-present’, n.d.; Essington et al., Reference Essington, Ward, Francis, Greene, Kuehne and Lowry2021), extractable from the literature resource itself (Brandenberger et al., Reference Brandenberger, Crecelius, Louchouarn, Cooper, McDougall, Leopold and Liu2008), or available from a corresponding author (Greene et al., Reference Greene, Kuehne, Rice, Fresh and Penttila2015). Granted, Puget Sound is an intensively studied region, and other geographical areas of interest may have a less-rich historical data pool to draw from. If environmental correlates of parasite abundance change are central to your research interest in this topic, you should choose to work in a long-studied or well-studied region when you are developing your project (see How to dream up a project, above). The key is to search intensively and expansively for environmental datasets; we discovered the existence of the Essington et al. (Reference Essington, Ward, Francis, Greene, Kuehne and Lowry2021) dataset during a casual conversation about our research with a colleague, and it not only gave us useful data, but also led to a productive collaboration (Wood et al. Reference Wood, Welicky and Preisserin press). Reconstructed datasets can provide a wealth of information that may span longer periods than directly collected data; for example, Strom et al. (Reference Strom, Francis and Mantua2004) used geoduck shells to reconstruct sea surface temperature of the north-eastern Pacific between 1880 and 1999. Oftentimes grey literature and long-term environmental and host-population datasets are produced and managed by local, municipal, or regional government agencies, and these resources may not be immediately located with an Internet search. Reaching out to these agencies could reveal a wealth of information that would have otherwise been missed. Therefore, we suggest broadly searching the literature and government documents, and consulting with colleagues who work in your region of interest.
How to manage and analyse the data
Your data are in hand; now what? It can be challenging to manage the temporal datasets described herein. If you have sampled many host species, you may be dealing with data on dozens of parasite species. If you have collected matched environmental data, you may have several datafiles that must be cross-referenced by year, year–site, or other identifiers. And if you have sampled in a public natural history collection, you are duty-bound to make your data publicly available in turn. Below, we discuss tips for data curation, analysis and how to make your data accessible after publication.
Using some simple data science methods, even the most tech-phobic parasite ecologist can create a workflow that is reproducible (that is, transparent and repeatable) and allows for seamless collaboration with others (Lowndes et al., Reference Lowndes, Best, Scarborough, Afflerbach, Frazier, O'Hara, Jiang and Halpern2017, Reference Lowndes, Froehlich, Horst, Jayasundara, Pinsky, Stier, Therkildsen and Wood2019; Wilson et al., Reference Wilson, Bryan, Cranston, Kitzes, Nederbragt and Teal2017). Our team follows the principles of ‘tidy’ data (Wickham, Reference Wickham2014; Wickham & Grolemund, Reference Wickham and Grolemund2016; Wickham et al., Reference Wickham, Averick and Bryan2019), performs all data manipulation in RStudio (RStudio Team, 2020) powered by R (R Core Team, 2022) and keeps code for both data manipulation and analysis organized and shareable in GitHub, an open data and code repository service (GitHub, 2022). Learning to use these tools takes time, but several free and easy-to-follow tutorials exist (e.g. Bryan, Reference Bryan2018; Wright et al., Reference Wright, Ellis, Hicks and Peng2021). Using tidy principles makes our datasets easily intelligible – to our future selves, to other interested parties, and to any software that might ingest our data (e.g. R). It spares us time, because data manipulation tasks (e.g. formatting, transforming, rescaling) that would otherwise be performed manually (e.g. in Microsoft Excel) can be automated and run in a fraction of the time. It allows us to seamlessly merge multiple datasets (e.g. on parasite burden and environmental correlates) with a single click – instead of laborious, error-prone, manual copy-and-paste. By including comments throughout our code, we can add reminders about why we processed the data in a specific way, which can be useful for future reference. It also means that we keep a record of all changes made to the dataset from its raw form, which allows us (and, once our code is published, others) to catch mistakes (Wilson et al., Reference Wilson, Bryan, Cranston, Kitzes, Nederbragt and Teal2017). This transparency is especially important for data captured from public repositories, because the public is entitled to everything derived from these resources. But one of the most helpful benefits of using the tidy framework to curate data is that it makes it possible for others – including your collaborators, the public and ‘future you’ – to easily understand and use the data you have produced (Lowndes et al., Reference Lowndes, Best, Scarborough, Afflerbach, Frazier, O'Hara, Jiang and Halpern2017, Reference Lowndes, Froehlich, Horst, Jayasundara, Pinsky, Stier, Therkildsen and Wood2019).
There are several special analytical considerations you will need to bear in mind for your temporal parasitological dataset. First, you will need to decide whether to analyse all parasite taxa together or to perform separate analyses for each parasite taxon; we recommend the more streamlined solution of analysing all parasite taxa together, because it allows you to capitalize on across-parasite-taxon replication to detect patterns that transcend individual parasite taxa (e.g. Wood et al. Reference Wood, Welicky and Preisserin press). Whether you choose to analyse parasite taxa with a single model or multiple models, you will need to consider host body size: parasite burden tends to increase with host body size, but the shape of this relationship can vary from one parasite species to the next and one host species to the next (see How to select specimens, above). It is therefore advisable to account for this effect by fitting unique host body size–parasite burden relationships for each parasite taxon detected; if you choose to model all parasite taxa together, you may do this by fitting a random slope of host body size for each parasite taxon in a linear mixed-effects model. Autocorrelation (that is, non-independence among replicates) can skew the results of any statistical test; in datasets such as yours, both temporal autocorrelation (replicates sampled close in time to one another are more similar than replicates sampled far apart) and spatial autocorrelation (replicates sampled close in space to one another are more similar than replicates sampled far apart) should be screened for. There are many excellent resources that will help you diagnose and address spatial and temporal autocorrelation in your study (e.g. Dale & Fortin, Reference Dale and Fortin2014). Finally, if you do model parasite taxa together instead of separately, there should be a random intercept in your statistical model that accounts for the identity of the host specimen. That is, some host individuals may be more susceptible to parasitism than others, and there is therefore likely to be some non-independence among the multiple parasite taxa collected from each host individual. A random effect of host specimen identity can account for this non-independence. Although all the normal rules of statistics apply here, the unique aspects of your dataset (e.g. multiple parasite species, influence of host body size, spatial and temporal autocorrelation, non-independence among parasite taxa sampled from the same host individual) will require special statistical attention.
Natural history collections are meant to be arks, carrying biodiversity information forward in time for future generations to use and benefit from. Your parasitological data are part of the same venture. Therefore, once your paper is published, we urge you to deposit the underlying data in a publicly accessible repository, such as Dryad (https://datadryad.org), Zenodo (https://zenodo.org), or FigShare (https://figshare.com). You will also want to ensure that your derivative specimens (e.g. fluid-preserved parasite vouchers, parasites mounted on slides) are accessioned into appropriate collections and made available to the public, with each parasite specimen linked to its host specimen of origin in both of their respective databases; this ensures that future vertebrate researchers can find the parasites derived from a host specimen of interest and future parasitological researchers can identify the host individual of origin for their parasite specimen of interest (Thompson et al., Reference Thompson, Phelps and Allard2021; Upham et al., Reference Upham, Poelen and Paul2021). Your curator–partner might even make data and physical specimen deposition a requirement for use of their specimens. If you are following our advice above to code your data manipulations and analysis, we also recommend that you deposit your code in a public repository; our favourite is GitHub (GitHub, 2022). By making your data and code publicly accessible, you are expanding the utility of the specimens you used and helping to democratize the biodiversity information stored in natural history collections (Bakker et al., Reference Bakker, Antonelli and Clarke2020; Hedrick et al., Reference Hedrick, Heberling, Meineke and Turner2020).
Conclusion
Currently, a vast amount of parasitological information is locked in natural history specimens. In our opinion, this is the lowest of low-hanging fruit for helminthologists. Our ability to answer even the simplest parasite ecology questions – for example, are there more parasites now than there used to be? – depends on access to historical information in preserved specimens. With the suggestions outlined here, helminthologists will be prepared to venture into collections and come back with answers to some of the most pressing questions in parasite ecology.
Acknowledgements
The ideas in this paper were developed over many years, initially inspired by conversations among CLW, Armand Kuris, Kevin Lafferty and Ryan Hechinger; and among MPMV, Tine Huyse, Antoine Pariselle and Jos Snoeks. Conversations with museum personnel allowed us to hone our protocol for parasite ecology work in natural history collections; we especially thank Katherine Maslenikov, Luke Tornabene, Dave Catania, Carole Baldwin, Emmanuel J. Vreven, Didier Van den Spiegel, Maarten Van Steenberge, Eva Decru and Miguël Parrent for their input. Finally, we thank the postdoctoral scholars, graduate students and undergraduates who have advanced our laboratory's work on the historical ecology of parasitism, including April Bonifate, Zachary Child, Sarah Colosimo, Ellie Davis, Evan Fiorenza, Duncan Greeley, Ingrid Howard, Jonathan Huie, Elby Jones, Michiel W. P. Jorissen, Hiromi Katagiri, Aspen Katla, Nikol Kmentová, Jonathan Kwong, Julieta Martinelli, Abigail Moosmiller, Daphne Mueller, Justin Ng, Jessica Quinn, Angel Sar, Kara Skaw, Wouter Van Sever and Madison Weise.
Financial support
This work was supported by a CAREER Award from the United States National Science Foundation Division of Environmental Biology (NSF Grant Number 2141898), a Research Grant from the Cooperative Institute for Climate, Ocean, and Ecosystem Studies, a Sloan Research Fellowship from the Alfred P. Sloan Foundation, a University of Washington Innovation Award and two University of Washington Royalty Research Fund Awards. MPMV was mainly supported for collection-based parasite ecological work by the Belgian Federal Science Policy Office BRAIN pioneer project BR/132/PI/TILAPIA, Research Foundation – Flanders (FWO-Vlaanderen) research grant 1513419N and the Special Research Fund of Hasselt University (BOF20TT06).
Conflicts of interest
None.
Ethical standards
The authors assert that all procedures contributing to this work comply with the ethical standards of the relevant national and institutional guides on the care and use of laboratory animals.


 Open access