Childhood overweight and obesity pose a major public health concern worldwide, as they have shown to be responsible for increases in CVD risk factors( Reference Geiß, Parhofer and Schwandt 1 ), psychological problems( Reference Gibson, Allen and Davis 2 ) and orthopaedic problems( Reference Taylor, Theim and Mirch 3 ), among many other complications. Moreover, an extensive body of research indicates that children with obesity are at a higher risk of becoming adults with obesity compared to their counterparts without obesity( Reference Singh, Mulder and Twisk 4 ).
Although the aetiology of obesity is multifactorial and complex, it is clear that physical activity and dietary habits play important roles in the development of this disease as they can induce an energy imbalance and promote excessive fat deposition. Focusing on nutrition, a range of specific nutrients and foods have been suggested as important dietary determinants of obesity in childhood and adolescence, including fruit and vegetables( Reference Schwingshackl, Hoffmann and Kalle-Uhlmann 5 ), fibre( Reference Brauchla, Juan and Story 6 ) and sugar-sweetened beverages( Reference Luger, Lafontan and Bes-Rastrollo 7 ). Although the individual effect of the previously mentioned dietary components is important, it might not reflect the overall effect of diet. For this purpose, dietary energy density (ED) has been suggested as an appropriate measure of overall diet, specifically when evaluating the association between diet and obesity/adiposity( Reference Rouhani, Haghighatdoost and Surkan 8 ).
A recent systematic review aiming to evaluate the association between ED and obesity( Reference Rouhani, Haghighatdoost and Surkan 8 ) including fourteen studies with children and adolescents found inconsistent results in this population, with some studies showing an association between ED and body composition( Reference Alexy, Sichert-Hellert and Kersting 9 – Reference Ambrosini, Emmett and Northstone 11 ) and others reporting no significant associations between both variables( Reference Butte, Cai and Cole 12 – Reference Hebestreit, Börnhorst and Barba 14 ). Surprisingly, few studies( Reference Donin, Nightingale and Owen 15 ) including children assessed the association between ED and cardiometabolic risk factors (i.e. blood pressure and TAG levels), which have shown to be increased in children with obesity( Reference Skinner, Perrin and Moss 16 ). Although most studies presented body composition as an outcome variable, some studies used BMI, while others used body fat or anthropometric variables (skinfold thickness or waist circumference) as main outcomes, which could partly explain the mentioned inconsistent results among studies.
Another factor that could explain these inconsistencies is the definition of ED, as some researchers use solids to compute it (EDS), while others use a combination of solids and liquids (EDSL). McCaffrey et al. ( Reference McCaffrey, Rennie and Kerr 17 ) used five different classifications of ED and found that the definitions that did not include beverages showed the best association with changes in fat mass. Besides the definition of ED, it is obvious that other external factors could regulate the association between ED and body composition, such as physical activity, that was not registered in several previous studies( Reference Alexy, Sichert-Hellert and Kersting 9 , Reference McCaffrey, Rennie and Kerr 17 , Reference Kral, Berkowitz and Stunkard 18 ), or was registered through questionnaires( Reference Vernarelli, Mitchell and Hartman 19 – Reference Murakami, Miyake and Sasaki 21 ), which have shown to have a limited validity and reliability in previous studies( Reference Shephard 22 ).
Two studies evaluated the association between ED and body composition in children with obesity. The first developed by Butte et al. ( Reference Butte, Cai and Cole 12 ) found that ED did not predict weight gain during 1 year follow-up, while a recent study developed by Aburto et al. ( Reference Aburto, Cantoral and Hernández-Barrera 23 ) found a positive association between ED and overweight and obesity. Interestingly, the association was stronger when only plausible reporters (i.e. excluding from the analyses both under- and over-reporters) were considered. Taking into account that previous studies have found energy intake (EI) under-reporting to be more prevalent and severe among children and adolescents with a higher BMI( Reference Gomes, Luque and Xhonneux 24 , Reference Murakami, Miyake and Sasaki 25 ), identifying under-reporters when measuring the association between ED and body composition in children with overweight and obesity is of great importance.
It therefore seems timely to evaluate the association between ED and different body composition variables (i.e. BMI, adiposity) and cardiometabolic markers, taking into account levels of objectively measured physical activity, to ascertain whether ED is critical to body composition and whether physical activity modulates this association in children with overweight and obesity, a population in which EI under-reporting has been shown to be more prevalent and severe( Reference Gomes, Luque and Xhonneux 24 , Reference Murakami, Miyake and Sasaki 25 ). Consequently, the aims of the present study were (1) to evaluate the association of EDS and EDSL with adiposity and cardiometabolic risk in children with overweight and obesity, (2) to estimate the effect of under-reporting on the mentioned associations and (3) to assess whether the association between ED and body composition/cardiometabolic risk is influenced by levels of physical activity.
Methods
Participants
Participants were recruited from two different cities of Spain (Granada and Vitoria-Gasteiz), as part of two projects that are briefly explained below:
(a) The ActiveBrains project (NCT02295072) that is described in detail elsewhere( Reference Cadenas-Sánchez, Mora-González and Migueles 26 ) was developed in the city of Granada (south Spain) and aimed to examine the effects of a physical exercise program on brain, cognition, academic achievement as well as physical and mental health in 110 overweight or obesity participants aged 8–11. Although the ActiveBrains is a randomised controlled trial, data from the first cross-sectional evaluation were used for the present study (data collected from November 2014 to February 2016 in three different waves). The study protocol was approved by the Review Committee for Research Involving Human Subjects at the University of Granada (Ref. 848).
(b) The EFIGRO project (NCT02258126), developed in Vitoria-Gasteiz (north Spain), aimed to measure 160 children with overweight or obesity aged 8–12 and determine the effects of a multidisciplinary intervention on hepatic fat fraction and cardiometabolic risk factors. Data for the first cross-sectional evaluation were used for the present study (data collected from October 2014 to January 2017 in five different waves). The study protocol was approved by the Ethic Committee of Clinical Investigation of Euskadi (PI2014045). More details of the EFIGRO project can be found in the methodological manuscript( Reference Medrano, Maiz and Maldonado-Martín 27 ).
Following the inclusion criteria of the previously mentioned projects, the main inclusion criteria for the present study were as follows: (1) children between 8 and 12 years old, (2) children classified as overweight or obese based on the sex- and age-specific international BMI standards( Reference Cole and Lostein 28 ) and (3) children who were not taking medications that influenced the central nervous system function.
From all the measured participants of the ActiveBrains and the EFIGRO projects, 208 (101 from ActiveBrains and 107 from the EFIGRO project) presented complete data for body composition and accelerometry and were, therefore, included in the study. From the 208 included participants, six did not report their pubertal status, seven did not have blood samples and eighteen did not have data for dual-energy X-ray absorptiometry (DXA) abdominal regions (not collected due to technical reasons). These participants were included in the analyses and consequently the number of participants for each analysis varied slightly and is specified in the ‘Results’ section.
Body composition
Body composition assessments were performed in the morning in a non-fasted state.
Anthropometric variables
Using a wall stadiometer and electronic scale, respectively (SECA model), the height and weight were measured in children wearing minimal clothing and no shoes. BMI was calculated as weight in kilograms divided by the height in meters square, and participants were classified into BMI categories according to the World Obesity Federation cut-offs( Reference Cole and Lostein 28 ). Waist circumference was measured at the narrowest point by standard procedures with an anthropometric non-elastic tape (SECA 200).
Body fat
DXA (Hologic QDR 4500 W) was used to evaluate body composition. A whole-body scan was performed from which, whole-body fat percentage (BF%) and fat mass index (FMI), expressed as body fat divided by height expressed in meters square were obtained. In addition, a regional analysis was performed to assess abdominal adiposity following the protocol of previous studies( Reference Moliner-Urdiales, Ruiz and Vicente-Rodriguez 29 ). One region was calculated as a rectangle drawn on the digital scan image with the lower border of the rectangle at the lower horizontal border on the top of iliac crest and the upper border established parallel with the end of the lowest rib (this region was defined as R1 in previous studies( Reference Moliner-Urdiales, Ruiz and Vicente-Rodriguez 29 )). The lateral side of the defined region was adjusted to include all the body tissues. As this region might be larger (and therefore include more fat) in taller participants, it was adjusted by height and was called abdominal FMI.
Dietary intake assessment
Total energy intake
Following the European Food Safety Authority guidelines( 30 ), total EI was obtained from two non-consecutive 24 h recalls referring to weekdays which were collected by trained nutritionists, conducted in the presence of the child’s parents or legal guardians. A photographic manual of food portion size was used to improve the estimated amount of dietary intake. All data were registered by the Easydiet software (Biocentury©, S.L.U. 2016), which is the software supported by the Spanish Association of Dietetics and Nutritionists.
Dietary ED was calculated by following two different approaches.
(a) Only EDS: total EI from solid foods relative to total grams of solid foods consumed, which is expressed as kJ/g. This calculation was done based on solid foods only, excluding all energy-containing and non-energy-containing beverages (tea, coffee, water, soft drinks, fruit juice and milk).
(b) EDSL: the ED of food and energy-containing beverages.
Miss-reporters
The Goldberg( Reference Goldberg, Black and Jebb 31 ) and Black’s( Reference Black 32 ) equations (Table 1) were used to estimate the possible under- and over-reporters (children who reported non-plausible EI). This method is used to predict total energy expenditure using physical activity levels and BMR which was estimated with three different equations( Reference Lazzer, Patrizi and De Col 33 , Reference Schofield 34 ): the Schofield equation( Reference Schofield 34 ) and two different equations proposed by Lazzer( Reference Lazzer, Patrizi and De Col 33 ) both taking Tanner stage into account with one using body weight (Lazzerweight) and the other using fat mass and fat-free mass from DXA (LazzerDXA). The three equations are defined in Table 1. Previous validation studies demonstrated that the Goldberg equation presents a high predictive value for detecting under-reporters when compared to doubly labelled water( Reference Tooze, Krebs-Smith and Troiano 35 ). Specific details of the formula and used CV are presented in Table 1.
Table 1 Calculations of cardiometabolic (CM) risk, resting metabolic rate and number of under-reporters

CM risk 1, cardiometabolic risk score described by Alberti et al. ( Reference Alberti, Eckel and Grundy 59 ); N_, normalised value with Bloom technique (similar to z scores but all values go from −1 to 1). N_inverted HDL, values of normalised HDL multiplied by −1; CM risk 2, cardiometabolic risk score created by Martinez Vizcaino et al. ( Reference Martinez-Vizcaino, Martinez and Aguilar 58 ); MAP, mean arterial blood pressure; Lazzer 1, Lazzer equation taking into account body composition; FFM, fat-free mass; FM, fat mass; Lazzer 2, Lazzer equation taking into account weight; BW, body weight; EIrep, reported energy intake; PAL, physical activity levels; CVei, within-subject CV in energy intake; d, number of days of diet assessment; CVwb, CV of repeated BMR measurements or the precision of estimated compared with measured BMR; CVtp, total variation in PAL.
Cardiometabolic variables
Blood samples were collected after an overnight fast. Glucose was analysed using the glucose oxidase method with automatic analysers (Roche-Hitachi Modular P and D Autoanalyser; Roche Laboratory Systems), and plasma insulin was analysed by RIA using automatic microparticle analysers (Axsym; Abbott Laboratories). TAG, total cholesterol LDL and HDL were measured using an automatic analyser (Roche-Hitachi Modular P and D Autoanalyser). Blood pressure was assessed with the automatic OMRON®M6 device. Mean arterial blood pressure and two different cardiometabolic (CM) risk scores (following the indications of Nyström et al. ( Reference Nyström, Henriksson and Martínez-Vizcaíno 36 )) were calculated as described in Table 1.
Physical activity
For seven consecutive days (24 h), physical activity was assessed with tri-axial accelerometers (GT3x+ and wGT3X-BT; ActiGraph) attached to the non-dominant wrist. ActiGraph.csv files were analysed with R-package GGIR version 1.2 (http://cran.r-project.org)( Reference van Hees, Fang and Langford 37 ). Data of participants were included in the analyses if they recorded at least one weekend day and three week valid days (≥16 wearing hours), as previously recommended( Reference Migueles, Cadenas-Sanchez and Ekelund 38 ). Identification of waking and sleeping hours was done using an automatised algorithm guided by the times reported by the participants as explained by Van Hees et al. ( Reference Van Hees, Sabia and Anderson 39 ). The Hildebrand et al. ( Reference Hildebrand, Van Hees and Hansen 40 ) cut-off points were used to classify moderate to vigorous physical activity (MVPA).
Socio-demographic status
Parental educational level was registered for its known influence of nutritional status( Reference van Ansem, Schrijvers and Rodenburg 41 ). Mothers’ educational highest degree was registered, and mothers were classified as low education (compulsory secondary school), medium education (high school) and higher education (university). Pubertal development was registered through direct examination by trained paediatricians following the Tanner scale( Reference Tanner and Whitehouse 42 ).
Statistical analysis
Normality of the variables was checked with histograms. For non-normal variables, data were transformed to obtain normalised variables with mean 0 and standard deviation 1. Mean and standard deviations are presented for the whole sample and stratified by sex.
Power calculation and sample size estimations were computed based on the primary outcome in each of the studies which are reported in the corresponding methodological articles published elsewhere( Reference Cadenas-Sánchez, Mora-González and Migueles 26 , Reference Medrano, Maiz and Maldonado-Martín 27 ). The present study is based on a secondary analysis using baseline data from both studies, and therefore a specific power calculation was not developed for the present study.
Linear regression analyses were performed to explore the influence of ED on body composition and CM risk after adjustment for total EI, age, study centre, sex and mothers’ educational level. Further models were explored taking MVPA into account. MVPA by ED interactions were tested to determine whether MVPA influenced the association between ED and the outcome variables. All the previously mentioned regressions were also performed, stratifying participants according to compliance or no compliance with physical activity recommendations (sixty daily minutes or more of MVPA( 43 )).
A sensitivity analysis was conducted excluding under-reporters who were detected by the Goldberg method( Reference Goldberg, Black and Jebb 31 ) using three different equations( Reference Lazzer, Patrizi and De Col 33 , Reference Schofield 34 ) as shown in Table 1. Dietary differences between under- and plausible-reporters were evaluated with independent t tests (using under-reporters estimated with the Schofield equation( Reference Schofield 34 ) as it was the most used equation in the literature).
Cluster analysis was performed with EDS and minutes of MVPA. To be consistent with clustering methods reported in previous studies( Reference Prokasky, Rudasill and Molfese 44 , Reference Sanson, Letcher and Smart 45 ), two types of cluster analyses were used: hierarchical clustering (Ward’s method) and k-means clustering. To reduce the sensitivity of the Ward’s method to outliers, individual outliers and multivariate outliers (those with high Mahalanobis’distance values) for any variable were investigated. Hierarchical cluster analysis was initially used, as the numbers of clusters in the data were unknown beforehand. Number of clusters was determined by examining dendrograms, suggesting a solution for three cluster groups. k-Means cluster analysis was therefore performed with three possible solutions. This approach minimises the within-cluster variance and maximises the between-cluster distance, so that the resulting clusters are as homogeneous as possible. k-Means cluster analysis is considered superior to hierarchical methods because it is less sensitive to outliers and has been found to result in greater within-cluster homogeneity and between-cluster heterogeneity( Reference Eshghi, Haughton and Legrand 46 ).
One-way ANOVA with ED and MVPA variables were performed to classify and name the three cluster groups that emerged, that were described as healthy (low ED and high MVPA), inactive-low-ED (low ED and low MVPA) and average-MVPA-high-ED (high ED and medium MVPA). Finally, age, sex, study centre, total EI and mothers’ education-adjusted ANCOVA were performed to evaluate adiposity and cardiometabolic risk differences among cluster groups.
Results
Descriptive characteristics
Participant characteristics, dietary variables, body composition values, cardiometabolic risk markers and physical activity levels are detailed in Table 2. Briefly, the sample was 10·4 years old, with a mean BMI of 26·1 kg/m2, waist circumference of 84 cm and 41 BF%. Regarding dietary habits, participants reported an EI of 7284 daily kJ (1741 kcal) with an average EDS of 7·6 kJ/g (1·81 kcal/g) and EDSL of 9·5 kJ/g (2·28 kcal/g). BMR varied slightly depending on the used formula ranging from 5996 kJ (1433 kcal) with the LazzerDXA to 6204 kJ (1483 kcal) with the Schofield equation.
Table 2 Characteristics of the whole sample and stratified according to sex and study (Mean values and standard deviations)
CHO, carbohydrates; ED, energy density; FMI, fat mass index; BP, blood pressure; MAP, mean arterial pressure; MVPA, moderate and vigorous physical activity; Lazzer 1, Lazzer equation calculated with Tanner stage and height; Lazzer 2, Lazzer equation calculated with fat percentage from dual-energy X-ray absorptiometry.
* n 202 (96 girls and 106 boys).
† n 190 (85 girls and 105 boys).
‡ n 201 (94 girls and 107 boys).
§ n 204 (94 girls and 110 boys).
|| n 195 (88 girls and 197 boys).
¶ To convert kcal to kJ, multiply by 4·184.
Data for the comparison between under-reporters and plausible-reporters are presented in online Supplementary Table S1. Under-reporters presented lower values of total EI (5640 v. 7849 kJ (1348 v. 1876 kcal); P<0·001), EDS (6·69 v. 7·82 kJ/g (1·6 v. 1·87 kcal/g); P<0·001) and EDSL (4·31 v. 4·90 kJ/g (1·03 v. 1·17 kcal/g); P<0·001) when compared to plausible reporters. For all the body composition variables, under-reporters presented higher values than plausible reporters (online Supplementary Table S1).
Associations between dietary energetic density, body composition and cardiovascular risk
Neither EDS nor EDSL demonstrated significant associations with any of the body composition or cardiovascular risk variables when the whole sample was analysed (Tables 3 and 4).
Table 3 Linear regressions testing the influence of energetic density (only solids) on body composition variables and cardiometabolic (CM) risk scores

BF%, body fat percentage; FMI, fat mass index; ABD_FMI, abdominal fat mass index; CM risk1, CM risk score described by Alberti et al. ( Reference Alberti, Eckel and Grundy 59 ); CM risk 2, CM risk score created by Martinez Vizcaino et al. ( Reference Martinez-Vizcaino, Martinez and Aguilar 58 ); M1, model 1, adjusted by sex, age, mother’s education and total energy intake; M2, model 1+moderate and vigorous physical activity adjustment; DXA, dual-energy X-ray absorptiometry.
* P≤0·050.
† P<0·07.
Table 4 Linear regressions testing the influence of energetic density (solids and liquids) on body composition variables and cardiometabolic (CM) risk scores‡
BF%, body fat percentage; FMI, fat mass index; ABD_FMI, abdominal fat mass index; CM risk 1, CM risk score described by Alberti et al. ( Reference Alberti, Eckel and Grundy 59 ); CM risk 2, CM risk score created by Martinez Vizcaino et al. ( Reference Martinez-Vizcaino, Martinez and Aguilar 58 ); M1, model 1, adjusted by sex, age, mother’s education and total energy intake; M2, model 1+moderate and vigorous physical activity adjustment; DXA, dual-energy X-ray absorptiometry.
* P≤0·050.
† P<0·07.
‡ All models adjusted by sex, age, mother’s education and total energy intake.
When under-reporters were excluded (Table 3), EDS was significantly associated with BF% (LazzerDXA P=0·013, Lazzerweight P=0·008, Schofield P=0·005), FMI (LazzerDXA P=0·025, Lazzerweight P=0·014, Schofield P=0·008) and abdominal FMI (LazzerDXA P=0·040, Lazzerweight P=0·033, Schofield P=0·018). These results remained significant after adjusting for MVPA (Table 3, model 2). EDs was also significantly associated with BMI when the Schofield (P=0·019) and Lazzerweight (P=0·036) equations were used to detect under-reporters and remained significant after adjusting for MVPA (Table 3, model 2). A tendency was also found for the LazzerDXA equation when predicting BMI (P=0·053 and P=0·067 without and with adjustment of MVPA, respectively).
Regarding the association between EDSL and body composition when under-reporters were excluded (Table 4), EDSL was significantly associated with BF% (LazzerDXA P=0·031, Lazzerweight P=0·017, Schofield P=0·008) even after adjusting for MVPA (Table 4, model 2). EDSL was also associated with FMI when under-reporters were detected with the Schofield (P=0·026) and the Lazzerweight (P=0·040) equations, but only results for the Schofield equation remained significant after adjusting for MVPA (P=0·042 for the Schofield equation and P=0·055 for the Lazzerweight equation, Table 3, model 2).
No significant interactions were found between MVPA and ED in the performed linear regression models (P>0·10) for the whole sample. Nonetheless when under-reporters were excluded, the interaction terms for BF% (Schofield P=0·049) became significant. When the whole sample was stratified according to compliance with physical activity recommendations, no association was found between ED and any of the outcome variables for compliers (n 73) and non-compliers (n 135). When under-reporters were excluded, different results were found for compliers (n 63, 62 and 62 for the LazzerDXA, Lazzerweight and Schofield equations, respectively) and non-compliers (n 99, 95 and 95 for the LazzerDXA, Lazzerweight and Schofield equations, respectively). For the complier group, no significant association was found between ED and any of the outcome variables, while for the non-complier group positive association was found between ED, BF% (LazzerDXA P=0·016, Lazzerweight P=0·011 and Schofield P=0·004) and FMI (LazzerDXA P=0·080, Lazzerweight P=0·060 and Schofield P=0·024). Additional adjustment by MVPA did not modify results of the stratified aforementioned regressions.
Combined effect of energy density and moderate to vigorous physical activity: cluster analysis
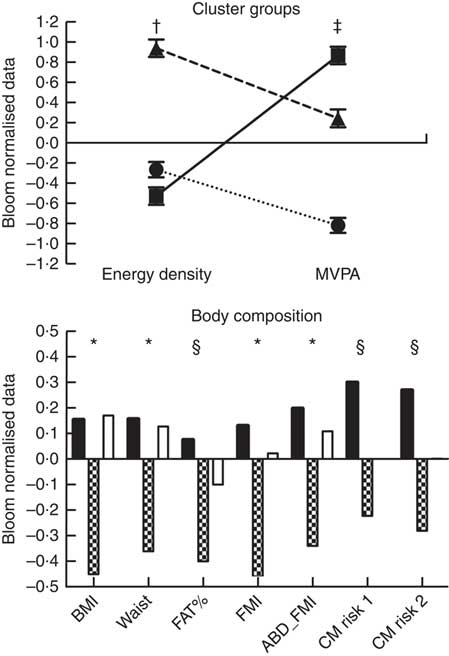
Finally, when analysing the cluster analysis results (Fig. 1), we observed that the healthy group (low ED and high MVPA levels) presented lower values of BMI (both P<0·001), waist circumference (both P<0·001), FMI (P<0·001 v. inactive-low-ED and P=0·006 v. average-MVPA-high-ED) and abdominal FMI (P=0·003 v. inactive-low-ED and P=0·015 v. average-MVPA-high-ED) when compared to the other two groups. The healthy group also presented lower values than the inactive-low-ED group for both estimated cardiovascular risk indexes (cardiorisk-1 P=0·005; cardiorisk-2 P=0·002) and BF% (P=0·003). No differences were found between inactive-low-ED and average-MVPA-high-ED for any of the measured variables (all P>0·05; Fig. 1).
Fig. 1 Cluster analysis results. Body composition comparisons adjusted by mothers’ education, study centre, sex, age and total energy intake. * Differences between the healthy group (low energy density (ED) and high moderate to vigorous physical activity (MVPA)) and the other two groups. † Differences between the average MVPA high ED and the other two groups. ‡ Differences among the three groups (P<0·05). § Differences between the healthy group (low ED and high MVPA) and the inactive and low ED group. ABD_FMI, abdominal fat mass index; CM risk 2, cardiometabolic risk score created by Martinez Vizcaino et al.
(
Reference Martinez-Vizcaino, Martinez and Aguilar
58
); CM risk 1, cardiometabolic risk score described by Alberti et al.
(
Reference Alberti, Eckel and Grundy
59
); FAT%, body fat percentage; FMI, fat mass index. ![]() ,
, ![]() , inactive and low ED;
, inactive and low ED; ![]() ,
, ![]() , healthy;
, healthy; ![]() ,
, ![]() , average MVPA and high ED.
, average MVPA and high ED.
Discussion
The main findings of the present study are (1) dietary ED is associated with higher total and abdominal adiposity in plausible reporters of dietary EI, with EDS showing stronger associations than EDSL, (2) the aforementioned association persists even after adjusting for MVPA. Nonetheless, when stratifying plausible reporters according to complying or not complying with physical activity recommendations, the inverse association between ED and adiposity disappears for the complying group and is maintained for the non-complying group. Those children with overweight/obesity with a combination of high MVPA levels and low dietary ED present a healthier body composition and cardiometabolic profile and (3) the effect of excluding under-reporters from the analysis is critical in the study of children with overweight and obesity. Although previous literature is inconsistent, the influence of dietary ED on body composition when under-reporters were excluded in our sample was clear, and we believe that inconsistencies found among previous studies( Reference Rouhani, Haghighatdoost and Surkan 8 ) could partly be explained by some of the findings discussed below.
On the one hand, it becomes clear that EDS and EDSL do not show the same association with adiposity in overweight and obese children, as only EDS significantly predicted BMI and abdominal FMI. This is in line with previous studies performed with participants without obesity, which also found that ED calculated with only solids demonstrated better association with body composition in children( Reference McCaffrey, Rennie and Kerr 17 , Reference Johnson, Wilks and Lindroos 47 ) and adults( Reference Yin, Xue and Chen 48 ) compared to ED calculated with solids and liquids. We thought it was important to evaluate whether the differences in ED calculation also emerged when evaluating children with overweight and obesity, as their intake of sugar-sweetened drinks might be higher, which, in turn, could modify the association between EDSL and body composition. Differences between the association of EDS and EDSL with body composition found in the present and in previous studies could be due to the different effects that drinks and solid foods have on satiety( Reference DiMeglio and Mattes 49 ) and to the differences in ED between solids and liquids, as beverages tend to have a high water content and low ED. Consequently, the inclusion of beverages in ED calculations will lower the ED of the entire meal and bias the association between ED and body composition towards the null as seen in our and previous studies( Reference McCaffrey, Rennie and Kerr 17 , Reference Yin, Xue and Chen 48 ).
On the other hand, we found that the association between ED in plausible reporters and adiposity was only significant for some variables; likewise, EDS was associated with BF%, FMI and abdominal FMI, all measured with DXA, but did not show an association with less accurate proxies of body fat such as waist circumference or BMI (when excluding under-reporters with the LazzerDXA equation). Regarding the association of ED and these proxies, literature is inconsistent, as some studies show positive associations( Reference Murakami, Miyake and Sasaki 21 , Reference Schröder, Mendez and Gomez 50 ), while others do not( Reference Hebestreit, Börnhorst and Barba 14 , Reference Günther, Stahl and Buyken 51 ). Nonetheless, these are just proxies, with the measurement of body fat being more important. To the best of our knowledge, the only previous study that evaluated ED and body composition of children with obesity with DXA was the Viva la familia study( Reference Butte, Cai and Cole 12 ). This study used total body mass gain (during 1 year follow-up) as an outcome variable, finding that ED did not significantly predict weight gain. DXA variables (fat mass and fat-free mass) were not used as outcome variables in the aforementioned study and, therefore, comparisons with our findings in children with overweight/obesity are not possible. Regarding children without obesity, three previous studies evaluated the influence of ED on body fat measured with DXA, with two of them reporting positive association between both variables( Reference Ambrosini, Emmett and Northstone 11 , Reference Johnson, Mander and Jones 52 ), and one developed by Kral et al. ( Reference Kral, Berkowitz and Stunkard 18 ) not finding significant associations. Kral et al. suggested that sample size (n 49) might have been too small to detect significant association between the two variables. Moreover, although 3-d weighed food records were used in the previous study, there was no control for under-reporters that have shown to affect the results in our and previous studies( Reference Donin, Nightingale and Owen 15 , Reference Aburto, Cantoral and Hernández-Barrera 23 , Reference Johnson, van Jaarsveld and Emmett 53 ).
The effect of excluding the under-reporters from the analysis was large in the present sample. They presented higher adiposity values, 27 % lower EI, 18 % lower levels of MVPA and more importantly a significantly lower ED when compared to plausible reporters, as published previously( Reference Johnson, van Jaarsveld and Emmett 53 ). This lower ED found in under-reporters could bias the association between ED and body composition variables towards the null if not accounted for in the analysis, explaining why no association was found between ED and body composition variables when the whole sample was analysed. The findings of MVPA not modifying the association between ED and body composition (only FMI for one equation passed from P 0·040 to P 0·055) are of great importance, as it demonstrates that ED is crucial for children with overweight and obesity even when taking into account their levels of physical activity. Nonetheless, this does not mean that MVPA is not determinant of adiposity in this population, as when the sample was stratified according to compliance with physical activity recommendations, no significant association was found between ED and body composition or cardiovascular risk variables in the complier group. Moreover, from the cluster analysis, it became clear that those who performed the highest levels of MVPA and showed low levels of ED presented the healthier profile for all the measured variables.
In agreement with a previous study( Reference Donin, Nightingale and Owen 15 ), ED was not directly associated with cardiometabolic risk in children. This lack of association could be partly explained by the characteristics of the measured sample, a homogeneous group of overweight and obese children who showed high cardiometabolic marker values when compared to previous studies( Reference Nyström, Henriksson and Martínez-Vizcaíno 36 ) using the same methodology in normal-weight children (systolic blood pressure 106 v. 99, diastolic blood pressure 66 v. 61, TAG 89 v. 61, HDL 50 v. 62, LDL 103 v. 95 in our study v. Nyström et al. ( Reference Nyström, Henriksson and Martínez-Vizcaíno 36 ) study, respectively). It is possible that if a more heterogeneous sample of both children with normal weight and overweight had been included, significant associations between ED and cardiometabolic risk would have been found, as seen in previous studies that included both normal weight and overweight children( Reference Appannah, Pot and Huang 54 ). Although the associations between ED and cardiometabolic risk were non-significant, in the cluster analysis, the healthy group presented significantly lower cardiometabolic risk than the inactive-low-ED, and no differences with the average-MVPA-high-ED. These findings suggest that MVPA levels in children with obesity might be determinant of cardiometabolic risk, which is in line with previous studies that underlined the importance of physical activity on cardiometabolic risk factors in children( Reference Hallal, Andersen and Bull 55 ).
Although the current study presents several strengths such as the measurement of objective physical activity, body fat with DXA and collection of cardiometabolic risk markers, it also presents several limitations. First, 24 h recalls were only collected for weekdays, and the photographic manual used to help participants select portion sizes is still in the process of being validated. It is therefore important to notice that results could be biased by the previously mentioned tool and by the use of only weekdays, as previous research has demonstrated important differences between week and weekend days( Reference Hoffmann, Marx and Burmeister 56 ). Second, the cross-sectional nature of the study does not allow for a cause–effect conclusion, and although we found associations, these do not imply that a higher ED intake will necessarily mean an increase in the measured body composition variables. Moreover, body composition assessments were performed during the morning in a non-fasted state, which could affect the quantification of lean and fat mass( Reference Kerr, Slater and Byrne 57 ). Third, non-energy-containing beverages, such as water, tea or diet soda, were not included in the ED calculations and therefore the findings of the present study could have been different if the whole diet of each participant had been taken into account. Finally, although the present study included a homogeneous sample of 8- to 12-year-old overweight and obese children, the sample size was smaller compared to the previous similar studies( Reference Hebestreit, Börnhorst and Barba 14 , Reference Murakami, Miyake and Sasaki 21 ) that included heterogeneous samples. This sample size could entail a low power and a type II error, and therefore it is possible that if a larger sample size had been analysed further associations would have been found between ED and cardiometabolic markers.
Summarising, findings from the present study suggest that dietary ED is associated with total and abdominal adiposity in children with overweight and obesity when under-reporters are excluded from the analysis. The large inconsistencies among previous studies could be due to the use of different ED calculations, the use of different methodologies to estimate body fat mass and under-reporting concerns (as for the present study, most results were modified when excluding under-reporters). Those overweight and obese participants who performed high levels of MVPA and presented a low ED intake demonstrated the healthier profile for both body composition and cardiometabolic risk variables. In conclusion, findings from the present study suggest that children with overweight or obesity with a low ED intake and high levels of MVPA present healthier body composition and cardiometabolic profiles when compared to children with overweight or obesity who perform lower amounts of MVPA and have a higher ED intake. Consequently, nutritional programs aiming to prevent or treat childhood obesity should try to avoid high EDS foods and promote physical activity. These findings might have important public health implications, yet they need to be confirmed by randomised controlled trials that target both diet density and MVPA.
Acknowledgements
We thank the participation of the children and parents in this study.
The research leading to these results has received funding from ‘la Caixa’ Foundation and Triptolemos Foundation, the Ministry of Health (FIS PI081297), the Research Network on Preventative Activities and Health Promotion (RD06/0018/0038), the Henning and Johan Throne-Holst Foundation (F. B. O.), the Spanish Ministry of Education, Culture and Sport (FPU14/03329 to M. M.), the Spanish Ministry of Economy and Competitiveness (DEP2013-47540 and DEP2016-78377-R; BES-2014-068829 to C. C.-S.), Fondo de Investigación Sanitaria del Instituto de Salud Carlos III (PI13/01335), Fondos Estructurales de la Unión Europea (FEDER), Una manera de hacer Europa, the Spanish Ministry of Science and Innovation (RYC-2011-09011 to F. B. O.), the University of Granada, Plan Propio de Investigación 2016, Excellence Actions: Units of Excellence, Unit of Excellence on Exercise and Health (UCEES), Programa de Captación de Talento – UGR Fellows (L. G.-M.), the SAMID III network, RETICS (PN I+D+I 2017-2021).
This study has been partially funded by the University of Granada, Plan Propio de Investigación 2016, Excellence actions: Units of Excellence; Unit of Excellence on Exercise and Health (UCEES), and by the Junta de Andalucía, Consejería de Conocimiento, Investigación y Universidades and European Regional Development Fund (ERDF), reference SOMM17/6107/UGR.
ISCIII-Sub-Directorate General for Research Assessment and Promotion, the European Regional Development Fund (RD16/0022), the EXERNET Research Network on Exercise and Health in Special Populations (DEP2005-00046/ACTI), and the University of the Basque Country (GIU14/21). J. M.-G. is supported by the Spanish Ministry of Education, Culture and Sport (FPU14/06837). J. H. M. is supported by the Spanish Ministry of Education, Culture and Sport (FPU15/02645).
L. A. received a grant from the Education Department of the Government of the Basque Country (PRE_2016_1_0057, PRE_2017_2_0224, PRE_2018_2_0057).
Collected the data: V. M.-H., J. M.-G., E. M.-R., M. O., J. H. M., L. A., M. M., W. D. M.-A., J. M., I. T., I. L. and F. B. O. Performed the statistical analyses and drafted the manuscript: A. G.-B. Reviewed the manuscript: L. A., M. M., J. M.-G., C. C.-S., J. H. M., V. M.-H., E. M.-R., W. D. M.-A., J. M., M. O., I. T., L. G.-M., G. V.-R., F. B. O. and I. L. Conceived and planned the experiments: F. B. O. and I. L. Coordinated the project: F. B. O., I. L., L. A. and G. V.-R. Approved the final version: A. G.-B., L. A., M. M., J. M.-G., C. C.-S., J. H. M., V. M.-H., E. M.-R., W. D. M.-A., J. M., M. O., I. T., L. G.-M., G. V.-R., F. B. O. and I. L.
On behalf of all authors, A. G.-B. states that there is no conflict of interest. All authors have nothing to disclose.