


INTRODUCTION
The investigated loessic sequence is located in the south-eastern part of the Carpathian Basin at a terrace position on the Petrovaradin rock (the northernmost edge of the Fruška Gora Mountain), on the right bank of the Danube River (Fig. 1). The strategic significance of the Petrovaradin rock and surroundings initiated its continuous occupation since the Middle Paleolithic. Excavations conducted during 2003 and 2004 yielded thousands of Middle Palaeolithic artifacts from the lower part of the stratigraphic sequence, representing the most convincing evidence of the settlement of Neanderthal groups in the Serbian part of the Danube Basin so far (Mihailović, Reference Mihailović2009). The artifacts were attributed to the Charentian of Southeastern Europe (GáboriCsánk, Reference Gábori-Csánk1968; Gabori, Reference Gábori1976), previously recorded only at sites in Croatia (Krapina, Veternica) and Hungary (Érd). The recovered finds included massive bifacially flaked sidescrapers, similar to those from the early Micoquian from the north of the Carpathian Basin (Kozłowski, Reference Kozłowski2016).

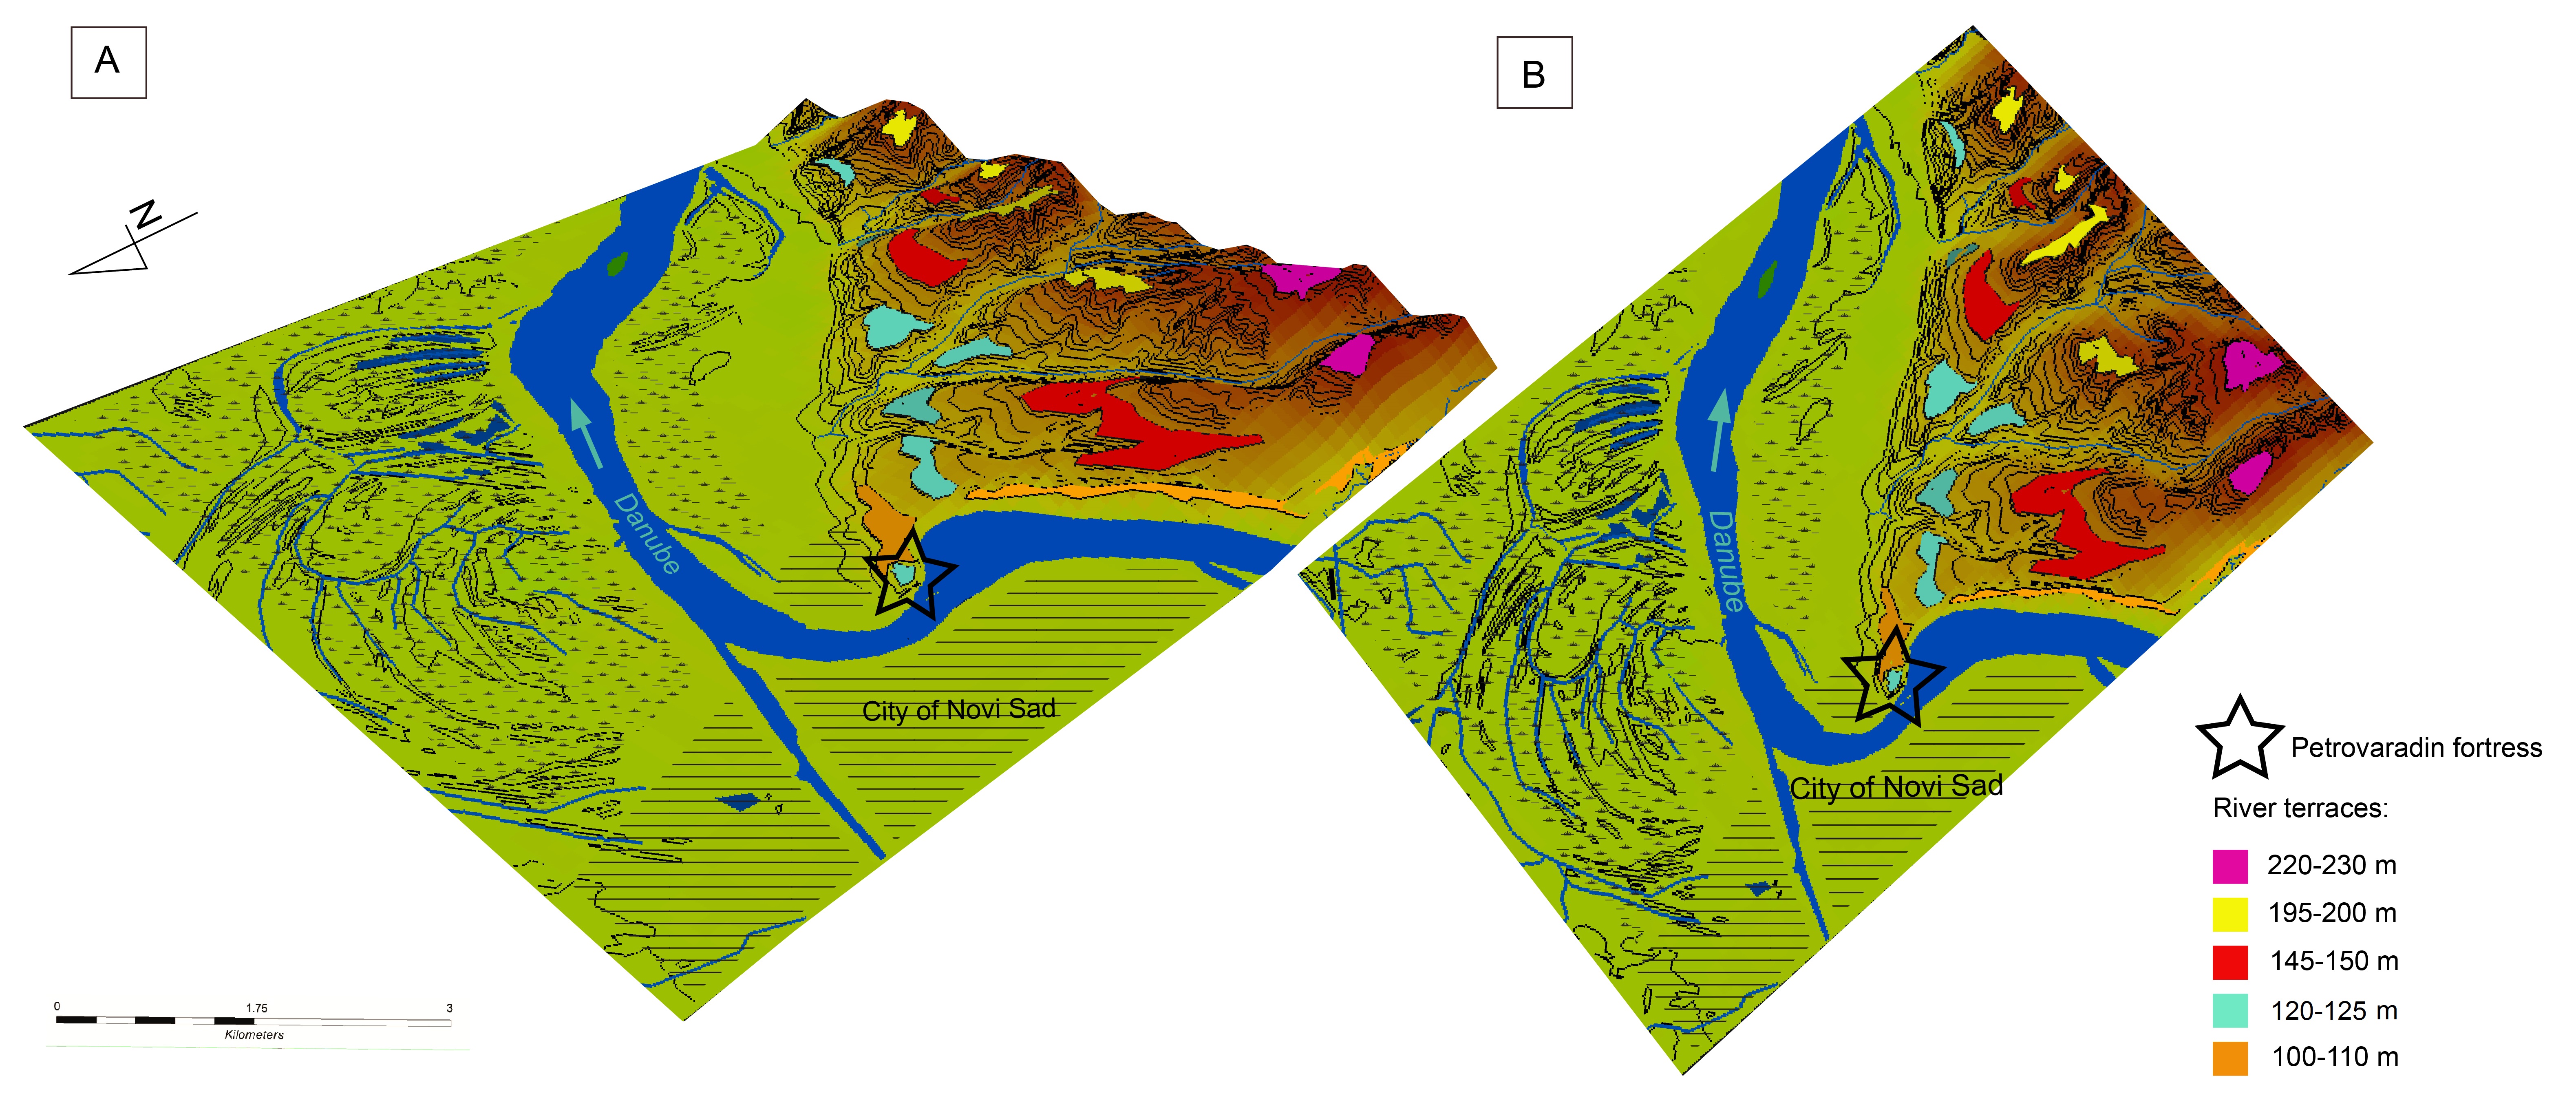
Figure 1. (color online) (A) Map of the Vojvodina region with the geographical positions of the main loess sections (Lehmkuhl et al., Reference Lehmkuhl, Bösken, Hošek, Sprafke, Marković, Obreht and Lindner2018, modified). (B) Morphological map of the study area. (C) Detailed map of Petrovaradin Fortress with excavated sectors: 1– excavation 2003–2004, and 2 – excavation 2011 (Mihailović, Reference Mihailović2009; modified).
Beyond the evident importance of the site, many concerns remain regarding the context of the finds, the chronology, and the paleotopographic factors which might have influenced the settlement of the Petrovaradin rock. These issues are further complicated by the lack of faunal remains which might have more clearly revealed the mobility of communities and the nature of the activities performed in the settlements.
In this paper, we discuss geoarchaeological data from the Petrovaradinloessic section on top of the Danube terrace at 120–125 m above mean sea level (amsl) with the aim of summarizing its geomorphological and environmental evolution and existing neotectonic interpretations (Toljić et al., Reference Toljić, Matenco, Ducea, Stojadinović, Milivojević and Đerić2013) as a background for human occupation. The results provide new insight and a better understanding of environmental and paleotopographic conditions during the Middle Palaeolithic occupation in the poorly investigated southeastern Carpathian Basin (Marković et al., Reference Marković, Oches, Jovanović, Gaudenyi, Hambach, Zöller and Sümegi2004a, Reference Marković, Mihailović, Oches, Jovanović and Gaudenyi2004b, Reference Marković, McCoy, Oches, Savić, Gaudenyi, Jovanović, Stevens, Walther, Ivanišević and Galić2005; Mihailović, Reference Mihailović2009).We summarize paleoclimatic inferences and compare climatic conditions in the Vojvodina region with climatic changes recorded in other parts of the Eurasian loess belt.
A brief geological setting
The first mention of Petrovaradin Fortress in a geological way, was by Beudent who reported that the fortress was built on serpentinite (Čičulić-Trifunović and Rakić, Reference Rakić1977). The first geological monograph of Fruška Gora Mountain was made by A. Koch in “Geologie der Fruška Gora” (1895). In the highest zones of the mountain, Paleozoic and Mesozoic metamorphic formations are exposed. In the Mesozoic era, the Fruška Gora Mountain and the adjacent region were covered by the Tethys Ocean, leaving a stratigraphic imprint of marine sediment series of considerable thickness. The exhumation of the central part of the mountain started at ~28 Ma. Large-scale elongation of the mountain chain took place during the extension of the Pannonian Basin and was associated with coeval translations and clockwise rotations of the Fruška Gora Mountain (Toljić et al., Reference Toljić, Matenco, Ducea, Stojadinović, Milivojević and Đerić2013). Further information about the geologic setting can be found in the Supplementary Material.
Quaternary sediments of the Fruška Gora Mountain are susceptible to mass wasting and intensive erosion. They are very vulnerable to hazards because of their topographic, geomechanical, and hydrogeological properties. Deluvial and proluvial sediments resulted from erosion triggered by tectonic disturbance during the Pliocene and Pleistocene. They are overlain by loess (Mészáros, Reference Mészáro2013). Pleistocene loess was well studied in the brickyards of Petrovaradin and Mišeluk, where loess-paleosol sequences exist (Marković et al., Reference Marković, Oches, Jovanović, Gaudenyi, Hambach, Zöller and Sümegi2004a, Reference Marković, McCoy, Oches, Savić, Gaudenyi, Jovanović, Stevens, Walther, Ivanišević and Galić2005). Holocene sediments were deposited by the Danube and its tributaries at the northern slopes of the Fruška Gora Mountain (Čičulić-Trifunović and Rakić, Reference Rakić1977).
The Fruška Gora Mountain shows numerous faults, and it was volcanically active in the past (Cvetkov et al., Reference Cvetkov, Lesić and Vasković2012). It is known that the Carpathian basin is still subsiding, and the estimation for the subsidence rate in Bačka is 2 mm/yr, while for Srem it is 1 mm/yr based on the tectonic map by Marović et al., Reference Marović, Djoković, Pešić, Radovanović, Toljić and Gerzina2002. A dense network of longitudinal (E-W) and transverse (N-S) ruptures, normal, reverse, thrust and strike-slip faults are observed in the Fruška Gora Mountain (Vitális, Reference Vitális1988; Marovic et al., Reference Marović, Djoković, Pešić, Radovanović, Toljić and Gerzina2002). The boundary of the mountain is represented by the Danube Dislocation which follows the course of the river, and the boundary at the south is the Fruška Gora Mountain detachment fault. Both have an E-W direction (Toljić et al., Reference Toljić, Matenco, Ducea, Stojadinović, Milivojević and Đerić2013).
Geomorphological setting
River terraces in the Fruška Gora Mountain area have been studied previously by Cholnoky (Reference Cholnoky1910), Gorjanović-Kranberger (Reference Gorjanović-Kranberer1921), Bulla (1941), Milojević (Reference Milojević1949) and Bukurov (Reference Bukurov1953). All these studies are predominantly descriptive, with unknown chronology. Bukurov (Reference Bukurov1951, Reference Bukurov1952, Reference Bukurov1953) mentioned terraces at 490–539 m, 380–400 m, 310–360 m and 180–230 m asl, and he considered these landforms as fossil marine abrasive platforms and lake shorelines shaped by the receding Pannonian lake. But other authors (Milić, Reference Milić1973) indicated that they were the result of fluvial action. Although there is little evidence of typical coastline material, some authors suggest that the terraces between 180 and 240 m are most likely of abrasive origin (Košćal et al., Reference Košćal, Menković, Knežević and Mijatović2005). It is clear that the formation of the terraces needs further systematic study.
When speaking about the fluvial terraces, Bukurov (Reference Bukurov1951, Reference Bukurov1953, Reference Bukurov1978) noticed the terrace at 110 m which he described as uneven, pointing towards the Danube, consisting of loess, and incised by small rivers coming from the mountain. According to those studies, two river terraces along the Fruška Gora Mountain, with relative height of 3 m and 7 m above the river, are equivalents of what he called the alluvial terrace and the loess (last glacial) terrace on the left lowland side of the Danube, respectively.
The cross-section A-B-C in Figure 2 starts at the highest river terrace, it crosses the Petrovaradin fortress, the Danube River, and it finishes at the Bačka loess plateauin the north of the Vojvodina province. The profile crosses the Jegrička River at 77 m asl and the Danube-Tisza-Danube Canal at the southern part of the Bačka loess plateau at 83 m asl. The green color in Figure 2B indicates the Holocene floodplain and lowermost terrace, below 85 m asl. The terraces at the Fruška Gora Mountain are shown at scale, while the rest of the terrain is not at scale as indicated in the figure. The vertical dimension stays to scale. Under the topographic profile of the terraces the general geology is given.

Figure 2. (A) DEM of northern slopes of Fruška Gora Mountain and Bačka lowland. White line indicates the cross section A-B-C. (B) Terraces at Fruška Gora Mountain made in scale. (C) A cross section A-B-C, including the main geological formations. The vertical dimension is in the scale. (For interpretation of the references to color in this figure legend, the reader is referred to the web version of this article.)
The present topographic mapping has enabled the distinguishing of terraces at surface levels of 90–100 m asl, 120–125 m asl, 145–150 m asl, 195–200 m asl, and 220–230m asl. The elevation of the present-day Danube floodplain at Petrovaradin Fortress is ca. 79 m asl. The topographic surface at the fortress is at 125 m asl and the (irregular) top of the bedrock is around 123 m asl. Consequently, we conclude that the fortress was built on the 120–125 m asl terrace.
In the explanation of the geological map of Fruška Gora Mountain, three river terraces were identified (Čičulić-Trifunović and Rakić, Reference Rakić1977):
1. The terrace at 60–80 m above the Danube level (approximately 75 m asl) is the oldest river terrace at the right bank of Danube in the Fruška Gora Mountain. It is composed of gravels in the lower parts, sand in the upper parts, and covered by loessic clays.
2. The terrace at 25–35 m relative height is dislocated by numerous streams and covered by loess.
3. The terrace at 10–15 m is known as a southern loess Bačka terrace according to Bukurov (Reference Bukurov1953). It has recognizable 4–8m cliffs in meanders of the Danube (Figs. 2A, 2C). It is up to 20 km wide, made by accumulative fluvial processes (Čičulić-Trifunović and Rakić, Reference Rakić1977).
The highest terrace of the geological map fits to the terrace at 145–150 m asl in this study, and the lower terrace (25–35 m above the river) fits the one at 100–110 m asl in the present study (Figs. 2B, 2C). The lowest terrace mentioned above is the one surrounding the city of Novi Sad at the north, and it is not present on the mountain.
METHODS
A section just below the foundations of the fortress inside of the Novi Sad City Museum was described and sampled for grain-size analysis and luminescence dating in 2011. The precise position of the investigated section is indicated in Figure 1B and Figure 1C. From a morphological point of view, the fortress is situated on top of a Danube terrace. The stratigraphic position of that terrace within the Danube terrace staircase has been determined by mapping the terrace elevation above the Danube River using topographic maps of the south side of the Danube around Petrovaradin (Fig. 1).
Sampling for grain-size analysis was performed at a 5 cm resolution. The samples were prepared according to the methods described by Konert and Vandenberghe (Reference Konert and Vandenberghe1997). A few grams of the sediment were pre-treated with H2O2 and HCl to remove organic matter and carbonates respectively. All our samples were analyzed with a laser particle sizer (HELOS from SYMPATEC). A grain-size distribution shows up to 56 size classes in the range between 0.15 μm and 2000 μm. The grain-size populations are primarily characterized by their modal grain-size, and by their sorting and skewness. The relative proportion of a specific grain size interval is considered (e.g., clay or sand fraction). The clay-silt boundary is kept at 5.5 μm (according to Konert and Vandenberghe, Reference Konert and Vandenberghe1997). Especially in loess, the U-ratio is successfully applied to indicate the proportion of medium and coarse-grained (44–16 μm) versus fine-grained silt (5.5–16 μm; Vandenberghe et al., Reference Vandenberghe1985). It is especially suitable to interpret the sedimentary environment by eliminating the pedogenic (mostly submicron) clay, as that fraction may be (partly) the result of weathering and soil formation.
Parallel samples for low fieldmass specific magnetic susceptibility (MS) analysis were taken from the site. Magnetic susceptibility is defined as the ratio of induced magnetization to the intensity of the inducing magnetic field. Samples were air-dried, crushed, and placed in non-magnetic plastic boxes. The volume of each box was 6.4 cm3. Before the boxes were closed, cotton wool was added to each sample to prevent sediment movement inside the box. The frequency used for low field MS was 300 Hz. The instrument used for measurement was a Bartington MS2.
Bulk sediment samples were sieved down to 63 μm and dried at 105°C for 12h in preparation for geochemical analysis. An 8g quantity of the sieved material was mixed with 2g Fluxana Cereox wax, homogenized and compressed to apelletunder 19.2 MPa for 120 s. The measurements were conducted using a pre-calibrated method. Samples were analyzed in duplicate for major and trace element abundances with polarized energy dispersive X-ray fluorescence (EDPXRF) using a SpectroXepos. The chemical weathering indices used in this study are the Chemical Index of Alteration in which CIA=((Al2O3/(Al2O3+Na2O+CaO∗+K2O))×100 as described by Nesbitt and Young (Reference Nesbitt and Young1982), and the Chemical Proxy of Alteration in which CPA=(Al2O3/(Al2O3+Na2O))×100 as described by Buggle et al. (Reference Buggle, Glaser, Hambach, Gerasimenko and Marković2011). The elements Ba, Sr, and Rb become available for pedologic processes through weathering of mainly K-feldspars, but Ba and Rb are more retained in clay than Sr (Nesbitt et al., Reference Nesbitt, Markovics and Price1980; Négrel, Reference Négrel2006). Thus, the Ba/Sr and Rb/Sr ratios are controlled by the weathering intensity and leaching intensity (Bokhorst et al., Reference Bokhorst, Beets, Marković, Gerasimenko, Matvviishina and Frechen2009).
The age of the sediments covering the terrace was determined by optically stimulated luminescence (OSL) dating. Samples were taken by hammering metal tubes into the cleaned section. In total, seven samples were analyzed for equivalent dose (De) determination using a modified single-aliquot regenerative (SAR) OSL (Murray and Wintle, Reference Murray and Wintle2000, Reference Murray and Wintle2003) protocol on the quartz 4–11 μm fraction. Samples were wrapped in light-tight black plastic bags immediately after being removed from the sections and were processed in the Royal Holloway Luminescence Dating Laboratory under subdued red light. Light-exposed sediment at the ends of tubes was excluded from De determinations but retained for radioisotope measurements (to determine dose rate). Carbonates and organic matter were removed from the De (unexposed) fractions using 0.1 M HCl and 15%H2O2. Quartz was isolated by immersion in 35% H2SiF6 for ca. 2 weeks with a subsequent 0.1 M HCl wash to remove fluorite precipitates. The fine silt fraction (4–11 μm) was obtained by Stokes' law of settling. De measurements were performed on a Risø TL-DA-15 TL/OSL reader. A blue LED stimulation source (470 nm, ca. 80mW.cm−2) was used on samples and the OSL signal was measured using a 9235QA photomultiplier tube filtered by 6 mm of Hoya U340 (Bøtter-Jensen et al., Reference Bøtter-Jensen, Bulur, Duller and Murray2000). The signal was integrated from the first 0.7 s of stimulation minus an early background signal comprising 1.6–16.0 s of stimulation. All growth curves were fitted using a saturating function (I=Io+Imax (1-e-D/Do)+D.g). Aliquots yielding recycling ratios (Murray and Wintle, Reference Murray and Wintle2000) or IR ratios (Duller, Reference Duller2003) differing from unity by greater than 10% were rejected. Recuperation was normally negligible. The uncertainty on individual De values was estimated using Monte Carlo simulation and a weighted mean De (with one standard error uncertainty) was calculated for each sample (8–12 aliquots). Prior to De determination, a series of dose recovery preheat plateau tests were conducted on five of the samples, with the results informing the choice of preheat parameters in the SAR protocol.
Dose rates were calculated from uranium, thorium and potassium contents measured using Inductively Coupled Plasma Mass Spectrometry (ICP-MS) and Atomic Emission Spectrometry (AES). ICP samples were prepared by sodium peroxide fusion. Dose rates were calculated using in situ water contents as measured in samples taken from the section, ranging from 11–17% (±10%), and an alpha efficiency of 0.04 ± 0.02 (Rees-Jones, Reference Rees-Jones1995). Alpha and beta attenuation were obtained using calculations in Bell (Reference Bell1980) and Mejdahl (Reference Mejdahl1979), respectively, and dose rate conversion factors were taken from Adamiec and Aitken (Reference Adamiec and Aitken1998). Uncertainties are based on the propagation, in quadrature, of individual errors for all measured quantities, which if unknown are taken as 10%. In addition to the uncertainties calculated from counting statistics, errors taken into account were also: 1) beta source calibration (3%; Armitage and Bailey, Reference Armitage and Bailey2005), 2) radioisotope concentration (3%), 3) dose rate conversion factors (3%), and 4) attenuation factors (3%); (Murray and Olley, Reference Murray and Olley2002). The cosmic dose was calculated using present–day burial depth (Prescott and Hutton, Reference Prescott and Hutton1994).
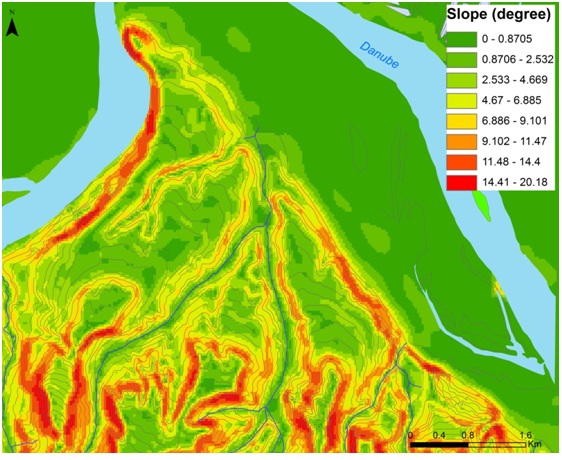
Mapping of the Fruška Gora Mountain was based on digitizing the topographic map, section Novi Sad 378-4-1 1:25.000 (Bessel ellipsoid, Gauss–Krüger coordinate system), made by the Military Geographical Institute from Belgrade in 1984, with the equidistance of 10 meters. The software used for analysis was ArcMap and ArcScene, for 2D and 3D images, respectively. The DEM model was created and the slope map was made via Slope 3D analysis in order to indicate the plain surfaces on the mountain.
RESULTS
Section description and grain-size properties
The fortress of Petrovaradin is built on a Mesozoic (Triassic-Jurassic) ophiolite sequence composed mostly of diabase that is partly metamorphosed into greenschist. This diabase-greenschist slice is part of a much larger ophiolite sequence that represents relicts of the Neotethyan oceanic floor, which occur on the Fruška Gora Mountain (Čičulić-Trifunović and Rakić, Reference Rakić1977, Toljić et al., 2013).
The uppermost part of the section is heterogeneous, slightly clayey, gravelly coarse-grained sand with angular blocks representing the constructional material of the fortress building. Below, a section of 1.95 m of undisturbed fine-sandy silt with dispersed pebbles was exposed, overlying the solid bedrock that served as the foundation for the fortress. No terrace gravels are exposed in the studied sectiondespite the morphological position at the top of a terrace of the Danube River. There were no remnants of any interglacial soil formation below 1.95 m.
A description of the 1.95 m unconsolidated sediments, from top to bottom (Fig. 3), follows:

Figure 3. (color online) (A) Optically Stimulated Luminescence ages from the Petrovaradin Fortress section (Table 1) on the left side, sedimentary units from the text are on the right side of the profile excavated in 2011. (B) Labeling of sedimentray layers at profile excavated in 2003 by Mihailović (Reference Mihailović2009).
Table 1. Sample numbers, depths, De, dosimetry and age data (DR = dose rate) for luminescence samples from Petrovaradin (radioisotope concentrations and cosmic dose rate are quoted with 10% errors). Water contents (WC in %) were taken from individual samples with 10% uncertainty assigned. “n” represents the number of aliquots used in De determination as a proportion of total analysed. PH = preheat combination applied.

UNIT I 0.00–0.15 m: homogeneous, pale-brown (upper part) to brown (lower part) silt matrix without pebbles, contains many black spots; resembles a weakly developed steppic soil; the lower boundary consists of angular blocks occasionally up to 10 cm but mostly less than 5 cm in diameter;
UNIT II 0.15–0.35 m: transitional zone without black spots, containing dispersed pebbles and blocks up to 10 cm diameter;
UNIT III 0.35–0.75 m: pale to pale-brown, poorly sorted, sandy coarse-grained silt with dispersed, angular pebbles up to 5 cm diameter, contains root fissures, no lamination; discontinuous pebble string at the base;
UNIT IV 0.75–1.40 m: same composition as Unit III but showing some faint oblique lamination; pebble string at the base, with some crotovinas; and
UNIT V 1.40–1.95 m: silty fine-grained sand; top part shows a dark-brownish color with white spots, interpreted as an embryonic soil with some crotovinas; gravel string at the base overlying pale loess-like sediment occurs at the very base of the section.
In general, the average grain size (modal value between 44 μm and 55 μm) is uniform over the entire section. The detailed grain-size analysis shows a clear boundary between the upper and lower part, separated by a transitional zone at 1.40–1.60 m. The U-ratio is between 1.70 and 1.75 from the top until a depth of 1.40 m. Below the transitional zone, the U-ratio increases considerably up to a value of 2.75 at 1.70 m depth. Similarly, the clay content decreases slightly from ~20% (upper zone) to 16–18% (lower zone) while the sand content rises from 22–25% to 27–31% at the equivalent levels.
Sedimentary interpretation
The grain-size distribution of the section at Petrovaradin shows a general similarity with typical primary loess in Vojvodina, as analyzed at nearby Ruma (Vandenberghe et al., Reference Vandenberghe, Marković, Jovanović and Hambach2014). The main constituent is the silt fraction that largely exceeds the clay and sand fractions while the U-ratio of unweathered loess at Ruma is nearly identical to the upper 1.40 m of the Petrovaradin section (ca. 1.70). The main differences between the sediments at Petrovaradin and primary loess—as described from Ruma—are the constantly and substantially higher sand content at Petrovaradin (always >9%, vs. 5–8% in loess), the slightly—although significantly—lower clay content (always <20%, vs. >21% in loess), poorer sorting, and a modal size that is generally slightly coarser than in most primary loess (44–55 μm vs. 26–44 μm in loess; Fig. 4). These differences are most pronounced for the lowermost part of the section (1.40–1.95 m) in comparison with the typical primary loess. The sedimentary differences are even more expressed when considering the local appearance of oblique lamination and especially the presence of dispersed gravel and gravel strings in the section deposit.

Figure 4. Example of grain size density distribution curves for the main stratigraphic units of the Petrovaradin Fortress section. Note the admixture of clay (brown field) and sand (green field) to a typical silt-dominated loess. (For interpretation of the references to color in this figure legend, the reader is referred to the web version of this article.)
Thus, the macroscopic sedimentary structure and the grain-size analysis provide a dual interpretation of the Petrovaradin deposits. The general resemblance to aeolian loess points to an original loess deposit, but the clear deviations prove that the original loess sediment was reworked by secondary processes (Fig. 3). The reworked character is most clearly expressed in the lower part of the section, while the upper part has better retained the original loess properties. The higher sand content accompanied by the presence of pebbles and the occasional bedding indicates transport by running water. Such characteristics are typical for floodplain or local slope wash deposits (Vandenberghe et al, Reference Vandenberghe, De Moor and Spanjaard2012, Reference Vandenberghe, Kasse, Popov, Markovic, Vandenberghe, Bohncke and Gabris2018; Vandenberghe, Reference Vandenberghe2013). In the former case, the Petrovaradin sediments may be considered as deposited directly by the Danube on top of a terrace, in the latter case they could have been derived at a more local scale from higher terraces or slopes by surface runoff. The morphological position of the site at the top of a hill opposes slope wash processes. Moreover, the grain-size characteristics (e.g., clay and sand content) are similar to those of the overbank deposits of the tributary Tisa River (Vandenberghe et al., Reference Vandenberghe, Kasse, Popov, Markovic, Vandenberghe, Bohncke and Gabris2018). It is interpreted that the sediments in the section originated from the erosion of loessic bluffs along the course of the Danube river. The admixture with clay is typical for settlement in the standing water of pools that were formed after inundation of a floodplain. During interruption of the alluvial sedimentation process, i.e., during periods of morphological stability,(embryonic) soils developed,.
A soil is absent below the alluvial deposits, suggesting that a large time gap between the terrace formation and the overlying deposits is improbable.
Rock magnetic and geochemical results
Measurements of the low field MS have played a central role in both chronostratigraphic and palaeoclimatic aspects of loess research because climate changes are encoded into the stratigraphic variations in magnetic properties (e.g. Heller and Evans, Reference Heller and Evans1995; Evans and Heller, Reference Evans and Heller2001). Enhancement of the magnetic signal usually represents a pedogenic overprint (Schaetzl et al., Reference Schaetzl, Bettis, Crouvi, Fitzsimmons, Grimley, Hambach and Roberts2018, and references therein). At the Petrovaradin site, the low field MS shows relatively low values typical for loess and weakly developed interstadial paleosols similar to the other sections in Vojvodina region (Marković et al., Reference Marković, Bokhorst, Vandenberghe, Oches, Zöller, McCoy, Gaudenyi, Jovanović, Hambach and Machalett2008, Reference Marković, Hambach, Catto, Jovanović, Buggle, Machalett, Zöller, Glaser and Frechen2009, Reference Marković, Stevens, Kukla, Hambach, Fitzsimmons, Gibbard and Buggle2015). Little variation is observed, with values ranging between 15 × 10−8m3/kg (SI) and 32 × 10−8SI, with an average of 24.6 × 10⁻⁸SI, indicating a slightly stronger pedogenetic imprint in the upper part of the analyzed profile (Fig. 5).

Figure 5. (color online) Lithostratigraphy, grain size, magnetic and geochemical proxies of Petrovaradin Fortress section.
Figure 5 shows the relationship between lithostratigraphy, U ratio, clay content, low-frequency MS, and variations of different geochemical parameters such as CIA, CPA, Ba/Sr, Rb/Sr, SiO2, TiO2, and Fe2O3. The SiO2values vary between 49% and 57% (average 52%) and are still dominant in all samples. Fe2O3 reaches very small values ranging between 0.024% and 0.030% (average 0.027%). The TiO2 content varies from 0.88% to 1.01% (average 0.94%). Ba/Sr and Rb/Sr ratios show variations between 1.3 to 2.4, and 0.35 to 0.65, respectively. CIA and CPA ratios fluctuate between 65 and 68, as well as 86–88.5, respectively. Thus, the MS and all geochemical indices illustrate a steady, gradual decrease of weathering and leaching processes with increased depth in the investigated sequence. These indications of slightly stronger weathering and leaching in the upper part of the investigated profile were most likely caused by local pedogenesis and post-depositional hydromorphic processes.
Luminescence dating results
Preheat plateau dose recovery results for the studied samples reveal highly variable luminescence behavior between samples. While generally fast-component dominated, dose recovery ratios for different preheat combinations in the fine-grained quartz vary substantially for samples, with most showing no plateau in recovered dose and with most preheat combinations yielding dose recovery ratios >10% away from unity. No clear trend with stratigraphy could be discerned with regard to this behavior in the samples, and the applied preheat combinations for De determination (Table 1) were chosen based on the best performing preheat combination on an individual basis (from dose recovery ratio, recycling ratio and recuperation). In all cases, recovered doses were within 10% of unity for at least one preheat combination. Where no test was performed (samples SB02 and SB05), a preheat combination of 240°C and 220°C was chosen. A large number of aliquots were rejected in these tests, with some aliquots showing clear trends in test dose response through the applied SAR protocol. This potentially indicates some uncorrected sensitivity change occurring in some aliquots and may account for the variable behavior of the samples (Table 1). Results from De determinations are presented in Table 1, alongside dosimetry, water content, ages, and chosen preheats. De values to some extent increase with depth but show numerous inversions and relatively large uncertainty. The large errors are a function of very variable inter-aliquot behavior, and in some cases, a very high proportion of aliquots were rejected from De determination (Table 1). The rejected aliquots mostly show poor recycling or low signal-to-noise ratios. Low signal-to-noise ratios are also evident in Danube sediments further upstream in Hungary (Tóth et al., Reference Tóth, Sipos, Kiss and Bartyik2017). Dose rates in most samples were relatively constant, although the topmost sample (SB08) showed a greater than average overall dose rate, largely due to elevated levels of K compared to other samples. Otherwise, dose rates appear typical for fine- grain quartz loess samples (Table 1). The resultant ages indicate a decrease in age as one moves towards the top of the stratigraphy, with two exceptions. Firstly, sample SB04 shows slightly greater age (42.8 ± 4.2 ka) than the underlying sample SB03 (39.8 ± 3.8 ka), taken from 104 cm and 139 cm depth respectively. However, these ages overlap within errors, and sample SB04 in particular yielded a large number of rejected aliquots due to poor recycling. Secondly, sample SB01 lies at the base of the section (195 cm) yet yields an age (29.3 ± 3.1 ka) that is significantly younger than the three immediately overlying samples (Table 1). Rather, the age of SB01 overlaps with samples SB05 and SB06 at 88 cm and 72 cm depth in the section, respectively. Sample SB01 also yielded quite large numbers of rejected aliquots (Table 1) and exhibited especially low signal-to-noise ratio. This may point to an inaccurate age in this sample, rather than for the overlying samples, although another possibility is that most of the section was deposited at ca. 25–30 ka and the inaccurate ages are those from SB02 to SB04. At present, from the luminescence dating alone, there is no way to test these two possibilities. However, given the poor luminescence behavior in SB01 and the otherwise generally consistent age increases with the depth in the remainder of the samples, the most likely scenario is that SB01 is substantially underestimated in age. This is supported by evidence for reworking at the base of the section where sample SB01 was taken from (evidenced by dispersed gravel and gravel strings), which may lead to the incorporation of locally derived quartz with contrasting luminescence properties to the remainder of the section. In addition, concentrations of U, Th, and K as measured in luminescence dose rate analyses yield larger uncertainties than the other samples, also suggesting different sediment sources. Under this scenario, the luminescence dating points to the material uncovered in the section being deposited during the last glacial period, with the majority of material deposited during MIS 2 and MIS 3, although with UNIT V potentially being MIS 5 in age.
Generally, fine-grain quartz OSL dating of Hungarian loess sediments (likely Danube derived) is problematic due to low signal-to-noise ratios (Schatz et al., Reference Schatz, Buylaert, Murray, Stevens and Scholten2012), as shown also in the Danube sediments from Hungary studied by Tóth et al. (Reference Tóth, Sipos, Kiss and Bartyik2017). However, quartz OSL dating of loess from Serbia tends to show quartz with very strong fast components and high signal-to-noise ratios (e.g., Stevens et al., Reference Stevens, Marković, Zech, Hambach and Sümegi2011). Furthermore, the mean residual dose of modern Hungarian Danube sediments in Tóth et al. (Reference Tóth, Sipos, Kiss and Bartyik2017) is ca. 2.3 Gy, which is well within error limits of the ages here and equates to an overestimate of less than 700 years. The low signal-to-noise ratio shown in the Hungarian Danube sediments may be an additional factor in explaining the variability in luminescence ages in this section.
DISCUSSION
Terrace age and stratigraphy of the terrace staircase
Terraces may be formed by stepwise tectonic uplift of the catchment area or by climatic (glacial-interglacial) cyclicity. As there is no positive indication for a stepwise tectonic uplift at Petrovaradin, a climatic forcing is assumed. However, the alternation of cold and warm cycles on its own is not able to explain the alternation of stability (with terrace formation) and instability (river incision). To produce the commonly found staircase morphology of the terraces, sufficient accommodation space (or a relatively lowered baselevel) is needed to enable incision. This has to be created by continuous tectonic uplift.
In this region, terraces are commonly formed at the end of cold periods, after the river finishes gravel-bed deposition and starts renewed incision (Vandenberghe, Reference Vandenberghe2015 and references therein). Floodplain deposition on top of the terrace occurred at a time that the Danube main channel had left its former position at the terrace and had started incision. This typically would have started at the climatic cold-to-warm transition (MIS 4 to MIS 3) (Antoine, Reference Antoine1994; Vandenberghe, Reference Vandenberghe1995, Reference Vandenberghe2015; Bridgland, Reference Bridgland2000; Antoine et al. Reference Antoine, Limondin-Lozouet, Chaussé, Lautridou, Pastre, Auguste, Bahain, Falguères and Galehb2007; and references therein). In most cases, the lowest step in a Pleistocene terrace staircase dates from the last cold period (MIS2), which would imply that the terrace at 90–100 masl around Petrovaradin/Novi Sad was formed between 29–14 ka. The derived incision rate of the Danube would therefore be ca. 0.75 mm/yr (15 m in 20,000 years). On the basis of the OSL-dating results, we conclude that the terrace on which the Petrovaradin Fortress has been constructed should have been abandoned at least before 43 ka and prior to the Weichselian Middle Pleniglacial (corresponding with MIS3). We, therefore, assume that the terrace was formed during the Early Pleniglacial (MIS4). If the former interpretation is correct (fortress terrace dating from MIS 4), then the Danube floodplain should have been raised ca. 4.5 m since the formation of the Petrovaradin terrace (present-day floodplain at ca. 79 m, floodplain at Petrovaradin at ca. 123.5 m). This means that the Danube incised ca. 44.5 m in approximately 61,000 years; an average rate of ca. 0.73 mm/yr (=almost identical to the incision rate of 0.76 mm/yr during the latest 21,000 years) (Table 2). Assuming an age within an cold period earlier than MIS 4 for the Petrovaradin terrace, for instance in the Early Weichselian (MIS 5b or MIS 5d), would suppose a relatively long time interval between its formation (ca. 111 ka) and the formation of the lowermost terrace level at 90–100 m (ca. 21 ka), despite the relatively short distance (23–28 m) between them. Presuming this older age of the Petrovaradin terrace (ca. 111 ka) would imply an incision rate between the terraces at ca. 123.5 m asl and 95 m asl of only 28.5 m over ~90,000 years or ca. 0.32 mm/y, which would be considerably lower than the incision rate during the latest 21,000 years, i.e., since the formation of the lowermost 90–100 m terrace in MIS 2 (0.75 mm/yr). As such, and given the luminescence dating results and uncertainty over the reliability of the lowermost luminescence age, we therefore favor the first option (MIS 4 formation).
Table 2. The youngest three terraces of Danube River developed in Fruška Gora Mountain, their elevation above sea level, relative elevation to present day Danube, estimated age and method of estimation, and incision rate of Danube River.

Tectonic uplift and terrace dissection
Supposing that this river incision was in full equilibrium to the land uplift (e.g., Maddy, Reference Maddy1997; Westaway and Bridgland, Reference Westaway and Bridgland2007), the Fruška Gora Mountain should have been uplifted at the same rate. Therefore, it is useful to compare this uplift rate (Table 2) with comparable data from other mountain ranges around the Carpathian Basin and from the Mediterranean region.
The Fruška Gora Mountain is situated in the southern part of the Carpathian basin near the junction between the Carpathians and the Dinaric Alps, in the contact zone between European and Adriatic-derived tectonic units. As a result, it has undergone a complex tectonic history since the Jurassic period (Toljić et al., Reference Toljić, Matenco, Ducea, Stojadinović, Milivojević and Đerić2013). At the northern side of the Carpathian Basin, the axial zone of the Hungarian Mountain range (Danube Bend) shows an incision rate of 0.41 mm/yr over the last 360 ka, based on U/Th dating and geomorphic data (Ruszikczay-Rüdiger et al., Reference Ruszkiczay-Rüdiger, Dunai, Bada, Fodor and Horvath2005b). The use of in situ produced 3He provided a Middle to Late Pleistocene Danube incision and uplift rate of 1.6 mm/yr (Ruszikczay-Rüdiger et al., Reference Ruszkiczay-Rüdiger, Fodor, Bada, Leél-Össy, Horvath and Dunai2005a). These authors mention a present-day uplift estimate of >1 mm/yr based on geodetic leveling (Ruszikczay-Rüdiger et al., Reference Ruszkiczay-Rüdiger, Balázs, Csillag, Drijkoningen and László Fodor2020). Recently, the same authors provided more detailed uplift rates for the Pleistocene period in the western Carpathian basin. Based on Danube incision they found a considerable increase of uplift from ~0–0.50 mm/y from ~3 Ma to ~140 ka, and uplift rates of ~0.2 mm/yr since ~140 ka. Although the latter rate of uplift is clearly less than our calculated uplift rate of ~0.73 mm/yr for the past 60 ka, their comparison with other Carpathian settings shows values up to 2.2 mm/yr in that approximate time range (e.g., in the east Carpathians [Necea et al, Reference Necea, Fielitz, Kadereit, Andriessen and Dinu2013]), confirming a remarkable, widely distributed increase of uplift rates in the last 60 ka (figure 9 and references in Ruszikczay-Rüdiger et al., Reference Ruszkiczay-Rüdiger, Balázs, Csillag, Drijkoningen and László Fodor2020). In addition, the latter authors provide an extensive overview of European uplift rates which illustrate mountain uplift and river incision rates that are quite comparable to the value we calculated at Petrovaradin for the past 60 ka (Ruszikczay-Rüdiger et al., Reference Ruszkiczay-Rüdiger, Balázs, Csillag, Drijkoningen and László Fodor2020).
Paleoenvironmental interpretations
The approximately 1.95 m thick sedimentary sequence provides the possibility to reconstruct last glacial environmental dynamics as a crucial background for long-term human occupationaround Petrovaradin Fortress. Additional environmental interpretations have been incorporated from the adjacent loess sections at Petrovaradin brickyard (Marković et al., Reference Marković, McCoy, Oches, Savić, Gaudenyi, Jovanović, Stevens, Walther, Ivanišević and Galić2005) and Mišeluk (Marković et al., Reference Marković, Oches, Jovanović, Gaudenyi, Hambach, Zöller and Sümegi2004a).
According to the sedimentary, magnetic, geochemical, and palaeopedologicalevidence from the investigated profile, the last glacial interval displays a relatively small amplitude of environmental changes compared to other central European sites (Thiel et al., Reference Thiel, Buylaert, Murray, Terhorst, Hofer, Tsukamoto, Frechen and Frechen2010; Antoine et al. Reference Antoine, Rousseau, Degai, Moine, Lagroix, Kreutzer, Fuchs, Hatté, Gauthier, Svoboda and Lisá2013; Marković et al., Reference Marković, Stevens, Kukla, Hambach, Fitzsimmons, Gibbard and Buggle2015; Terhorst et al., Reference Terhorst, Sedov, Sprafke, Peticzka, Meyer-Heintze, Kühn and SolleiroRebolledo2014). These interpretations are also in a good agreement with sedimentary and magnetic results, as well as identified land snail fauna from the surrounding Petrovaradin brickyard and Mišeluk loess sections (see Fig. 1B; Marković et al., Reference Marković, Oches, Jovanović, Gaudenyi, Hambach, Zöller and Sümegi2004a, Reference Marković, McCoy, Oches, Savić, Gaudenyi, Jovanović, Stevens, Walther, Ivanišević and Galić2005, Reference Marković, Bokhorst, Vandenberghe, Oches, Zöller, McCoy, Gaudenyi, Jovanović, Hambach and Machalett2008, Reference Marković, Sümegi, Stevens, Schaetzl, Obreht, Chu and Buggle2018). The described fossil land snail assemblages indicate more humid environmental conditions in the investigated area than in other parts of the southeastern Carpathian Basin during the last glacial period (Marković et al., Reference Marković, Oches, Sümegi, Jovanović and Gaudenyi2006, Reference Marković, Oches, McCoy, Gaudenyi and Frechen2007, Reference Marković, Bokhorst, Vandenberghe, Oches, Zöller, McCoy, Gaudenyi, Jovanović, Hambach and Machalett2008, Reference Marković, Sümegi, Stevens, Schaetzl, Obreht, Chu and Buggle2018; Sümegi et al., Reference Sümegi, Marković, Molnár, Sávai, Náfrádi, Szelepcsénzi and Novák2016; Gavrilović et al., Reference Gavrilović, Sümegi, Ćirić, Radaković, Gavrilov, Mladjen and Marković2020). As a result, the northern slope of the Fruška Gora Mountain was a biogeographical “island” during the last glacial and presented a refugium where some elements of the forest vegetation managed to survive (Marković et al., Reference Marković, Oches, Jovanović, Gaudenyi, Hambach, Zöller and Sümegi2004a, Reference Marković, McCoy, Oches, Savić, Gaudenyi, Jovanović, Stevens, Walther, Ivanišević and Galić2005). However, the Early Pleniglacial snail assemblages indicate mostly dry and relatively warm climatic conditions with a dominance of grassland vegetation. Woolly mammoth (Mammuthus primigenius) skeletal fragments at the base of the Lower Pleniglacial loess layer L1LL2 at the Petrovaradinbrickyard site (Milić, Reference Milić1978; Marković et al., Reference Marković, McCoy, Oches, Savić, Gaudenyi, Jovanović, Stevens, Walther, Ivanišević and Galić2005) add to the paleoecological interpretation of a local environment in the investigated area. The Middle Pleniglacial pedocomplex L1SS1 is weakly exposed at the Petrovaradin brickyard and MIšeluk sites representing temperate warm and relatively dry climate. Data from the youngest Late Pleniglacial loess layer L1LL1 indicates the coldest and most humid conditions during the last glacial period (Marković et al., Reference Marković, Oches, Jovanović, Gaudenyi, Hambach, Zöller and Sümegi2004a, Reference Marković, McCoy, Oches, Savić, Gaudenyi, Jovanović, Stevens, Walther, Ivanišević and Galić2005). These findings highlight the southeastern Carpathian Basin as a region of stable paleoclimate for much of the last glacial, at leastmore so than other European loess regions (Marković et al., Reference Marković, Oches, Jovanović, Gaudenyi, Hambach, Zöller and Sümegi2004a, Reference Marković, Mihailović, Oches, Jovanović and Gaudenyi2004b, Reference Marković, McCoy, Oches, Savić, Gaudenyi, Jovanović, Stevens, Walther, Ivanišević and Galić2005, Reference Marković, Oches, Sümegi, Jovanović and Gaudenyi2006, Reference Marković, Oches, McCoy, Gaudenyi and Frechen2007, Reference Marković, Bokhorst, Vandenberghe, Oches, Zöller, McCoy, Gaudenyi, Jovanović, Hambach and Machalett2008, Reference Marković, Sümegi, Stevens, Schaetzl, Obreht, Chu and Buggle2018)
The archaeological context
The luminescence ages presented above do not come from the sector where regular excavations have been carried out, but from a nearby probe (Fig. 1C). Regardless, the correlation of the layers from these two nearby excavation areas is very clear (Figure 1C). UNIT I and UNIT II correspond to Layer 1, UNIT III and UNIT IV to Layer 2a, and UNIT V to Layer 2b (Figs. 3 and 6). Within the excavated areas, the zone of contact between Layers 2a and 2b was defined as Layer 2a/2b, which shows disturbed sediment with crotovina and a level with rock fragments at its base. The artifacts were discovered in the lower part of Layer 2a and in Layers 2a/2b and 2b (Mihailović, Reference Mihailović2009).

Figure 6. (color online) Stratigraphy, pedostratigraphy and environmental interpretation for Mišeluk (Marković et al., Reference Marković, Oches, Jovanović, Gaudenyi, Hambach, Zöller and Sümegi2004a) and Petrovaradin brickyard (Marković et al., Reference Marković, McCoy, Oches, Savić, Gaudenyi, Jovanović, Stevens, Walther, Ivanišević and Galić2005) loess sites compared with pedostratigraphy and luminescence ages for Petrovaradin Fortress section. Legend: 1 – loess; 2 – embryonic soil; 3 – A horizon; 4 – Ah horizon; 5 – Transitional AB horizon; 6 – crotovinas; 7 – carbonate concretions; 8 – fossil root channels.
Palaeolithic materials from the PetrovaradinFortress have been previously described in detail (Mihailović, Reference Mihailović2009). Preferential and retouched flakes, as well as a single massive bifacial sidescraper, were among the few artifacts recovered from Layer 2b. A sidescraper of the same type was also found in Layer 2a, along with numerous cores and artifacts produced using quartz and the locally available chert. Both layers contained centripetal and Levallois cores, a variety of sidescrapers (including transverse ones), denticulated and notched pieces, and other types of tools.
The lithic industry from Petrovaradin Fortress has been linked to the Charentian of Southeastern Europe (Krapina, Érd) and to the Taubachian (due to its microlithic component), which is known from the north of the Carpathian Basin (Gábori-Csánk, Reference Gábori-Csánk1968; Gábori, Reference Gábori1976; Valoch, Reference Valoch1984; Simek and Smith, Reference Simek and Smith1997; Borel et al., Reference Borel, Dobosi and Moncel2017; Banda and Karavanić, Reference Banda and Karavanić2019). Furthermore, it has been pointed out that the bifacial artifacts from Petrovaradin are very reminiscent of the tools characteristic of the early Micoquian of the Carpathian Basin (Mihailović, Reference Mihailović2009). The appearance of bifacial tools came as a surprise, since this particular tool type was previously found only in the north of the Carpathian Basin, unlike the Charentian of Southeastern Europe, which was confirmed at sites in the vicinity. The vast majority of Charentian and Taubachian industries in the Carpathian Basin are dated or assigned to MIS 5: Krapina to the period before 130 ka (Rink et al., Reference Rink, Schwarcz, Smith and Radovčić1995), the Tata site to the period before 116–70 ka (Schwarcz and Skoflek, Reference Schwarcz and Skoflek1982), and Érd to the end of the interglacial and the onset of the early glacial based on the biostratigraphic and radiometric data (Mester and Moncel, Reference Mester and Moncel2006).
Recent research at Petrovaradin Fortress has provided new insights into the chronology and geographical distribution of different types of industries in the Middle Palaeolithic of the southern part of the Carpathian Basin. The results of the sedimentological analyzes of UNIT V do not fully exclude the possibility that the finds from Layer 2b were redeposited from a higher position via slope processes. Therefore, it is possible that the OSLage obtained for UNIT V (95–77 ka) does not reflect the real but the minimum age of the artifacts found in the layer. The age of this layer (in which a bifaciallyflaked sidescraper was found) generally corresponds to the chronology of the earliest Central European industries with bifacial backed tools (Kozlowski, Reference Kozłowski2016).
The age and context of the finds from the upper layers, which have been attributed to the Charentian of Southeastern Europe, can be interpreted in two ways. If the context of the finds from Layers 2a and 2a/2b (i.e.,UNIT III and UNITIV), dated from 47 ka to 36 ka, is correct, the artifact assemblages from those layers could be characterized as the latest recorded Central European evidence for the Charentian of Southeastern Europe. Given the presence of crotovinas, however, there is a possibility that the lithic material actually originated from an already reworked lower layer (2b). Only future research will be able to provide a definitive answer to this question.
Regardless of the chronological and stratigraphic concerns, the presence of a Charentian component and bifacial tools in the lowermost strata of Petrovaradin Fortress shows that the technological phenomena that characterized the Middle Palaeolithic in the north and west of the Carpathian Basin were also widespread in the southern part of the basin.This certainly testifies to the significant degree of social and cultural integration of the Neanderthal communities in the Middle Palaeolithic of the Carpathian Basin.
CONCLUSIONS
This study presents the first multidisciplinary investigation of the last glacial sedimentary sequence at the Petrovaradin Fortress, in Vojvodina, Serbia. It comprises a rich Middle Paleolithic assemblage. The combination of geochemical, magnetic, and grain-size analyses and geomorphological observations provide a general environmental framework in the context of human occupation. The Paleolithic artifacts are embedded in a reworked last glacial loessic-paleosol sequence on the second (120–125 m) terrace, which presumably was formed during the Early Pleniglacial (MIS 4). This enables us to derive an uplift rate of ca. 0.73 mm/yr for the last 60 ka. Although affected in part by reworking processes, the luminescence dating results provide a reasonable chronology of the sedimentary succession during the last glacial period.
During the Middle Paleolithic occupation, the slope between the Petrovaradin rock and the Danube River was gentler than the current steep cliff. Additionally, the Danube River was also located further to the north in comparison to its modern location. However, it was still a highly strategic position for a Paleolithic site surrounded by high environmental diversity associated with existing paleorelief conditions. The relative environmental stability identified in the investigated area during the last glacial period is likely also a key factor in human occupation.
ACKNOWLEDGMENTS
The authors are very grateful to Claire Tye (Gallant), Radovan Bunardžić and MihajloLesjak for help during the fieldwork, and to Vladica Cvetković for stimulating discussion. Slobodan Marković, Milivoj Gavrilov and Milica Radaković were supported by grant # 176020, financed by the Serbian Ministry of Education, Science and Technological Development and the First Program of the Chinese-Serbian Developing Projects (Project title: “A Comparative Study of Past Climate Change in the East Asian Monsoon Region and the Westerly Zone using Multiple Timescales”). Christian Zeeden, Igor Obreht, Janina Nett and Frank Lehmkuhl acknowledge funding by the CRC 806 “Our Way to Europe”, subproject B1 – “The Eastern Trajectory: Last Glacial Palaeogeography and Archaeology of the Eastern Mediterranean and of the Balkan Peninsula” – by the Deutsche Forschungsgemeinschaft (DFG, German Research Foundation) – Projektnummer 57444011 – SFB 806. Thomas Stevens gratefully acknowledges the support of the Swedish Research Council (2017-03888). The work of Dušan Mihailović was supported by Ministry of Culture and Information, and the Ministry of Education, Science and Technological Development of the Republic of Serbia (project # 177023).
SUPPLEMENTARY MATERIAL
The supplementary material for this article can be found at https://doi.org/10.1017/qua.2020.88


 Open access