


Pedestrian archaeological survey is commonly performed in the western United States to inventory land for cultural resources in compliance with preservation law. A primary objective of many survey methods used in cultural resource management (CRM) is to identify archaeological sites and delineate their boundaries. Identified sites are either left alone and avoided or evaluated to determine which, if any, are important enough to be preserved, managed, and considered for adverse effects.
In CRM, sites are identified according to arbitrary threshold criteria, such as a critical number and diversity of artifacts within a specified area. Once identified, sites are then defined as bounded entities and organized into types considered relevant to their interpretation and management. How site criteria are applied to define and measure site boundaries can vary considerably between projects, among crewmembers on the same project, between sampling methods, or according to local conditions. In many cases, a discrete boundary is difficult to define.
Over the last half century, numerous researchers have questioned the validity and utility of the site concept (Dunnell Reference Dunnell, Rossignol and Wandsnider1992; Dunnell and Dancey Reference Dunnell and Dancey1983; McCoy Reference McCoy2020; Patrik Reference Patrik1985; Schiffer Reference Schiffer1972; Thomas Reference Thomas and Mueller1975). They argue that reliance on sites as the primary unit of observation and analysis frustrates investigation and management of archaeological landscapes. Rossignol (Reference Rossignol, Rossignol and Wandsnider1992:9), for example, has noted that dependency on the site concept has led to
(a) the neglect of dispersed “off-site” materials for investigating land use at the regional scale, (b) inexact or vague definitions at the observational level, making data collection and statistical analysis difficult, and (c) a tendency to treat sites as monolithic entities, underestimating the complexity of occupation-component interaction.
Clustering in the distribution of artifacts and features across the landscape varies according to spatial extents, the size of the smallest observation unit, and variables of interest (Dunnell Reference Dunnell, Rossignol and Wandsnider1992; Ebert Reference Ebert1992). When sites are removed from consideration, archaeological distributions of artifacts and features are more continuous than discontinuous, as the site concept would imply. In place of sites, some archaeologists argue that distributions or gradients of artifacts and features more accurately reflect spatial and temporal variation in archaeological landscapes than do constellations of sites. Other approaches seek a middle ground by applying concepts such as “on-site” or “off-site” to record and interpret the archaeological record (Bintliff and Snodgrass Reference Bintliff and Snodgrass1988; Cherry et al. Reference Cherry, Davis and Mantzouranē1991; Foley Reference Foley, Hodder, Isaac and Hammond1981).
The transect-recording unit (TRU) survey system was designed to overcome some of the challenges discussed above (e.g., Heilen and Murrell Reference Heilen and Murrell2015; Lukowski and Stuart Reference Lukowski and Stuart1996; Miller et al. Reference Miller, Kenmotsu and Landreth2009; O'Leary et al. Reference O'Leary, Kludt, Church and Mauldin1997; Seaman et al. Reference Seaman, Doleman, Chapman, Seaman, Doleman and Chapman1988). This article provides an overview of the TRU survey approach and then explores factors that can affect its implementation. The research and management potential of the system is illustrated through the use of TRU data for identifying and tracing precontact foot trails in New Mexico's Tularosa Basin. Precontact trails in this area are typically not visible on the ground during pedestrian survey but are identifiable in a GIS (geographic information system) using landscape-scale TRU survey data. Finally, we discuss some advantages and disadvantages of the TRU system in terms of its reliability, comparability, and utility for archaeological research and landscape-scale management.
TRADITIONAL APPROACHES TO PEDESTRIAN ARCHAEOLOGICAL SURVEY
Pedestrian archaeological survey is routinely conducted in the United States and other countries to inventory land for cultural resources. Under Section 106 of the National Historic Preservation Act (NHPA) of 1966, as amended, federal agencies in the United States are required to inventory project areas for cultural resources and evaluate their eligibility to be listed on the National Register of Historic Places (NRHP; Hardesty and Little Reference Hardesty and Little2000; Little et al. Reference Little, Seibert, Townsend, Sprinkle and Knoerl2000; Shrimpton Reference Shrimpton and Andrus2002). Through consultation with stakeholders, including Native American tribes, agencies then must consider how to treat eligible resources that may be adversely affected by a project (Ferguson Reference Ferguson, Sebastian and Lipe2009; Hutt and Lavallee Reference Hutt and Lavallee2005; King Reference King2003, Reference King2008). Less often, pedestrian survey is conducted in compliance with Section 110 of the NHPA or the National Environmental Policy Act (NEPA) of 1969. Section 110 requires that federal agencies develop information on the nature and distribution of cultural resources under their jurisdiction and assume responsibility for preserving them. NEPA requires the environmental impacts of federally funded projects, including impacts to cultural resources, to be analyzed and considered in deciding on project alternatives.
The NHPA and NEPA do not specifically require survey or specific kinds of survey. National Register Bulletin 24 (Derry et al. Reference Derry, Ward Jandl, Shull and Thorman1985) advises that survey methods and techniques can vary based on context and the characteristics of the survey area; it recommends that State Historic Preservation Offices (SHPOs) provide guidance on how to conduct survey. SHPOs typically develop survey standards for conducting inventory in their state that involve some form of intensive field survey (Wilshusen et al. Reference Wilshusen, Heilen, Catts, de Dufour and Jones2016). Contractors hired by agencies or developers then perform surveys following their interpretation of these standards and write a report detailing the nature of the undertaking, legal drivers, survey methods, and results. Site boundaries, project boundaries, and summaries of site and project-area attributes are often uploaded to state or other cumulative databases at the close of a project. Much of the remaining GIS data recorded during survey (e.g., artifact and feature locations) are represented only in project reports and/or stored on company servers, where they remain largely unavailable for reuse.
Archaeologists have created a substantial body of literature examining the effects of survey methodology, environment, and site characteristics on the discovery and interpretation of archaeological sites. Independently of what is actually surveyed, site discovery and interpretation can vary depending on factors such as survey-parcel size and shape; spacing interval; ground conditions; artifact size, shape, and color; visibility; obtrusiveness; and other factors (Banning Reference Banning2002; Banning et al. Reference Banning, Hawkins and Stewart2006, Reference Banning, Hawkins, Stewart, Hitchings and Edwards2017; Ebert Reference Ebert1992; Heilen et al. Reference Heilen, Nagle and Altschul2008; Holdaway and Fanning Reference Holdaway and Fanning2008; Judge Reference Judge, Hayes, Brugge and James Judge1981; Judge et al. Reference Judge, Ebert, Hitchcock and Mueller1975; Lucas Reference Lucas2001; Nance and Ball Reference Nance and Ball1986; Plog et al. Reference Plog, Plog, Wait and Schiffer1978; Schiffer and Wells Reference Schiffer, Wells, McGuire and Schiffer1982; Schiffer et al. Reference Schiffer, Sullivan and Klinger1978; Shennan Reference Shennan1985; Wandsnider and Camilli Reference Wandsnider and Camilli1992).
Intensive pedestrian survey is often accomplished in CRM in arid or semiarid areas of the western United States by having field crews walk evenly spaced, parallel transects across a survey area to search systematically for signs of cultural resources resting on or intruding into the ground surface. Transect spacing is usually predetermined by SHPO or other jurisdictional requirements. For example, the Arizona SHPO requires that a survey cover 100% of the area of potential effect (APE) and that transects be spaced no more than 20 m apart. Similar requirements are present in most other Western states where pedestrian survey is the primary method for archaeological inventory. Survey standards often require consideration of factors inhibiting the detection of surface archaeology, such as vegetative cover, ground disturbance, or components of the built environment (e.g., a paved parking lot), but exactly how to do this is rarely defined or systematically operationalized in practice.
When artifacts or features are identified during survey, field crew typically fan out to look for additional artifacts or features. If additional materials are located, crews will often further examine nearby areas to make additional observations on the content and extent of the site. In some jurisdictions, limited subsurface tests are used to gain insight into the integrity of the site and assess the potential for buried archaeological deposits. If artifacts and/or features identified during survey do not meet the threshold for defining a site, they may instead be recorded as isolated finds. Often, isolated finds are minimally recorded and afforded no further consideration. In some jurisdictions, specific types of isolated finds can be determined eligible and considered for adverse effects (see, e.g., Douglass et al. Reference Douglass, Wandsnider and Holdaway2023).
Although field crews may record the provenience of individual archaeological features or diagnostic artifacts during survey, observations on the content and condition of a site are often made at the level of the entire site—that is, the site as a whole is recorded to contain a number of artifacts and/or features of a series of classes and types. How those observations are documented spatially varies widely, however (e.g., as individual artifact or feature locations, as concentrations or loci, or with reference to the entire site). If artifact densities are low, most or all artifacts may be recorded with point proveniences representing individual artifacts or clusters of artifacts. However, if artifact and/or feature densities are high, or if there is limited time available for site recording, artifacts and features may be described for the entire site as a whole or tabulated for individual sample units or loci, and/or the location only of diagnostic artifacts or features is recorded.
Visibility, ground conditions, and site disturbances may also be noted or described. Oftentimes, information on visibility is recorded for the site as a whole or perhaps for particular land parcels or survey areas, if at all. Disturbances may be noted or described without providing explicit information on their location and extent. Less often, visibility and disturbance are recorded at isolated finds or for locations where no archaeology has been observed.
Common Challenges with Conventional Pedestrian Survey Approaches
There are several challenges that can result from conventional pedestrian survey approaches. One is that survey intensity can vary uncontrollably when a potential site is encountered. When survey crews fan out to record a site, they cover the ground surface with greater intensity than other survey areas where sites were not observed or expected. With greater survey intensity, there is greater potential to identify more artifacts and artifact types, including diagnostic artifacts and other rare or unusual artifact types. Survey intensity bias can therefore reinforce the impression that important and diverse cultural resources are located principally or exclusively within a site, in comparison to other areas that were searched at a lower survey intensity.
Second, site boundaries may be defined without explicit and transparent retention of the data used to define a site, rendering boundaries difficult to substantiate and reproduce. Should criteria or methods for defining a site change, previously defined site boundaries are not easily updated without resurvey. Moreover, differences among projects and jurisdictions in site definition criteria and their application make it difficult to compare sites across or between regions.
Third, the correspondence between archaeological observations, disturbance, and visibility is often obscure and left unexamined. It can be difficult to ascertain, for example, if the apparent absence of archaeological materials in a given location is the result of little or no deposition of archaeological materials or is instead due to the ground surface being obscured by vegetation or affected by erosion or deposition. One study comparing pedestrian survey methods found that average artifact densities and average fire-cracked-rock (FCR) densities increased with visibility and degree of erosion when those attributes were recorded systematically following the TRU method (Heilen and Murrell Reference Heilen and Murrell2015; see also Heilen Reference Heilen2018).
Fourth, the distribution of artifact classes or feature types—such as flaked stone debris, tools, ceramics, and important feature types—is not easily examined within a site or across a landscape with data derived from conventional survey approaches. For example, an archaeological site might be defined based on the presence of multiple classes of artifacts observed at a high density. A common interpretation is that the concentration represents a discrete locale of intensive occupation, due to the abundance and diversity of materials. However, careful examination of the distribution of individual artifact and feature types can identify hidden patterns that compel different interpretations of land use, mobility, and interrelationships among resources than could be arrived at using conventional survey data.
Fifth, conventional methods of survey and site definition can confound landscape-scale research and management approaches. There is a growing interest in landscape-scale resource management (Doelle et al. Reference Doelle, Barker, Cushman, Heilen, Herhahn and Rieth2016; Wilshusen et al. Reference Wilshusen, Heilen, Catts, de Dufour and Jones2016) as well as in archaeological synthesis (Altschul Reference Altschul2016; Altschul et al. Reference Altschul, Kintigh, Klein, Doelle, Hays-Gilpin, Herr and Kohler2017). In 2014, the U.S. Department of Interior issued in A Strategy for Improving the Mitigation Policies and Practices of the Department of the Interior (Clement et al. Reference Clement, Belin, Bean, Boling and Lyons2014). In mitigating impacts to both cultural and natural resources, the report notes that “the landscape approach dictates that it is not sufficient to look narrowly at impacts at the scale of the project; it is necessary to account for impacts to resource values throughout the relevant range of the resource that is being impacted” (Clement et al. Reference Clement, Belin, Bean, Boling and Lyons2014:i). The report further emphasizes the need to make use of the best available science to establish “the conditions, trends, and baselines that characterize” landscape-scale attributes (Clement et al. Reference Clement, Belin, Bean, Boling and Lyons2014:13). To better accommodate landscape-scale approaches, archaeologists need to understand relationships among cultural resources and their environment rather than focus effort on the interpretation and management of individual sites (see e.g., Colwell and Ferguson Reference Colwell and Ferguson2014:248; Heilen et al. Reference Heilen, Altschul and Lüth2018; Ortman and Altschul Reference Ortman and Jeffrey2023; Whittlesey Reference Whittlsey2003). When survey data are collected, managed, and represented at the appropriate scales, archaeologists are better positioned to identify landscape-scale attributes and interrelationships among resources.
TRANSECT-RECORDING UNIT SURVEY: AN ALTERNATIVE APPROACH
For more than 30 years, archaeologists and cultural resource managers in southern New Mexico have inventoried and recorded cultural resources using the TRU method. The TRU method was designed to strike a balance between conventional site-based methods for archaeological inventory and site-less survey approaches, which emphasize the recordation of finer-grained locational data, often by systematically point locating individual artifacts or features across a project area or by recording archaeology by grid square (e.g., Lukowski and Stuart Reference Lukowski and Stuart1996; Miller et al. Reference Miller, Kenmotsu and Landreth2009; O'Leary et al. Reference O'Leary, Kludt, Church and Mauldin1997).
The TRU Method
The TRU method was originally developed in the late 1980s and early 1990s by archaeologists conducting cultural resource management survey on the US Army's White Sands Missile Range and Fort Bliss installations (Figure 1) in the Tularosa Basin of southern New Mexico and the Hueco Bolsón of West Texas (e.g., Anschuetz et al. Reference Anschuetz, Doleman and Chapman1990; Lukowski and Stuart Reference Lukowski and Stuart1996; Miller et al. Reference Miller, Kenmotsu and Landreth2009; O'Leary et al. Reference O'Leary, Kludt, Church and Mauldin1997; Seaman et al. Reference Seaman, Doleman, Chapman, Seaman, Doleman and Chapman1988). The TRU system entails the recording of all areas within an APE using a systematic grid of uniformly sized cells, or TRUs, as the fundamental unit of spatial observation and recording. Surveyors conduct survey in terms of these units, completely recording within each TRU all surface-exposed cultural material.
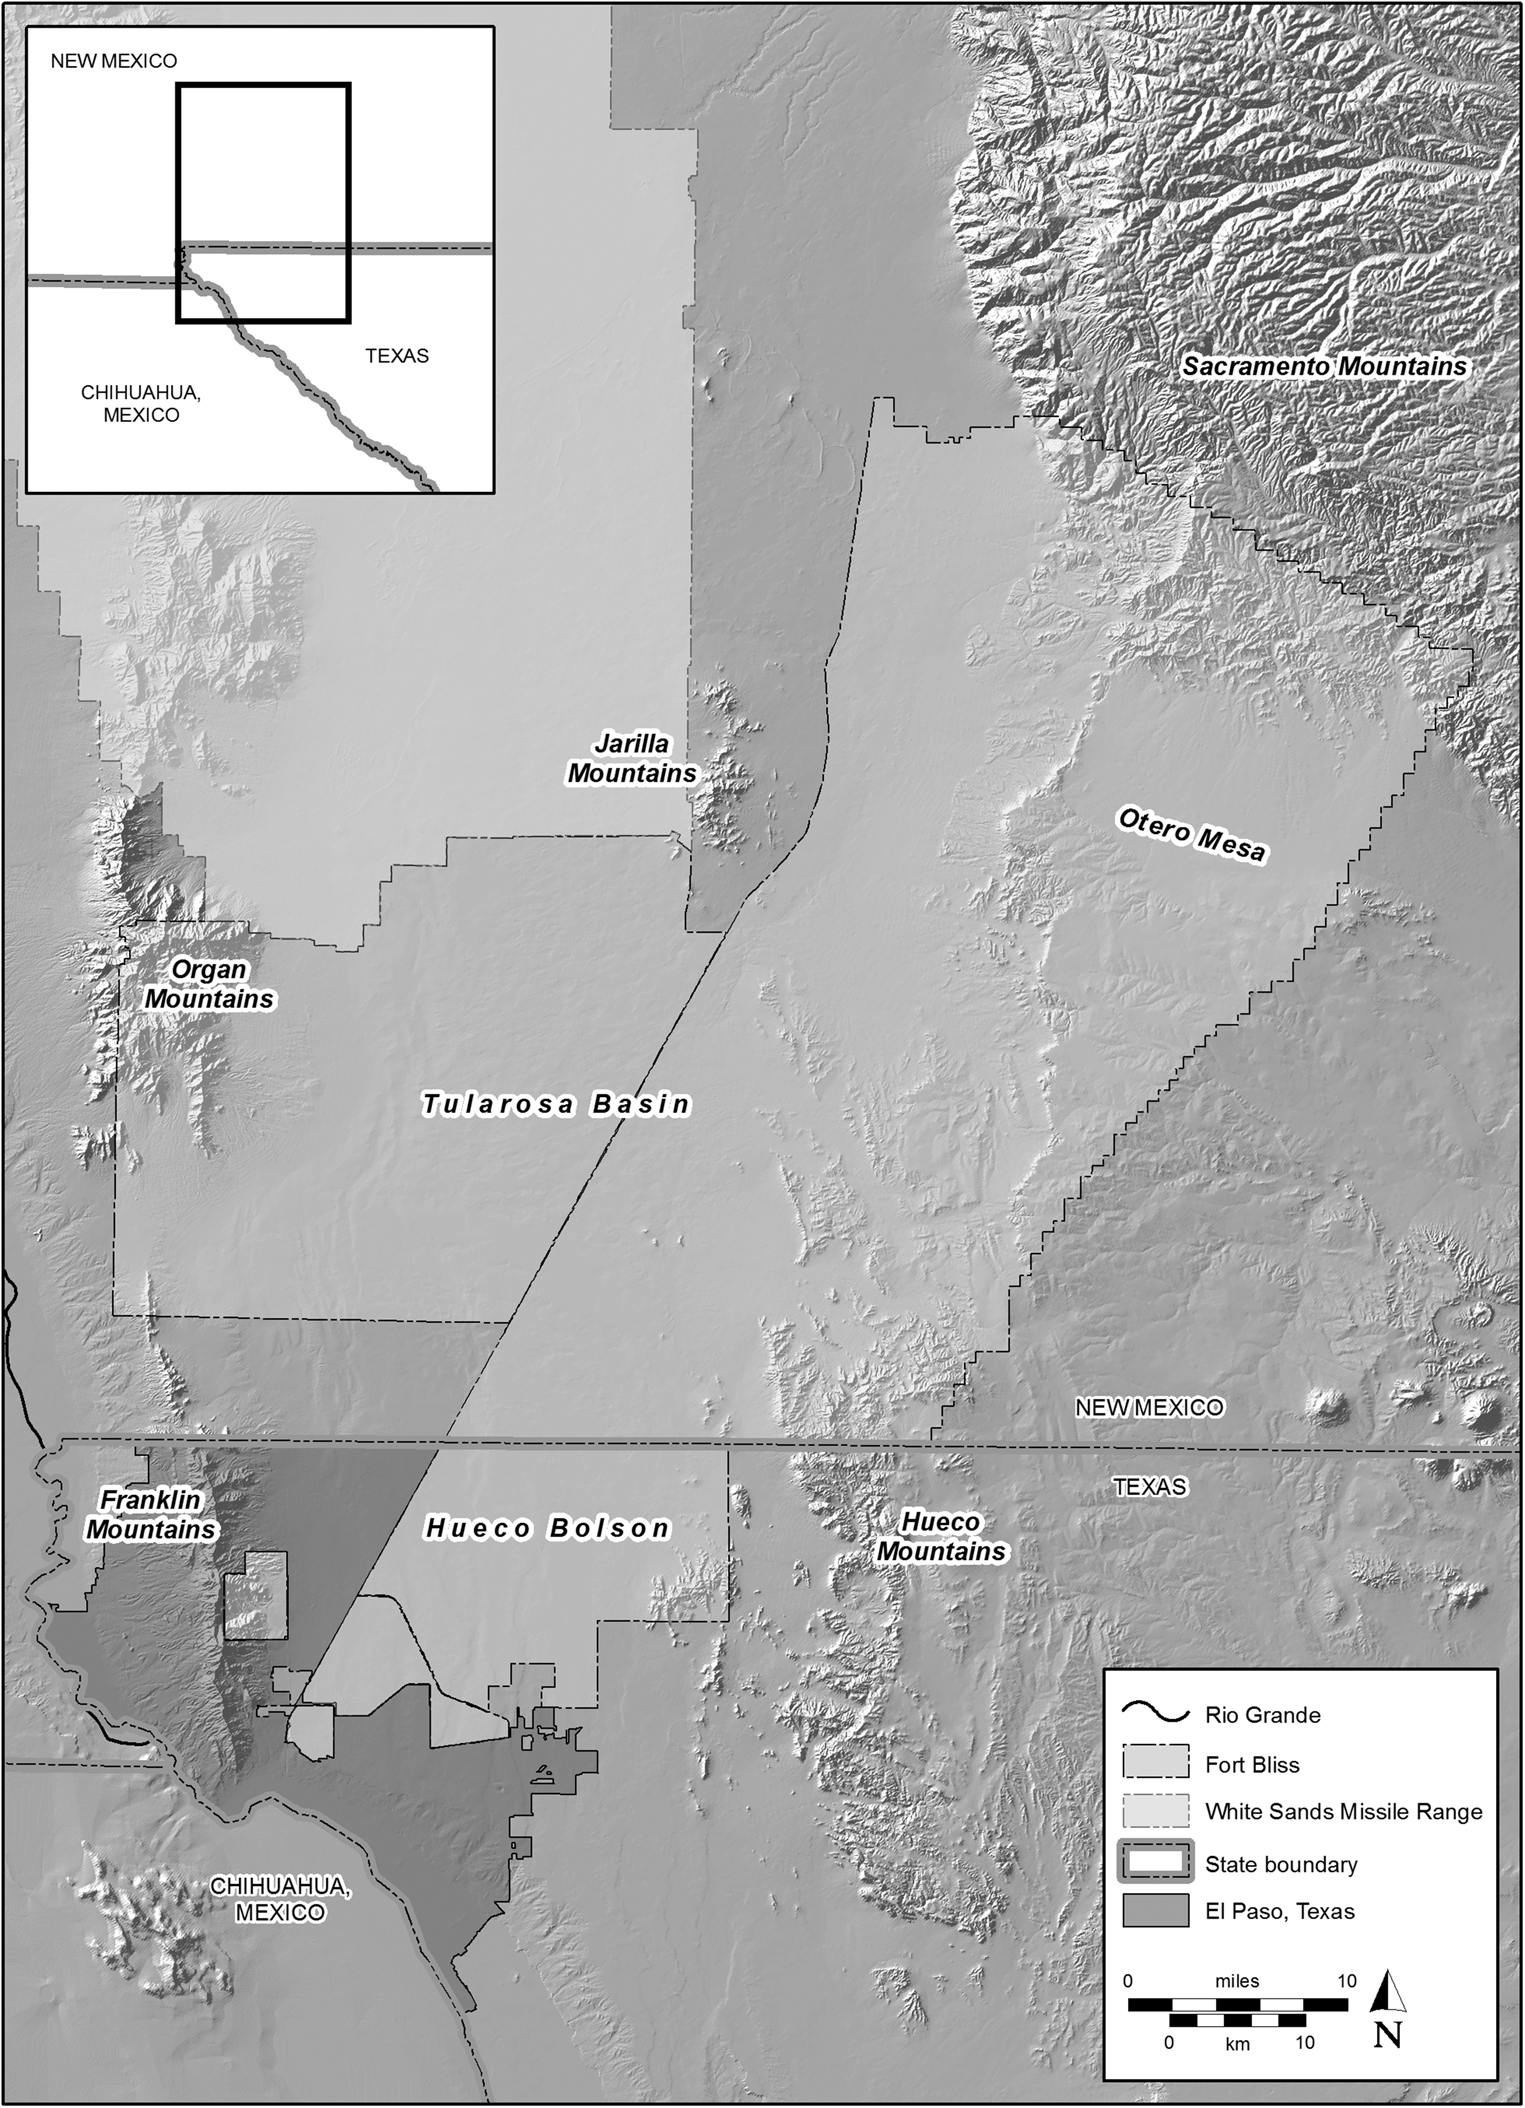
FIGURE 1. Map of Fort Bliss, Texas, and the southern end of the White Sands Missile Range, New Mexico, showing major local landforms mentioned in the text.
TRU survey takes place in two phases: an identification phase and a site recording phase. The identification phase focuses on identifying and recording artifacts and features within individual TRUs, without attempting to identify site boundaries. Archaeologists walk evenly spaced transects, as they do with conventional approaches, but instead of fanning out when cultural materials are encountered, they confine their observations to TRUs assigned to them on their respective transects. Once TRUs have been recorded across a survey area, preliminary site boundaries are generated by algorithmically applying agency- or installation-specific site criteria in a GIS to the distribution of archaeological materials across the survey area.
This first approximation of site boundaries and content is used to guide a second site recording phase of fieldwork that is normally accomplished by a separate fieldwork session after data from the identification phase have been processed in a GIS lab. With cloud-based technologies available today, however, it is possible to undertake the site recording phase during the same field effort. The site recording phase of fieldwork is aimed at holistically assessing each site to complete the following tasks:
• Refine site boundaries and assess overlapping boundaries
• Address data gaps and data-quality issues
• Identify and describe resource characteristics of special importance for interpreting site significance, such as distinctive artifact or feature types
• Further describe and contextualize resource characteristics, disturbance, and environmental setting at the site level
• Complete site forms and other required paperwork
There are several distinct advantages of this survey approach. For one, variation in survey intensity is reduced by focusing initial recordation on individual TRUs. Second, artifact, feature, and disturbance data are collected at a relatively fine level of spatial precision and used to summarize site content and estimate preliminary site boundaries. Three, these data are available for review during the site recording phase, allowing investigators to focus on recording the site as a whole without needing to further map the site and record its contents. Four, TRU data can be used flexibly in the future to manage sites and site components, analyze archaeological distributions, and reassess site boundaries and significance, should criteria for defining sites or interpreting their significance change. TRU survey therefore produces the information required for typical site management needs in a transparent, replicable fashion while also retaining uniformly collected data spatially referenced at the resolution of individual TRUs. Importantly, these data can be continually reused after a project has been completed for novel and unanticipated research and management needs (Figure 2).
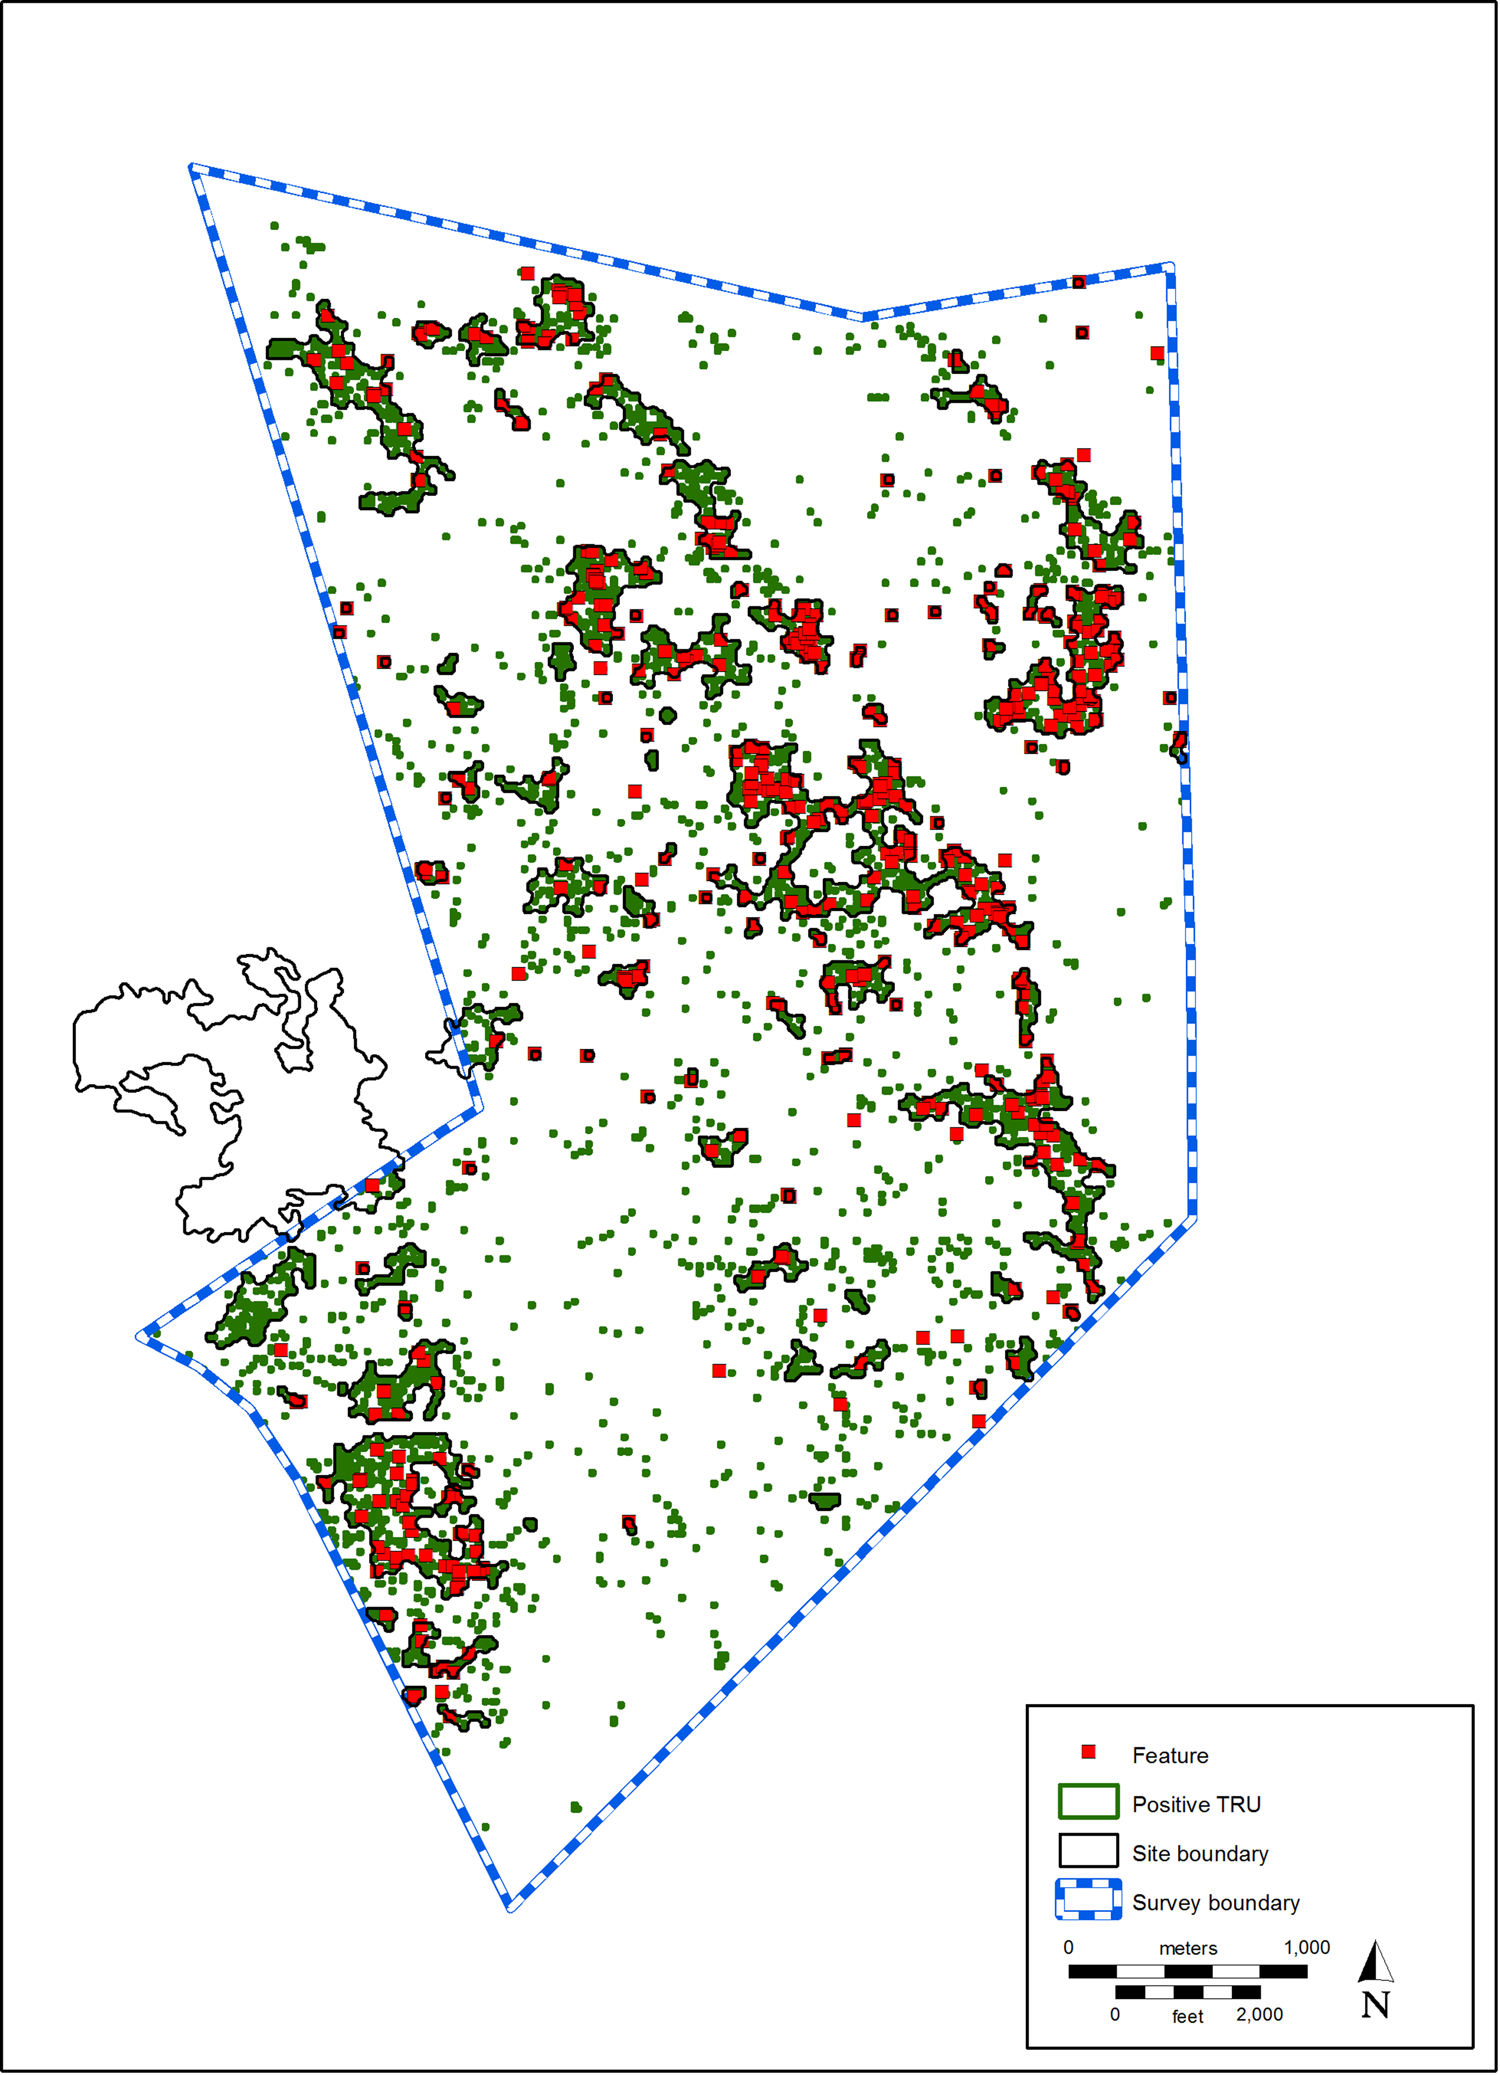
FIGURE 2. TRU data for a representative survey project, showing distributions of archaeological features and positive TRUs overlaid with archaeological site boundaries determined algorithmically (adapted from MacWilliams et al. Reference MacWilliams, Vierra and Schmidt2011).
Implementation of the TRU System
At Fort Bliss, the TRU method has been the mandatory approach for archaeological survey under both Section 106 and Section 110 since the late 1980s (Lukowski and Stuart Reference Lukowski and Stuart1996). More recently, use of the TRU system has been applied in the Permian Basin of southeastern New Mexico on lands managed by US Bureau of Land Management (BLM) Carlsbad Field Office (Heilen and Murrell Reference Heilen and Murrell2015), in southwestern Idaho on lands managed by the BLM and Mountain Home Air Force Base (Heilen Reference Heilen2018), and elsewhere. To date, hundreds of thousands of acres have since been surveyed or resurveyed using the method.
The scale of TRUs used in the field is determined by the transect spacing required for pedestrian survey in a given jurisdiction. For example, 15 × 15 m TRUs are used at Fort Bliss to accommodate the 15 m survey spacing required there. Crew conduct survey TRU by TRU, recording all artifacts or features encountered within the individual TRUs in which they are observed (see explanatory note in Miller et al. Reference Miller, Graves, Ernst, Swanson, Rocek and Kenmotsu2018). As with conventional survey, extremely high quantities of artifacts present within a given TRU may be estimated by class and type rather than individually counted. Because such estimates are made at the scale of an individual TRU rather than for a site as a whole, they can be much more easily revisited and corroborated during site recording or by subsequent field efforts.
At Fort Bliss, the CRM program requires a baseline set of attributes and observations that all TRU deliverables must contain. Individual researchers and contractors can record data using their own survey technologies and data models so long as the required data standard is met. Standardized TRU data are maintained at the project level and compiled into a master installation-wide geodatabase by the installation's GIS managers. The material culture categories captured by this master dataset are relatively reductive, consisting of artifact and feature counts for broadly defined classes. Finer-grained artifact and feature attribute data are collected using proprietary formats developed by individual contractors. Submitted survey data can be requested by contractors and other interested parties for analysis and research.
Early TRU surveys were conducted manually using a time-consuming and labor-intensive system based on printed aerial photos, paper records, hand-drawn maps, and grid overlays (e.g., Lukowski and Stuart Reference Lukowski and Stuart1996; O'Leary et al. Reference O'Leary, Kludt, Church and Mauldin1997). Since then, the efficiency and accuracy of the survey system has been greatly enhanced through the application of global positioning systems (GPS), digital recording interfaces, and data-management technologies (Figure 3; see e.g., Austin Reference Austin2014; Cobb et al. Reference Cobb, Earley-Spadoni and Dames2019). Drop-down menus and cascading selects are used to standardize data and increase recording efficiency.

FIGURE 3. Example of a digital recording interface for a contemporary TRU application.
The application of these technologies has allowed TRU data to be efficiently captured and managed within a GIS, with data recorded electronically via a series of digital forms. Through use of online platforms, such as ArcGIS Online, data collected during survey can now be transmitted from the field to a master project dataset and viewed, quality controlled, and manipulated in near real time. High-precision GPS, now widely available, are used to ensure that surveyors can quickly and accurately monitor their location within a TRU. Field recording applications can be configured to alert surveyors should they deviate from their transect or stray outside the TRU being recorded.
To delineate preliminary site boundaries, site-definition algorithms that replicate agency- or installation-specific criteria for identifying archaeological sites—such as minimum artifact frequencies or associations between artifacts and features within a TRU or neighborhood of TRUs—are applied digitally across a dataset via scripted GIS operations. The area around these “site positive” TRUs is then buffered to search for nearby TRUs containing archaeological materials. If any are found, those TRUs are added to the site; sites that share one or more TRUs are merged into a single site. The area around TRUs assigned to a site is then buffered and searched again for any additional TRUs containing archaeological materials. Sites continue to agglomerate in this fashion until no additional TRUs containing archaeological materials are found. Preliminary boundaries derived from this process are then validated in the field during site recording efforts (Figure 4).

FIGURE 4. Flowchart demonstrating the decision-making process employed by scripted algorithms to identify and define site boundaries at Fort Bliss, Texas.
The site recording phase allows investigators to revisit concentrations of cultural materials armed with knowledge of the previously recorded distribution of artifacts, features, disturbance, and ground conditions. This also allows investigators to develop additional insights regarding a site's context and relationship to other resources rather than focus narrowly on recording site content and extent. The data from individual projects can be combined to investigate the following:
• Archaeological patterns across the landscape
• Variation through time in what was observed in individual grid cells
• The effect of disturbance and ground conditions on site integrity and survey results
• Correlations among archaeological and landscape characteristics
• Interobserver error and variability
CHALLENGES TO IMPLEMENTING A TRU SYSTEM
Although the TRU method is in several ways more systematic, transparent, and consistent than conventional pedestrian survey, it can also introduce technical challenges into the survey process. As part of a cost-benefit analysis of implementing the TRU method in the Permian Basin of New Mexico, Statistical Research Inc. (SRI) conducted an online survey to better understand how cultural resource professionals in the region perceived TRU survey (Heilen and Murrell Reference Heilen and Murrell2015). The 42 survey respondents represented a range of cultural resource professionals, including contract archaeologists, land managers, and SHPO representatives. More than 80% of respondents rated themselves as moderately or very familiar with the method.
Many respondents cited the technical requirements of the TRU method as potential disadvantages. Without question, the large volume of structured, location-linked data generated by TRU survey can pose a challenge. A single survey project may generate thousands of TRUs containing anywhere from a handful to hundreds of individual artifacts or features. Staff members with specialized expertise in GIS and data management typically are needed to fully validate a large TRU dataset and use it to define site boundaries. The volume of TRU data generated can be several orders of magnitude greater than what a site-based survey will generate. During one TRU survey in a portion of New Mexico's Permian Basin, nearly 10,000 individual TRUs containing cultural resources were recorded within an approximately 6,700-acre survey parcel. These data ultimately represented 101 individual sites, many of them large and complex (Cason Reference Cason2021).
Fortunately, the required level of GIS training to handle and manipulate TRU data is increasingly common in today's CRM workforce, and tools can be devised to automate and streamline data processing tasks. Similarly, advances in GIS technology and development of platforms such as ArcGIS Online and ArcGIS Portal allow data from multiple users to be synced and managed online in the cloud. These emerging capabilities have lowered the technical challenges of TRU implementation even in the six years since our 2015 survey.
Many respondents also expressed concern that implementing TRU survey would increase field labor and training costs. However, a statistical analysis comparing a sample of five TRU and five non-TRU projects found no significant differences between survey approaches in terms of field hours per acre or site, or recording rates per hour (Heilen and Murrell Reference Heilen and Murrell2015). Indeed, analysis suggests that TRU survey can be more efficient than conventional survey in some settings. Moreover, field effort associated with TRU survey is more predictable than conventional survey because the effort needed to deploy the system is closely tied to the quantity of materials needing to be recorded. Training is required to prepare field crew for TRU survey, but our experience suggests that training requirements are comparable with conventional survey overall.
Most survey respondents had positive attitudes toward other aspects of the TRU system (Figure 5). Most survey respondents agreed that the TRU method produces data that are more comparable and reliable than data produced by conventional site-based survey. Similarly, survey respondents felt that TRU survey was likely to produce results better suited to interpretation and management than conventional survey. For example, a major concern in CRM fieldwork is to evaluate whether a site or its components can convey information important to answering important research questions or filling data gaps. Such resources are often considered or determined eligible for listing on the NRHP under criterion D. Should research questions or data gaps change, however, it can be difficult to reevaluate eligibility without expending additional field effort. With TRU data, however, the original survey data can potentially be revisited to reinterpret the significance of a site or its components, which saves time and effort.

FIGURE 5. Survey responses from CRM professionals regarding TRU reliability, comparability, and utility (adapted from Heilen and Murrell Reference Heilen and Murrell2015).
Site Definition Using the TRU Method
Site-based analysis of the archaeological record requires that sites are able to be reliably and consistently compared with each other. In areas with long histories of extensive archaeological investigation, however, analysts and resource managers often contend with sites recorded using disparate criteria (Figure 6). As archaeologists and land managers shift to landscape approaches and synthesize data across large regions, the problem of comparability is exacerbated. An enormous effort can be required to standardize, normalize, and harmonize data from multiple CRM projects. When that effort can be applied, many factors remain that diminish and confound comparability among sites recorded at different times and places and by different organizations.
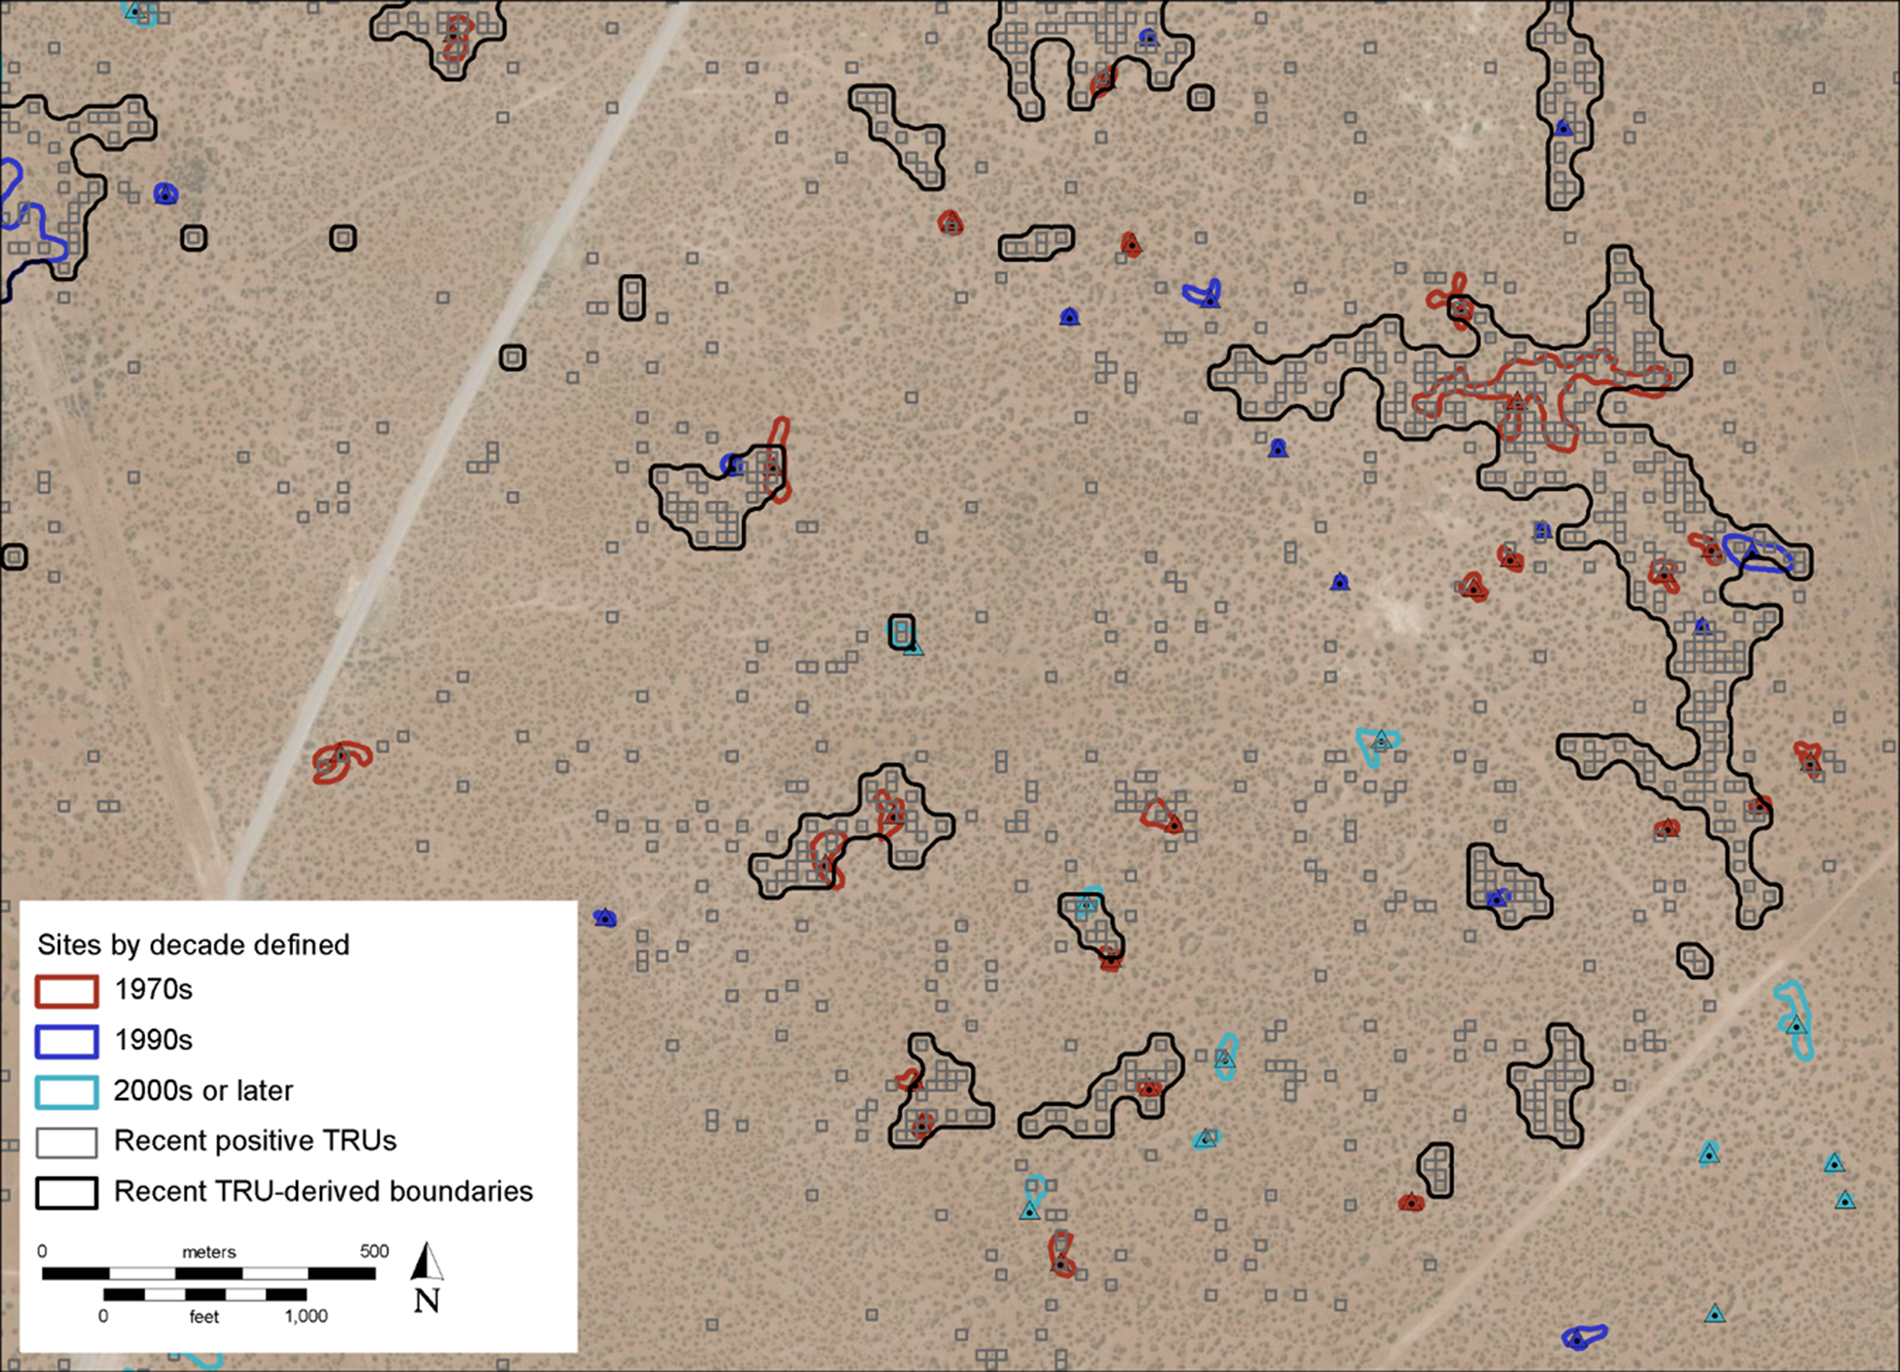
FIGURE 6. Example of overlapping site boundaries defined over time using different sets of site criteria, from an area in the Tularosa Basin at Fort Bliss, Texas.
Site definition in CRM often involves the application of site criteria that establish a threshold for artifact or feature frequency and diversity within a certain area, such as within a 15 or 20 m radius. The application of these criteria in the field can be a subjective process, engaging the perception and judgment of individual researchers, however. Although site criteria can vary among jurisdictions or change over time, sites produced by differing sets of criteria are typically managed alongside each other and treated as equivalent units of analysis and management, without reference to the criteria and methods used to define them.
By contrast, sites defined using the TRU system can be confidently interpreted as directly reflecting the nature and distribution of cultural resources observed during survey. If questions arise or additional verification is needed, artifact and feature observations can be reexamined or reconstituted. Site boundaries can be redefined should site criteria be changed or reevaluated. As an example, Figure 7 compares site boundaries generated following the TRU method, depending on whether FCR is included as an artifact class.
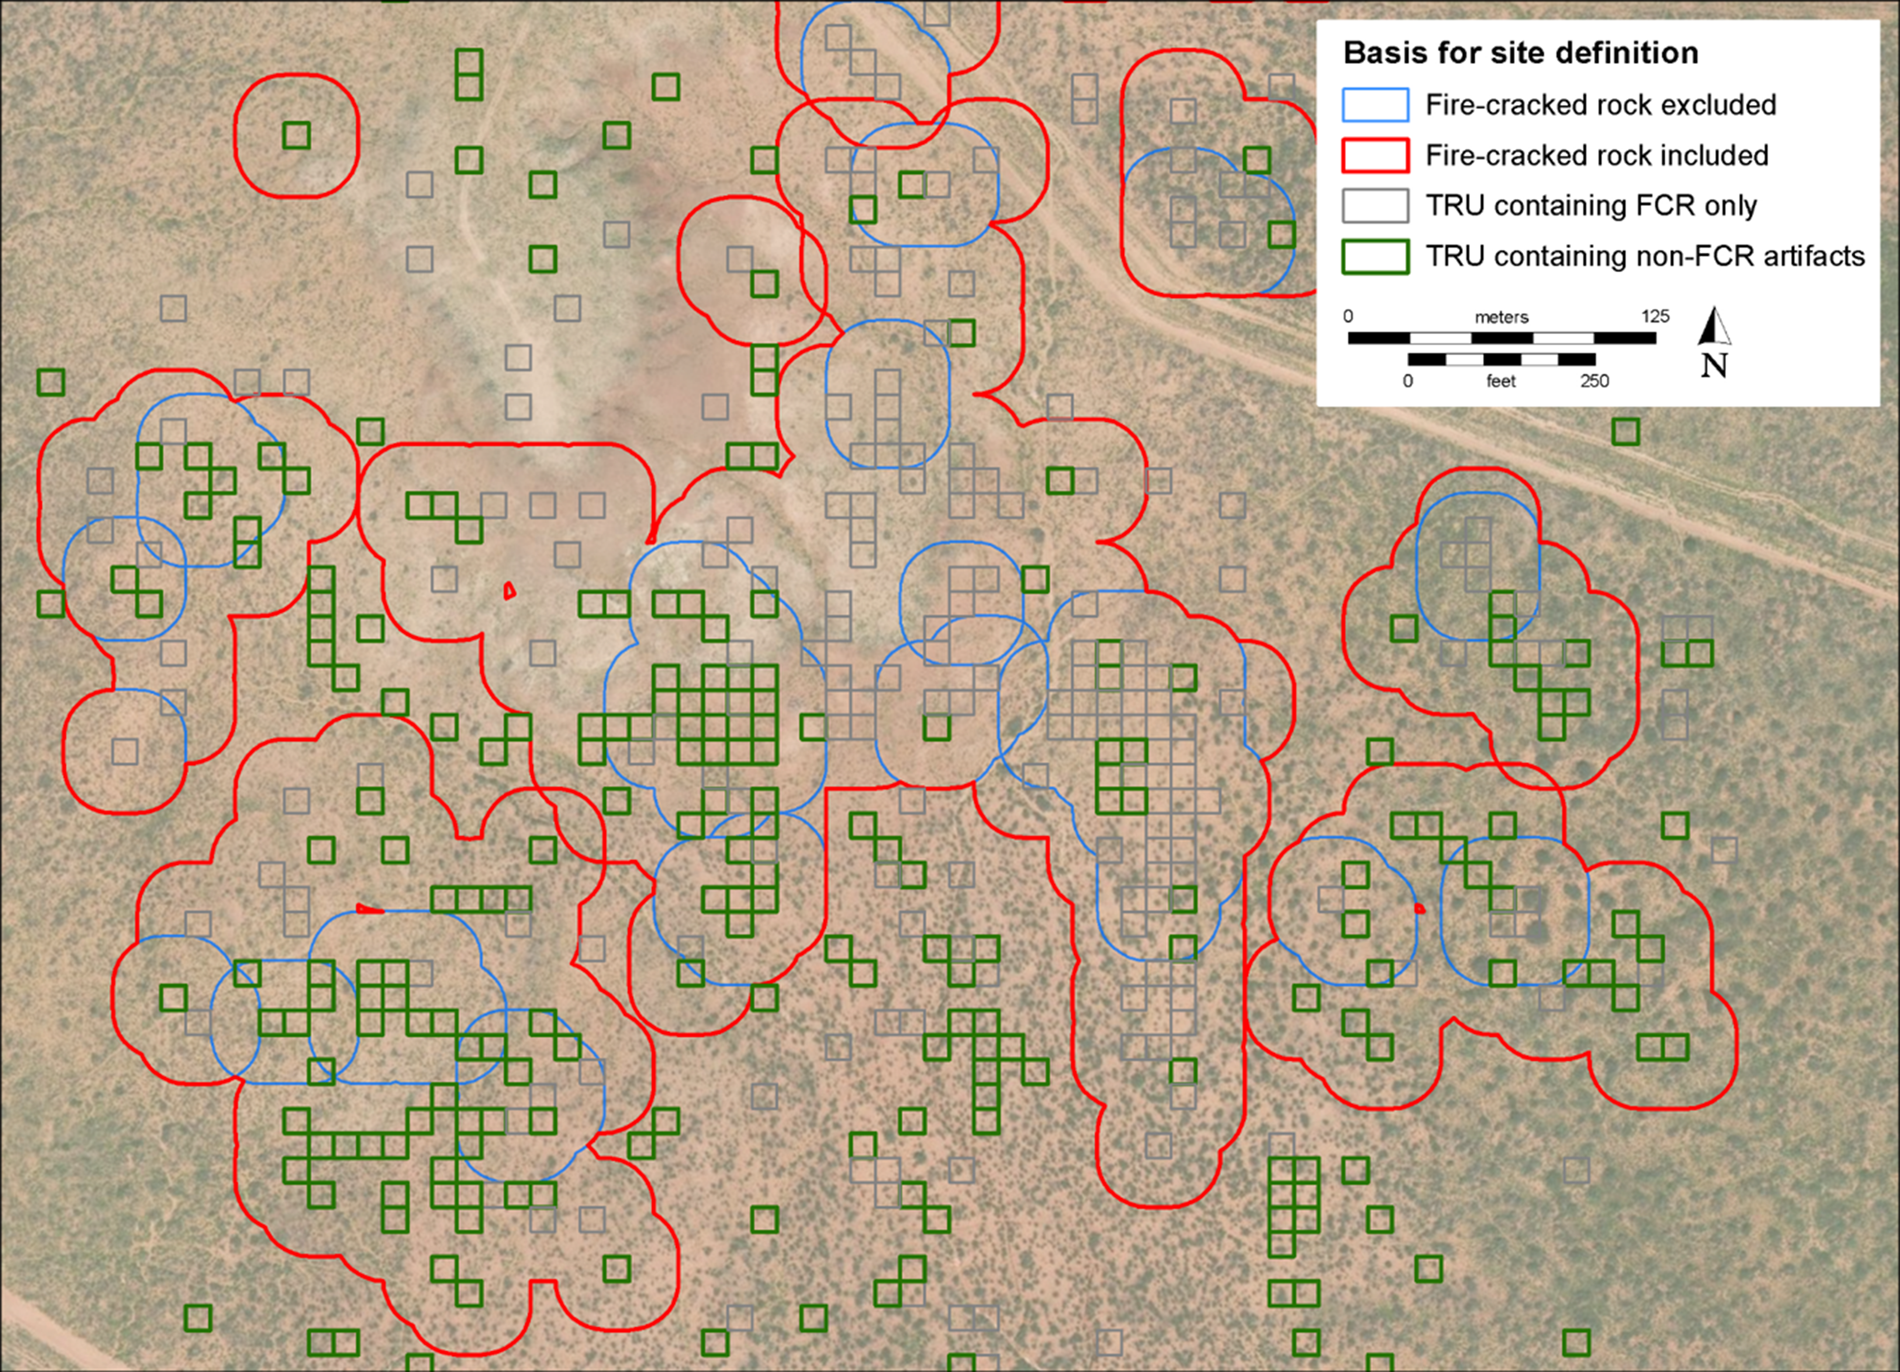
FIGURE 7. Differences in site boundaries depending on whether or not a site-definition algorithm considers fire-cracked rock, from an area in southeastern New Mexico.
The considerable research potential of TRU data is evident if analysts take a step back to consider the archaeological record at a landscape scale. Research conclusions based on conventional survey data may overlook the information potential of nonsite cultural materials, or isolated finds (Rockman Reference Rockman, Altschul and Rankin2008). These data are typically presented and managed separately from site data and are often afforded only minimal consideration. Isolated finds, for example, are often reported briefly, separately from sites, and documented minimally in one or more report tables that list their basic attributes. By contrast, TRU data are well suited for distributional analysis at a variety of scales, from an intrasite level to the scale of landscapes or regions, including data aggregated from multiple individual projects. As an example of this multiscalar utility, we highlight research into precontact ceramic sherd trails in the Tularosa Basin of New Mexico.
FINDING TRAILS HIDDEN IN TRU DATA
During pedestrian survey at Fort Bliss, ceramic artifacts are often recorded as isolated finds as well as artifacts located within sites. Trail features, however, are rarely discernable in the field because surficial aeolian activity often obscures them (Miller et al. Reference Miller, Graves, Ernst, Swanson, Rocek and Kenmotsu2018). Recording trails by judgmentally following visible trail segments using a targeted survey approach is generally not possible at Fort Bliss, although the approach can be fruitful in other contexts (see, e.g., Darling and Eiselt Reference Darling, Eiselt, Czarzasty, Peterson and Rice2009). Distinctly linear distributions of ceramic artifacts are clearly visible in TRU data, however, traversing both recorded archaeological sites as well as surveyed areas where sites have not been identified (Figure 8).
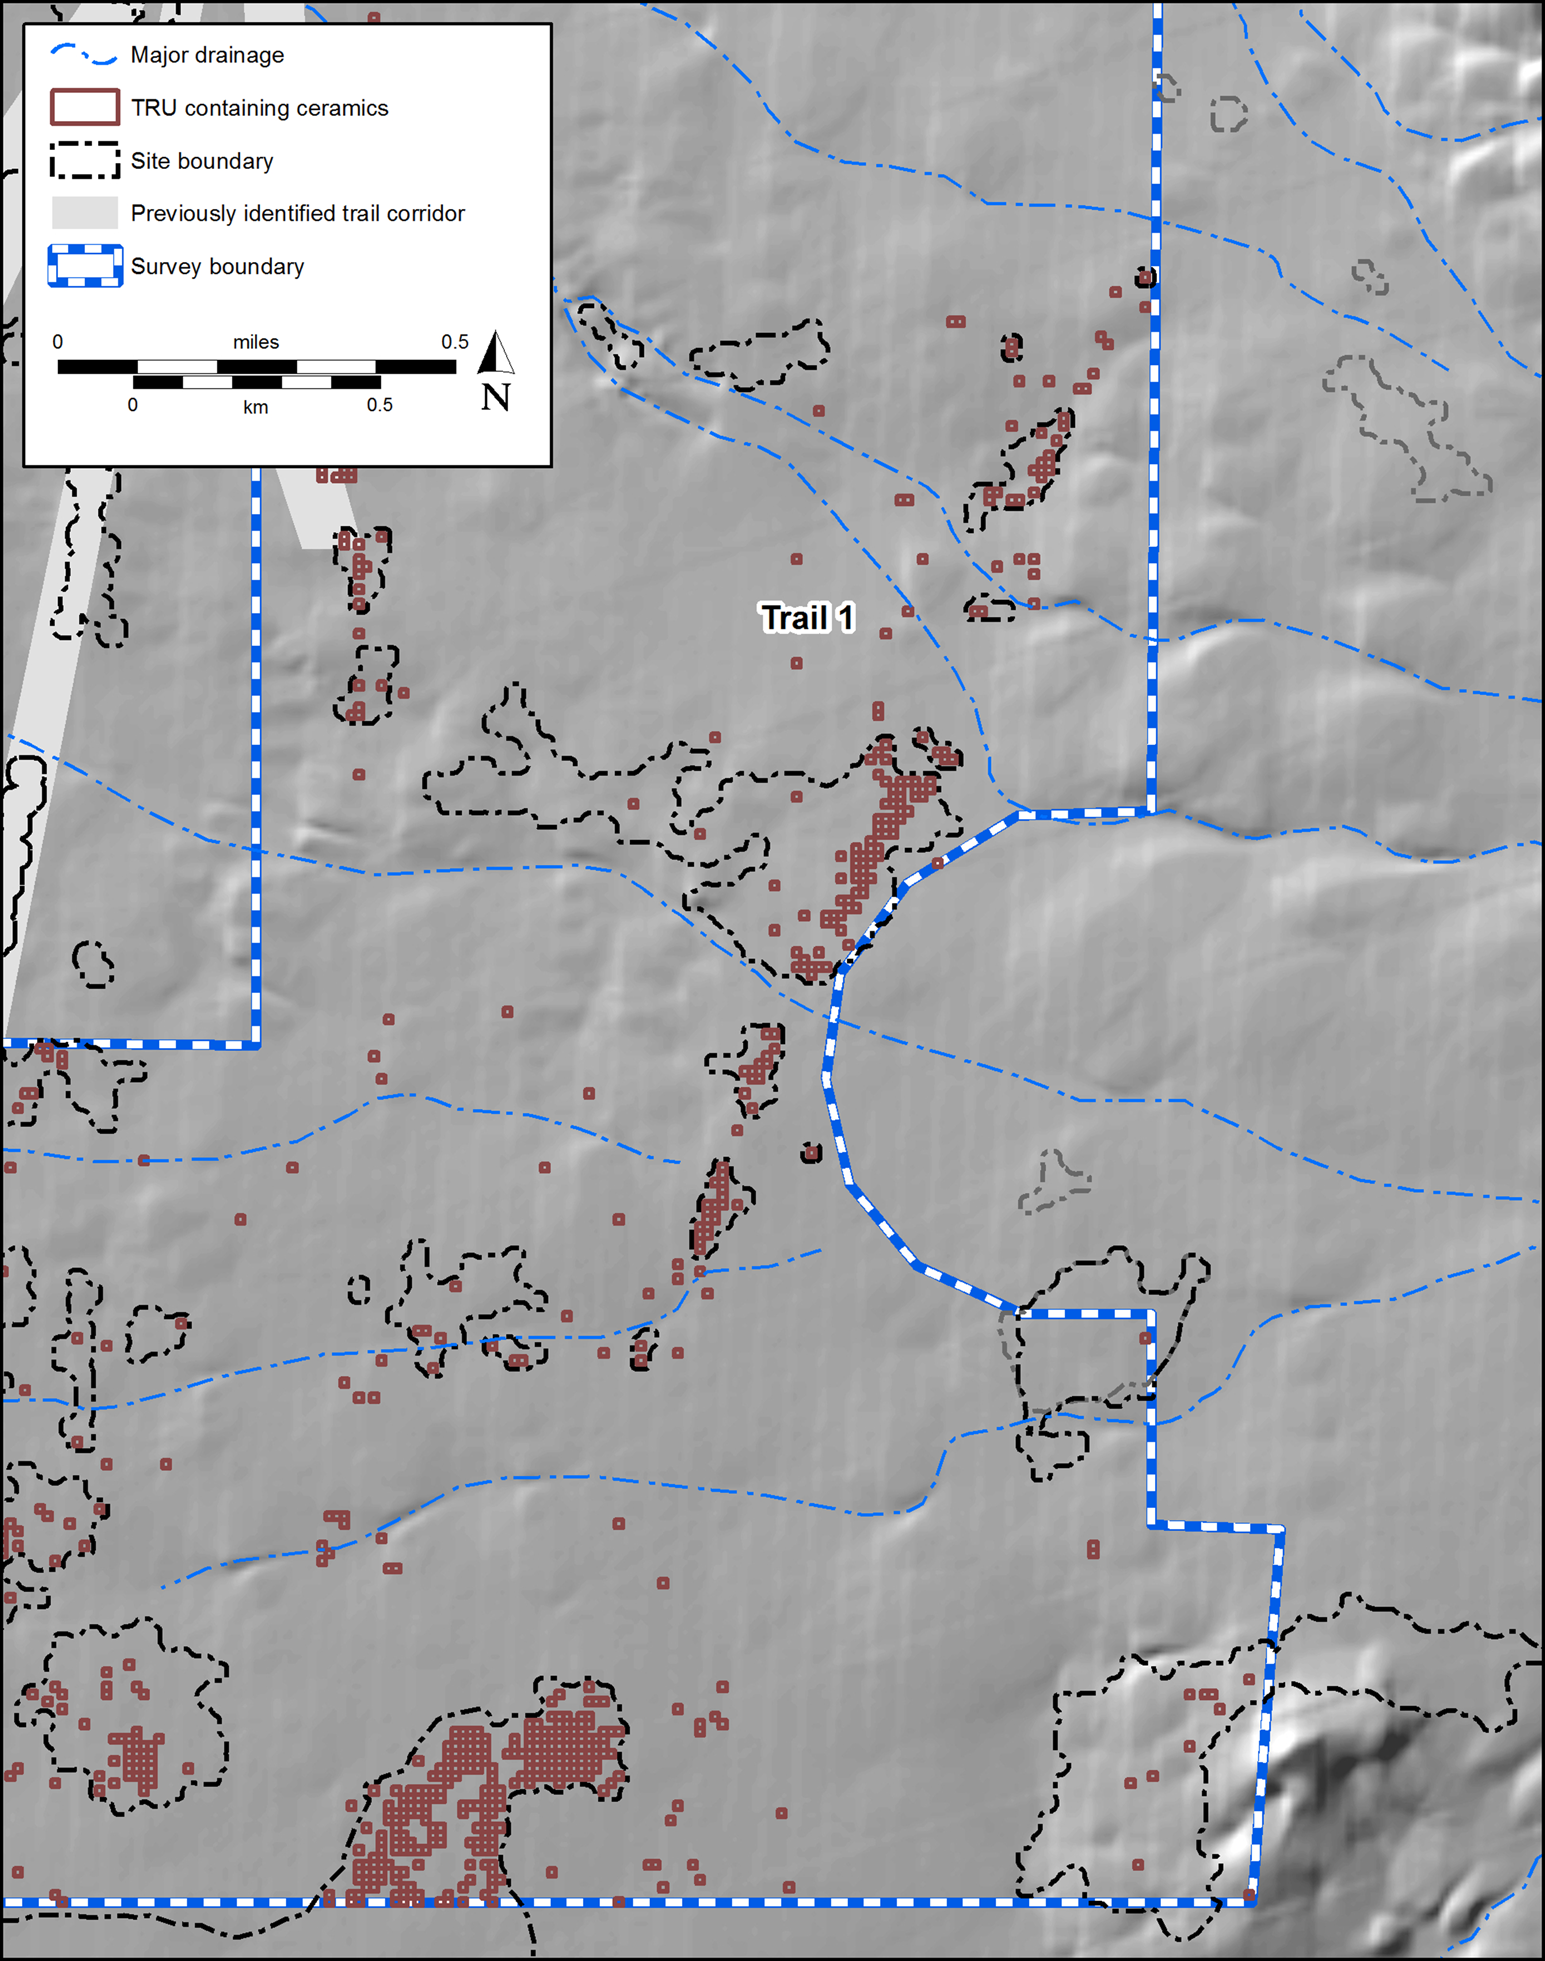
FIGURE 8. Locations of all TRUs containing ceramic artifacts within a survey area in the Tularosa Basin at Fort Bliss, New Mexico, showing their markedly linear distribution (adapted from Leckman et al. Reference Leckman, Mills, Windingstad, Vierra, O'Connell, Byrd, Polanyi, Ward, Polanyi, Mills and Vierra2017).
In the early 2000s, archaeologists working at Fort Bliss began noticing linear distributions of isolated ceramic artifacts when examining the results of large TRU surveys (Kludt et al. Reference Kludt, Stowe, Church and Walley2007; Miller et al. Reference Miller, Graves, Ernst, Swanson, Rocek and Kenmotsu2018). Ethnoarchaeological studies have shown that ceramic vessels most often break during washing activities or during transport to or from water sources (Beck Reference Beck, Altschul and Rankin2008). Indeed, ceramic artifacts have often been found distributed along the lengths of trails identified in the Papaguería (e.g., Becker and Altschul Reference Becker, Altschul, Altschul and Rankin2008; Darling Reference Darling2006; Darling and Eiselt Reference Darling, Eiselt, Czarzasty, Peterson and Rice2009; Hayden Reference Hayden1976; Rogers Reference Rogers1939; Wright Reference Wright2022), Mojave Desert (e.g., Davidson Reference Davidson2009; Murphy Reference Murphy2015), and the Chaco Basin (Friedman et al. Reference Friedman, Sofaer and Weiner2017). In the absence of visible footpaths, Wright (Reference Wright2022) has successfully identified segments of precontact trails and routes of movement in Arizona by systematically surveying suspected trail corridors in search of distinctly linear distributions of ceramic artifacts, similar to those identified at Fort Bliss. In both areas, ceramic artifacts typically occur at their highest densities within 30 m of a suspected trail segment, in comparison to the surrounding landscape where ceramic artifacts are often rare or absent. The basic method used for identifying trails at Fort Bliss is as follows (Leckman Reference Leckman, Vierra, Ward and Mills2013; Miller et al. Reference Miller, Graves, Ernst, Swanson, Rocek and Kenmotsu2018):
(1) Distinct linear arrays of contiguous or closely situated TRUs containing one or more ceramic artifacts are identified as possible trail segments.
(2) Ceramic densities are calculated within 30 m of each hypothesized trail segment and compared with ceramic densities for the survey area as a whole.
(3) Goodness-of-fit analysis is conducted to assess if ceramic densities associated with each trail segment are significantly higher than for the survey area as a whole.
(4) The geomorphic setting of each trail segment is examined to establish if the potential trail segment rests on a relatively stable geomorphic surface to rule out alternate explanations for the formation of linear ceramic distributions, such as alluvial action or road construction.
(5) Trails are categorized based on a series of criteria related to the intensity of trail use and confidence in interpretation, including the level of contiguity and the nature, density, and distribution of spatially associated sites, features, and artifacts, such as temporally diagnostic artifacts and pot drops.
As researchers identified more trails across the southern Tularosa Basin, they realized the enormous research potential of extending analysis to a regional scale, beyond the level of individual projects. Shifting patterns of trail use over time could now be traced across the landscape to investigate regional land-use patterns and identify relationships among sites and their environment. For example, the importance of intervisibility in trail making and mobility has repeatedly been demonstrated in the Fort Bliss region, with strong relationships through time between trail locations, major zones of human habitation, and prominent natural features visible from trails (e.g., Garcés et al. Reference Garcés, Bruckse, Ibarra, Droz, Lukowski and Perez2011; Leckman Reference Leckman, Vierra, Ward and Mills2013; Leckman et al. Reference Leckman, Windingstad, O'Connell, Vierra, Unruh, Mills and Vierra2016, Reference Leckman, Mills, Windingstad, Vierra, O'Connell, Byrd, Polanyi, Ward, Polanyi, Mills and Vierra2017; Miller et al. Reference Miller, Graves, Ernst, Swanson, Rocek and Kenmotsu2018; Phillips and Leckman Reference Phillips, Leckman, MacWilliams, Vierra and Schmidt2010, Reference Phillips and Leckman2012a, Reference Phillips, Leckman, White and Surface-Evans2012b; Phillips et al. Reference Phillips, Leckman, Unruh, MacWilliams and Vierra2011).
In one study, trails defined from ceramic data collected by nine separate surveys were subjected to viewshed analysis (Figure 9). The results demonstrated that although two large late Formative occupational zones on either side of the Tularosa Basin were not intervisible, trails connecting these occupational zones were positioned to remain in view of prominent landmarks associated with them. Similarly, proximity analysis and detailed artifact analysis has allowed several previously recorded sites to be reinterpreted as trailside camps or vantage points (e.g., Chavez and Leckman Reference Chavez, Leckman, Vierra, Ward and Mills2013; Leckman Reference Leckman, Vierra, Ward and Mills2013; Leckman et al. Reference Leckman, Mills, Windingstad, Vierra, O'Connell, Byrd, Polanyi, Ward, Polanyi, Mills and Vierra2017; Phillips et al. Reference Phillips, Leckman, Unruh, MacWilliams and Vierra2011). At least one such site remained in use over an extended period (Phillips et al. Reference Phillips, Leckman, Unruh, MacWilliams and Vierra2011), signaling its potential use as a persistent place (Leckman Reference Leckman, Vierra, Ward and Mills2013; sensu Schlanger Reference Schlanger, Rossignol and Wandsnider1992).
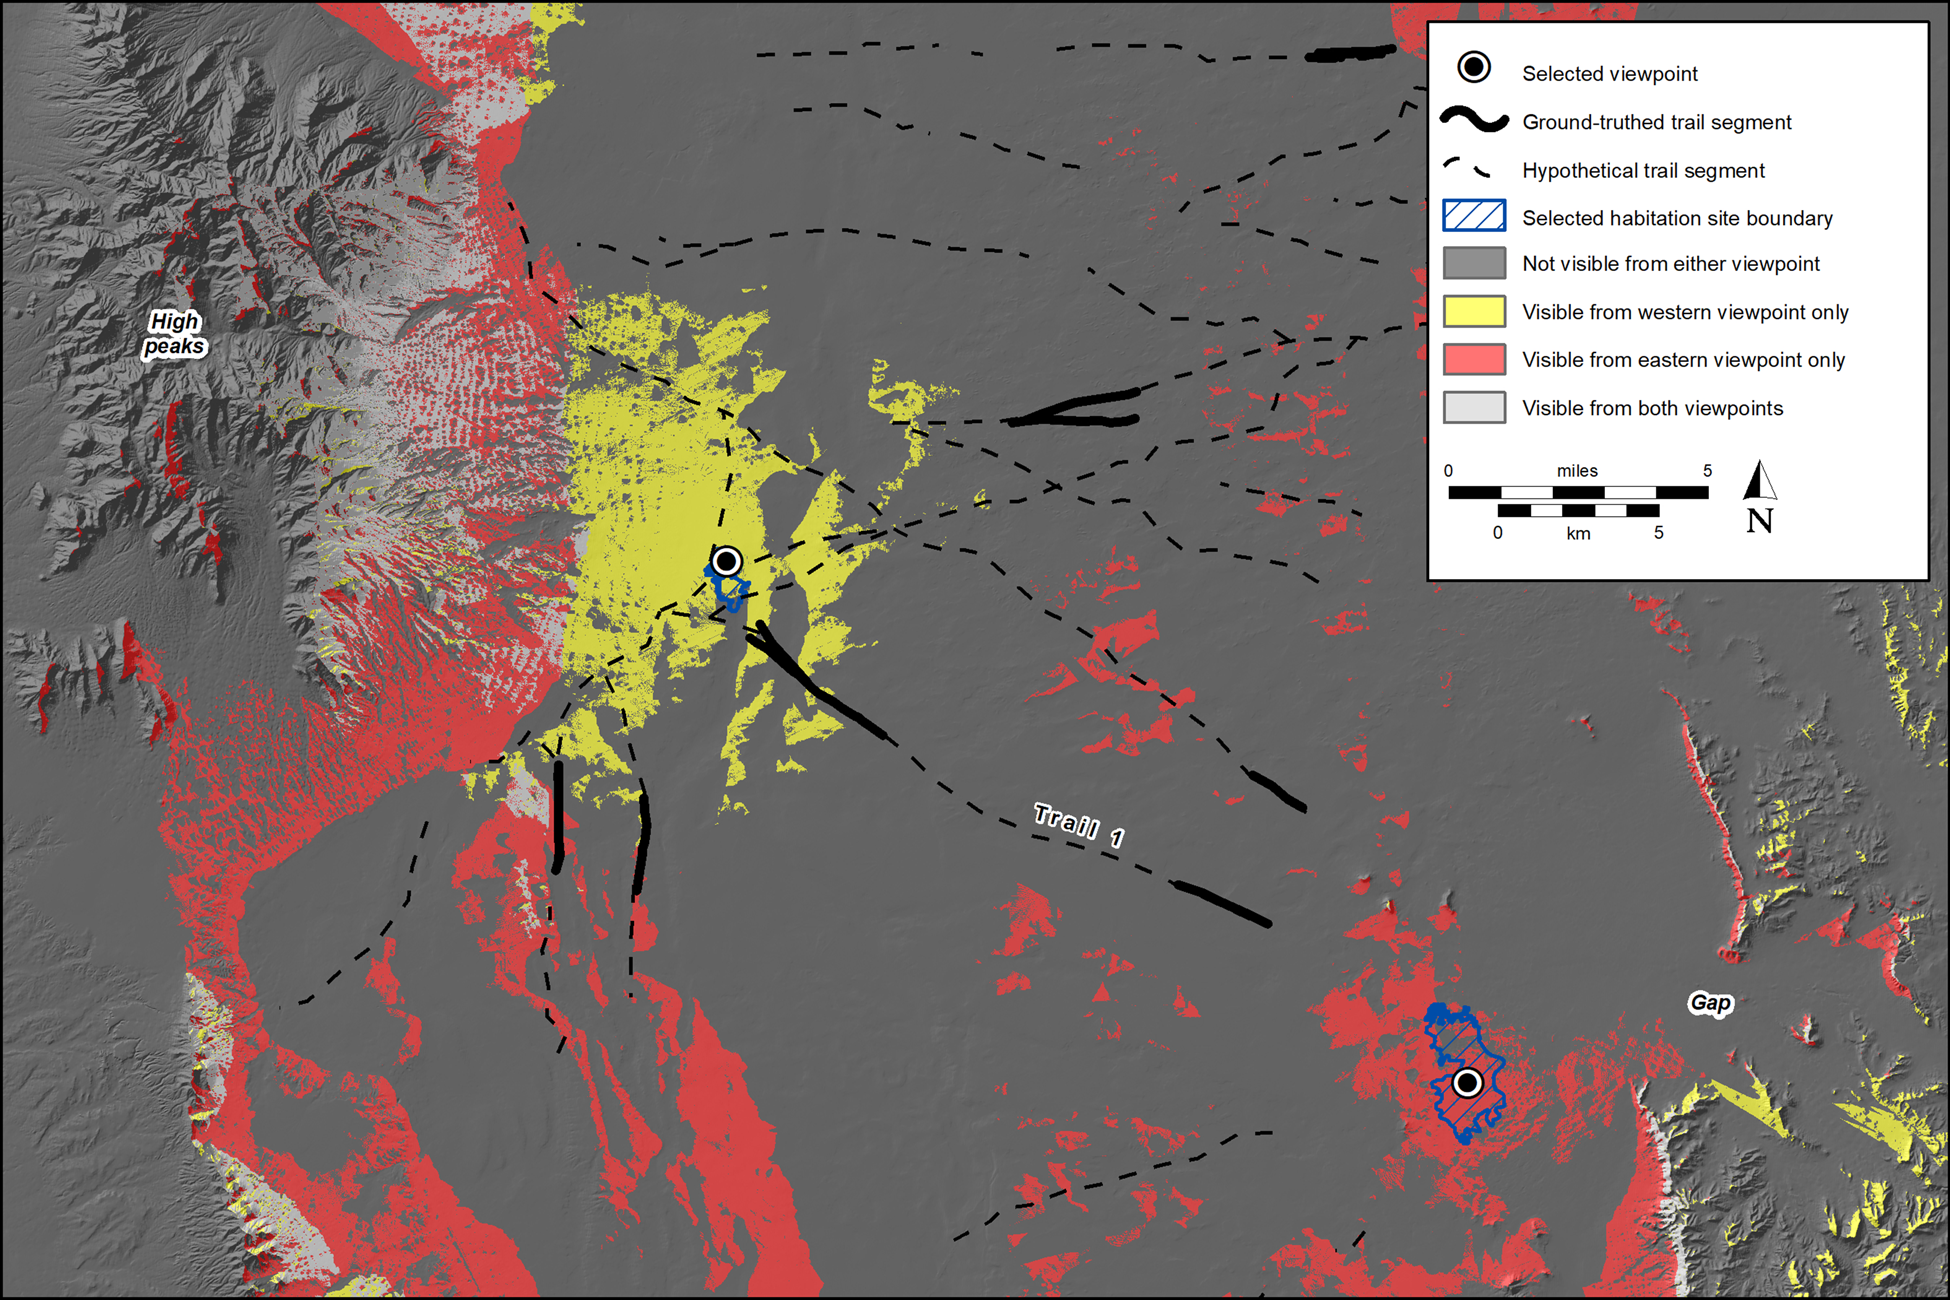
FIGURE 9. Intervisibility among selected occupational sites and prominent landforms along a precontact trail network, from an area in the Tularosa Basin at Fort Bliss, New Mexico (adapted from Leckman et al. Reference Leckman, Mills, Windingstad, Vierra, O'Connell, Byrd, Polanyi, Ward, Polanyi, Mills and Vierra2017).
The common data standard required by Fort Bliss for TRU data facilitates both direct and indirect collaboration among contractors and independent researchers. Approaches like those discussed above have been employed by multiple contractors. In one instance, a trail first identified by one contractor was later demonstrated by another contractor to mark a route between basin-floor habitation sites and an upland cave site containing rock art and evidence for pilgrimage and other ritual activities (Miller Reference Miller2019). Similar methods have also been applied to legacy sources of locational and artifact data collected under very different conditions, with impressive results. Analysis of point-located ceramic isolates documented by a large survey conducted in the late 1970s and early 1980s (Carmichael Reference Carmichael1986), for example, resulted in the tentative identification of an extensive network of trails across the entire southern Tularosa Basin. Segments of the trail system have since been ground truthed during TRU survey work (Garcés et al. Reference Garcés, Bruckse, Ibarra, Droz, Lukowski and Perez2011; Figure 10).
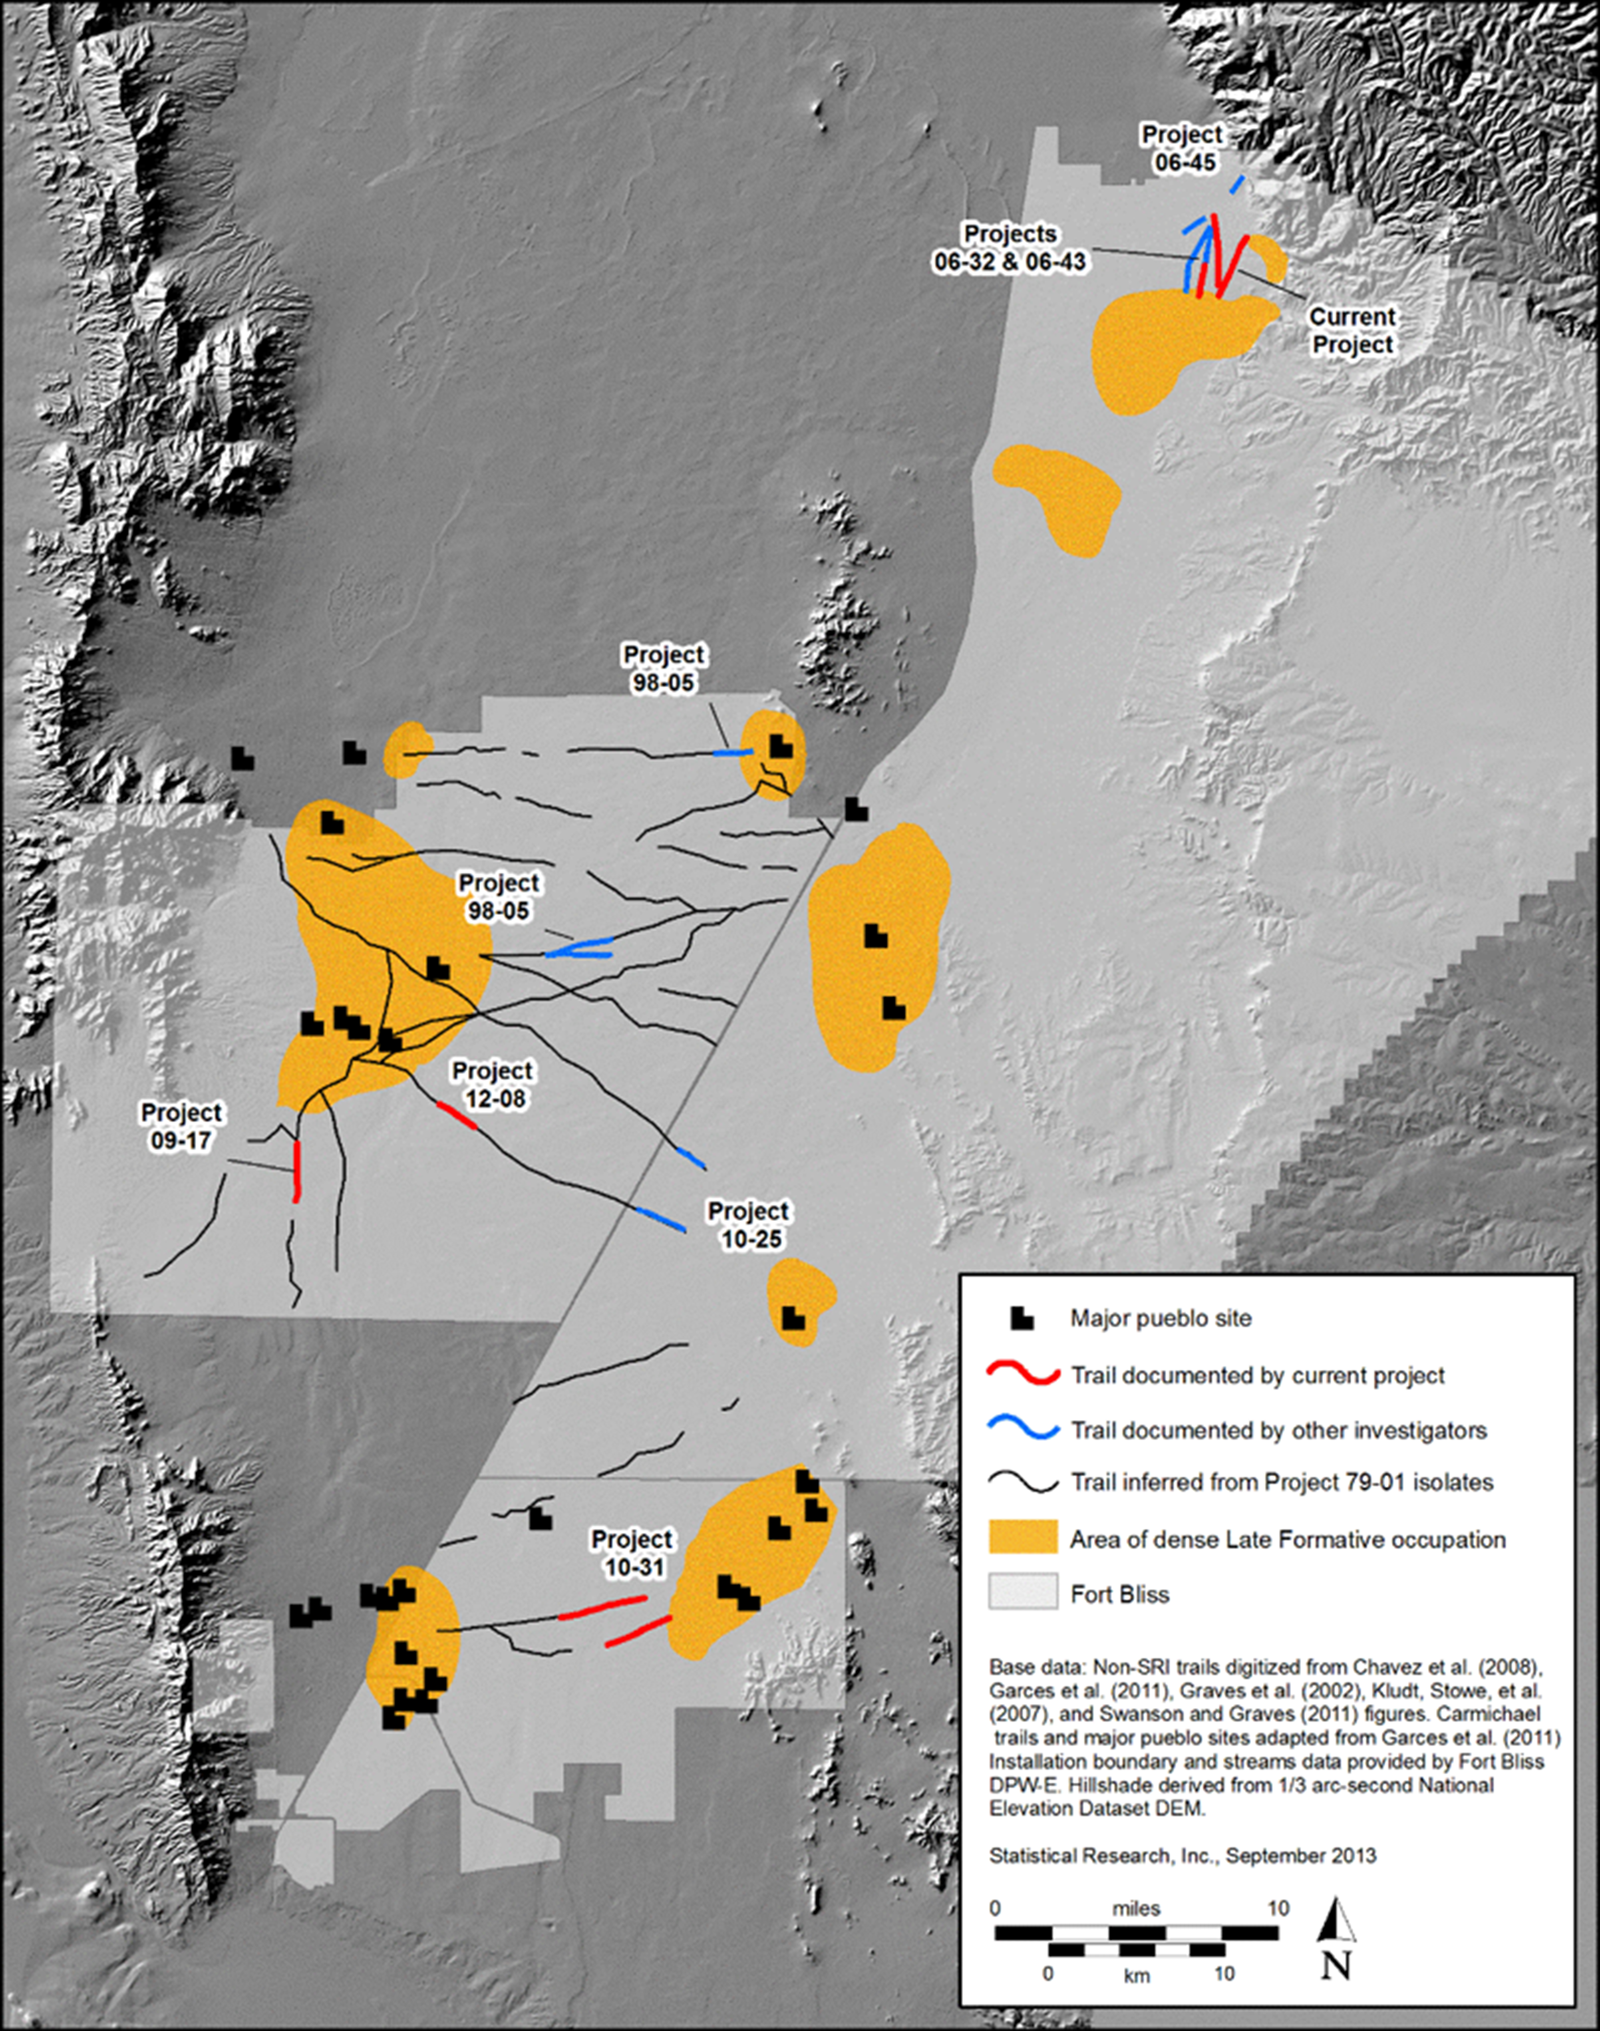
FIGURE 10. Precontact trails defined from ceramic data, connecting major habitational sites on opposite sides of the Tularosa Basin at Fort Bliss, southern New Mexico/northern Texas (adapted from Garcés et al. Reference Garcés, Bruckse, Ibarra, Droz, Lukowski and Perez2011 for Leckman Reference Leckman, Vierra, Ward and Mills2013).
The Importance of Trails to Landscape-Scale Research and Management
Aboriginal trails likely were much more numerous and important than the record of pedestrian archaeological survey indicates. Trails provide insight into where people traveled, potential relationships between sites, the intensity of travel between different areas, and how the landscape was used to obtain resources and structure social interaction (e.g., see Golledge Reference Golledge, Rockman and Steele2003; Heilen Reference Heilen2005; Miller Reference Miller2019; Miller et al. Reference Miller, Graves, Ernst, Swanson, Rocek and Kenmotsu2018; Murphy Reference Murphy2015; Snead et al. Reference Snead, Erickson, Darling, Snead, Erickson and Darling2009; White Reference White2007, Reference White, White and Surface-Evans2012; Zedeño and Stoffle Reference Zedeño, Stoffle, Rockman and Steele2003). The relationship between archaeological features and other landscape attributes—such as water sources or prominent landmarks—is facilitated by understanding the pathways that connect them. Trail systems exhibit formal attributes related to how they were used through time. For example, complex, localized pathway networks develop as resource use becomes regularized and human traffic increases. Heavily used pathways are often invested with facilities—such as stones, cairns, and petroglyphs—that increase the durability, visibility, and coherence of prehistoric trail systems (Helbing et al. Reference Helbing, Schweitzer, Keltsch and Molnár1997; Rogers Reference Rogers1939, Reference Rogers, Pourade, Copley, Wormington, Davis and Brott1966; Tani Reference Tani1995; Zedeño and Stoffle Reference Zedeño, Stoffle, Rockman and Steele2003). Trails and trail segments can also fall into disuse and become erased over time or be incorporated into new trail systems.
The act of traveling along pathways can itself be an important form of landscape interaction. In the arid Sierra Pinacate of northern Mexico, a vast system of trails documented by Hayden (Reference Hayden1967, Reference Hayden1976) connected scarce water sources called tinajas but also other areas of the landscape where water was absent. White's (Reference White2007, Reference White, White and Surface-Evans2012) analysis of the trail system showed that many trail segments would have been inefficient in terms of travel cost and energy expenditure if used simply to access water. White (Reference White, White and Surface-Evans2012:202) concluded that many trails in the Sierra Pinacate were instead used for ritualized travel:
even in this extremely harsh, unforgiving landscape, sacred concerns—not speed and efficiency—were extremely important motivations for travelers. . . . In fact, the harshness of the environment and the placement of trails far from reliable water may speak to a need to intentionally make sacred travel physically demanding.
The fascinating example of trails illustrates the potential to identify important cultural resources, resource values, and behavioral processes using TRU data that would otherwise be hidden and obscured by data derived from conventional survey approaches. The example highlights recommendations for archaeologists and land managers to transition from site-based research and management paradigm to a landscape-oriented one. TRU data allow examination of the totality of cultural resources across a landscape using a multilayered approach focusing on interrelationships among cultural resources and landscape attributes. By their very nature, trails demonstrate the connectivity of a landscape and represent interrelationships among archaeological sites and other resources. The identification and interpretation of trails can be an integral part of landscape approaches to research and management but only when survey data are recorded and managed at the appropriate scales and can be integrated across projects to reveal regional and supraregional archaeological patterns.
CONCLUSIONS
Although TRU survey can introduce technical challenges in creating and managing pedestrian survey data, advances in geospatial and digital technologies continue to improve the accessibility and cost effectiveness of the method. TRU survey provides a level of standardization, transparency, and reproducibility rarely achieved with conventional site-based survey approaches. At the same time, TRU survey allows sites to be defined for management and legal purposes in a rigorous and precise fashion following explicit site-definition criteria. The effects of ground conditions on discovery and interpretation are easily examined with TRU data, allowing for a more nuanced understanding of archaeological distributions and their research or management implications. Analyzing variation between the results of overlapping survey areas and change through time in surface archaeology characteristics is also readily achievable with TRU data. TRU data provide flexibility and interoperability in examining archaeological and behavioral patterns across projects at multiple scales, unlike pedestrian survey data collected following conventional approaches. Importantly, TRU data enable investigation of interrelationships among resources and landscape characteristics, with or without defining sites as analytical or management units. For this reason, TRU survey can facilitate the transition from site-based to landscape-oriented research and management.
Acknowledgments
The authors would like to thank our current and former colleagues at Statistical Research Inc. and the Arizona Department of Emergency and Military Affairs, especially Shelby Manney, Robert Heckman, Shaun Phillips, and Bradley Vierra. We would also like to thank current Fort Bliss Directorate of Public Works Environmental Division Conservation Branch Archaeologist Fabiola Silva for her assistance with this article, as well as current and former Fort Bliss DPW-ED program members Brian Knight, Belinda Mollard, Sue Sitton, and Martha Yduarte, and current and former Bureau of Land Management Carlsbad Field Office Permian Basin program managers Martin Stein and Elia Perez. Several anonymous reviewers provided insightful comments on drafts of this article for which we are grateful.
Funding Statement
The archaeological survey and analysis discussed in this article was conducted and funded between 2007 and 2017 as part of two five-year IDIQ contracts for cultural resources management services for the US Army Fort Bliss, and as part of an ongoing IDIQ contract for cultural resources management services for the US Bureau of Land Management Carlsbad Field Office's Permian Basin Mitigation Program. Funding for Gold Open Access publication was generously provided by the Arizona Army National Guard.
Data Availability Statement
TRU data presented and discussed in this article can be requested from the Department of Public Works, Environmental Branch, US Army Fort Bliss, Texas; and the US Bureau of Land Management Carlsbad Field Office. Survey data discussed in this article on the utility, reliability, and comparability of TRU data can be found in the Digital Archaeological Record (tDAR) at https://core.tdar.org/project/399783/an-assessment-of-transect-recording-unit-survey-and-subsurface-testing-methods-at-four-sites-in-the-permian-basin-new-mexico.
Competing Interests
The authors declare none.


 Open access