


The number of individuals over 60 years of age worldwide is expected to increase from 900 million to 2 billion between 2015 and 2050(Reference Beard, Officer and Cassels1), with a subsequent increase in the number of people at risk of deteriorating strength and mobility related to muscle loss. Recent estimates indicate that the prevalence of sarcopenia is 5–13 % in individuals 60–70 years of age and 11–50 % in those ≥80 years of age(Reference Chen, Lee and Peng2). Sarcopenia is a syndrome characterised by a progressive and generalised loss of skeletal muscle mass and strength and is associated with an increased risk of falls and fractures, reduced cardiopulmonary function, metabolic syndrome and insulin resistance; accordingly, this condition eventually results in disability, hospitalisation and death among older individuals(Reference Fielding, Vellas and Evans3). Although there are few estimates of the financial burden of sarcopenia in older adults, the healthcare costs of this condition are likely to be high(Reference Beaudart, Rizzoli and Bruyère4). One prospective study estimated that sarcopenia would increase hospitalisation costs by 58·5 and 34 % for patients <65 and ≥65 years of age, respectively(Reference Sousa, Guerra and Fonseca5).
Ageing is probably the most important factor contributing to the loss of muscle mass, although this decline can also be accelerated by modifiable lifestyle factors such as physical inactivity, smoking, alcohol consumption and undernutrition(Reference Cruz-Jentoft, Baeyens and Bauer6). While protein intake has been the main nutritional focus(Reference Rom, Kaisari and Aizenbud7,Reference Isanejad, Mursu and Sirola8) , many older adults do not consume adequate amounts of dietary protein due to reduced energy needs, increased physical dependency, anorexia, changes in food preference, anabolic resistance and increased inflammatory and catabolic conditions(Reference Volpi, Campbell and Dwyer9,Reference Fulgoni10) .
Additionally, obesity has become an epidemic in the elderly(Reference Fakhouri, Ogden and Carroll11), and obese older adults face high risks of age-related muscle wasting, such as sarcopenia(Reference Choi12,Reference Goisser, Kemmler and Porzel13) . In older adults with sarcopenic obesity, sarcopenia and obesity may synergistically increase their effects on physical disability, metabolic disorders, CVD and mortality(Reference Choi12,Reference Stenholm, Alley and Bandinelli14–Reference Rantanen, Harris and Leveille16) . Although the molecular mechanisms that underlie obesity-associated dysfunctions in lipid and glucose metabolism have been studied extensively(Reference Fujioka, Matsuzawa and Tokunaga17), the effects of obesity on the processes that regulate muscle protein metabolism are poorly understood(Reference Nilsson, Dobson and Greene18). Intramuscular lipids act as chemoattractants for macrophages that produce proinflammatory cytokines(Reference Kewalramani, Bilan and Klip19). These cytokines not only directly contribute to the breakdown of muscle proteins(Reference Hayden and Ghosh20) but also interfere with the accretion of contractile material caused by chronic low-intensity muscle overloading(Reference Johnson, Polgar and Weightman21). Previously, Erskine et al. described the paradox that circulating proinflammatory cytokines play different roles in neuromuscular remodelling according to the age and adiposity of the individual(Reference Erskine, Tomlinson and Morse22).
According to the Korea National Statistical Office, the percentage of Korean population aged ≥65 years is expected to rise to 24·5 % by 2030 and to 38·1 % by 2050(23). Along with a rapid growth in the number of elderly individuals in Korea, sarcopenia and sarcopenic obesity have become important issues in this country. In the Korean Sarcopenic Obesity Study that included 526 healthy volunteers 20–88 years of age, the prevalence of sarcopenic obesity in older (≥60 years) men and women was 5·1 and 12·5 %, respectively, as of 2008. However, there have been no Korean cohort studies on the long-term effects of dietary protein on changes in muscle mass according to obesity status.
In the elderly, the maintenance of muscle mass and strength is critical to the abilities of an individual to survive multiple co-morbidities and meet their physical demands. Therefore, we conducted a prospective cohort study of elderly Korean subjects to investigate the effects of protein intake on changes in lean mass according to obesity status.
Materials and methods
Data source and study population
Data were obtained from a large community-based cohort of the Korean Genome and Epidemiology Study (KoGES). The eligibility criteria for the participants of the KoGES at baseline included residents between the ages of 40 and 69 years who had lived in Ansan (urban) or Ansung (rural), Korea, for at least 6 months before enrolment. Baseline examinations were performed in 2001 and 2002, and follow-up examinations continued every 2 years until the end of 2014. Detailed information about the present study has been provided elsewhere(Reference Kim and Han24). Of the original 10 030 participants, 4412 were included in the final analysis after excluding those who did not complete the baseline FFQ or anthropometric data (n 2417), who had abnormally low or high daily energy intakes (<500 or >5000 kcal/d (<2092 or >20 920 kJ/d), n 56), who did not participate in follow-up examinations (n 3042), or who had low skeletal muscle mass (<35·71 % in men, <30·70 % in women)(Reference Kim, Yang and Yoo25) at baseline (n 103). All participants signed the written informed consent form. The present study was approved by the Institutional Review Board (no. KC17ZESI0645) of the Catholic Medical Center.
Assessment of usual dietary protein intake
At baseline, the participants’ usual dietary protein intake was assessed by trained dietitians using a validated 103-item semi-quantitative FFQ(Reference Ahn, Kwon and Shim26). There were nine response options for the frequency of each food (never or almost never, once per month, two or three times per month, one or two times per week, two or three times per week, three or four times per week, five or six times per week, once daily, twice daily, or three times daily) and three response options for the portion size of each food (1/2 serving, 1 serving and ≥2 servings). To enhance the accuracy of recall of serving size, pictures of each food item were used as a reference. The daily intakes of protein and other nutrients by each individual were estimated from the sum of the intakes of each food item, based on the Food Composition Database (Seoul, Korea: The Rural Development Administration, 2007). Among the 103 food items listed on the FFQ, seventy-nine items classified as the main food sources contributing to protein intake (nine food items from meats including beef, pork, poultry and meat products, fifteen food items from fish and shellfish, three food items from soyabeans, four food items from milk, one food item from eggs, seven food items from rice and other cereals, twenty-seven food items from vegetables, ten food items from noodles and breads and three food items from potatoes) were assessed to calculate each subject’s protein intake.
Anthropometric measurements
Fat mass and lean mass (fat-free mass) were assessed using multi-frequency bioelectrical impedance analysis (MF-BIA; InBody 3.0; Biospace) according to standard procedures. The MF-BIA technique assumes that the human body comprises five interconnecting cylinders and measures direct impedance in these body compartments. Using an eight-polar tactile electrode system, impedance was measured at four specific frequencies (550 250 and 500 kHz) in five segments (right arm, left arm, trunk, right leg and left leg) for the estimation of total body water (TBW). The lean mass was estimated from the TBW and anthropometric measurements, using an algorithm for the Asian population. The fat mass was estimated by subtracting the lean mass from the total body weight. The participants fasted overnight prior to BIA assessment. Before the examination, the researchers confirmed whether the participant had experienced intensive exercise, bathing or excessive sweating. BMI was calculated as the weight (kg) divided by the height (m) squared. Although there is no standardised definition of obesity according to fat mass, the participants were categorised into two groups by percentage body fat (%BF) with reference to Asian epidemiological studies (normal group: %BF <25 for men and <30 for women; obese group: %BF ≥25 for men and ≥30 for women)(Reference Cho, Song and Kim27,Reference Kim, Han and Yang28) .
Covariates
All lifestyle-related information was gathered with an interviewer-administered questionnaire. The questionnaire included questions on sex, age, marital status, education, income, smoking, alcohol consumption, regular physical activity and self-perceived dental health status. Smoking status was used to classify participants into ‘smokers’ (current smokers) and ‘non-smokers’ (former smokers and non-smokers). Alcohol consumption was used to classify participants into ‘alcohol drinkers’ (current drinkers) and ‘non-drinkers’ (former and never drinkers). Regular physical activity was defined as ‘yes’ if the participant performed >2·5 h of exercise per week according to the WHO recommendation(Reference Nelson, Rejeski and Blair29,30) . The self-perceived dental health status was categorised as poor or others (good and fair). Chronic diseases were measured by participants’ self-report of the presence or absence of ten chronic conditions (myocardial infarction, congestive heart failure, coronary artery disease, peripheral arterial disease, cerebrovascular disease, asthma, chronic obstructive pulmonary disease, cancer, dementia and arthritis).
Statistical analysis
Because of well-established sex differences in age-related changes in lean mass and muscle strength(Reference Goodpaster, Park and Harris31), all analyses were performed separately for men and women. Protein intake was examined by the protein density method, in which nutrient intake was divided by total energy intake (in g per 1000 kcal (4184 kJ))(Reference Willett, Howe and Kushi32). The protein intake per 1000 kcal (4184 kJ) at baseline was categorised into tertiles. The baseline characteristics of study participants were compared with respect to the tertiles of protein intake per 1000 kcal (4184 kJ), using Mantel–Haenszel χ 2 tests for categorical variables and linear regression analyses for continuous variables. A one-way ANOVA was used to test for between-group differences in percentage change in body composition after a 12-year follow-up, using the lowest tertile as the reference group. Independent Student’s t test was used to examine the differences between older (≥50 years) and younger participants (<50 years) in terms of percentage change in body composition after a 12-year follow-up. Multiple linear regression analyses were performed to determine the relative contributions of evaluated characteristics to the lean mass at baseline. Fat mass (kg), age (<60/≥60 years), protein intake (tertile 1/tertile 2/tertile 3; T1/T2/T3), marital status (married/others), education (≥college/others), income (≥3 000 000 KRW (Korean won) per month/others), smoking (yes/no), alcohol consumption (yes/no), regular physical activity (yes/no), self-perceived dental health status (poor/others) and chronic disease (yes/no) were included as covariates in the model. Variables with P values <0·05 were selected during stepwise regression procedures. The subjects were categorised into normal and obese groups for linear mixed-effects models to examine the independent effect of protein intake on lean mass after 12 years of follow-up. Potential confounding variables were selected using stepwise regression procedures and entered into the models. Model 1 was adjusted for age, income, alcohol consumption, smoking, regular physical activity and chronic disease, and model 2 was adjusted for the variables in model 1 plus fat mass. IBM SPSS Statistics for Windows, version 24.0 (IBM, Corp.), was used for all statistical analyses. A two-sided P value < 0·05 was considered statistically significant.
Results
Table 1 shows the characteristics of study participants according to protein intake at baseline. The protein intakes (g/kg body weight) by tertiles 1, 2 and 3 were 0·8, 1·0, and 1·3 g in men and 0·9, 1·1 and 1·4 g in women, respectively. Both men and women with high protein intakes were significantly younger (P < 0·001), were more likely to live in a city (P < 0·001), had a higher educational level (P < 0·001), earned a higher income (P < 0·001), were married (P = 0·019 for men, < 0·001 for women), consumed alcohol currently (P < 0·001 for men, 0·001 for women), and were physically active (P < 0·001). Smoking status was not significantly associated with protein intake. Additionally, men and women with higher protein intakes had higher intakes of energy (P < 0·001) and energy from fat (P < 0·001) and a lower intake of energy from carbohydrates (P < 0·001). Regarding body composition, men with a high protein intake had higher weight (P < 0·001), BMI (P < 0·001), fat mass (P < 0·001), %BF (P < 0·001) and lean mass (P < 0·001) at baseline, whereas among women, only lean mass differed significantly in relation to protein intake (P = 0·005).
Table 1. Characteristics of study participants by levels of protein intake
(Mean values and standard deviations; percentages)
KRW, Korean won.
* Tertiles of protein intake per 1000 kcal (4184 kJ) at baseline.
† P for trend was calculated from linear regression analysis for continuous variables and Mantel–Haenszel χ 2 for categorical variables.
‡ To convert kcal to kJ, multiply by 4·184.
In men and women with the highest protein intakes, dietary protein was mostly derived from meats (22·9 % in men and 18·4 % in women), while dietary protein was mostly derived from vegetable proteins with rice and other cereals in men and women with the lowest protein intakes (41·8 % in men and 44·1 % in women) (Fig. 1).
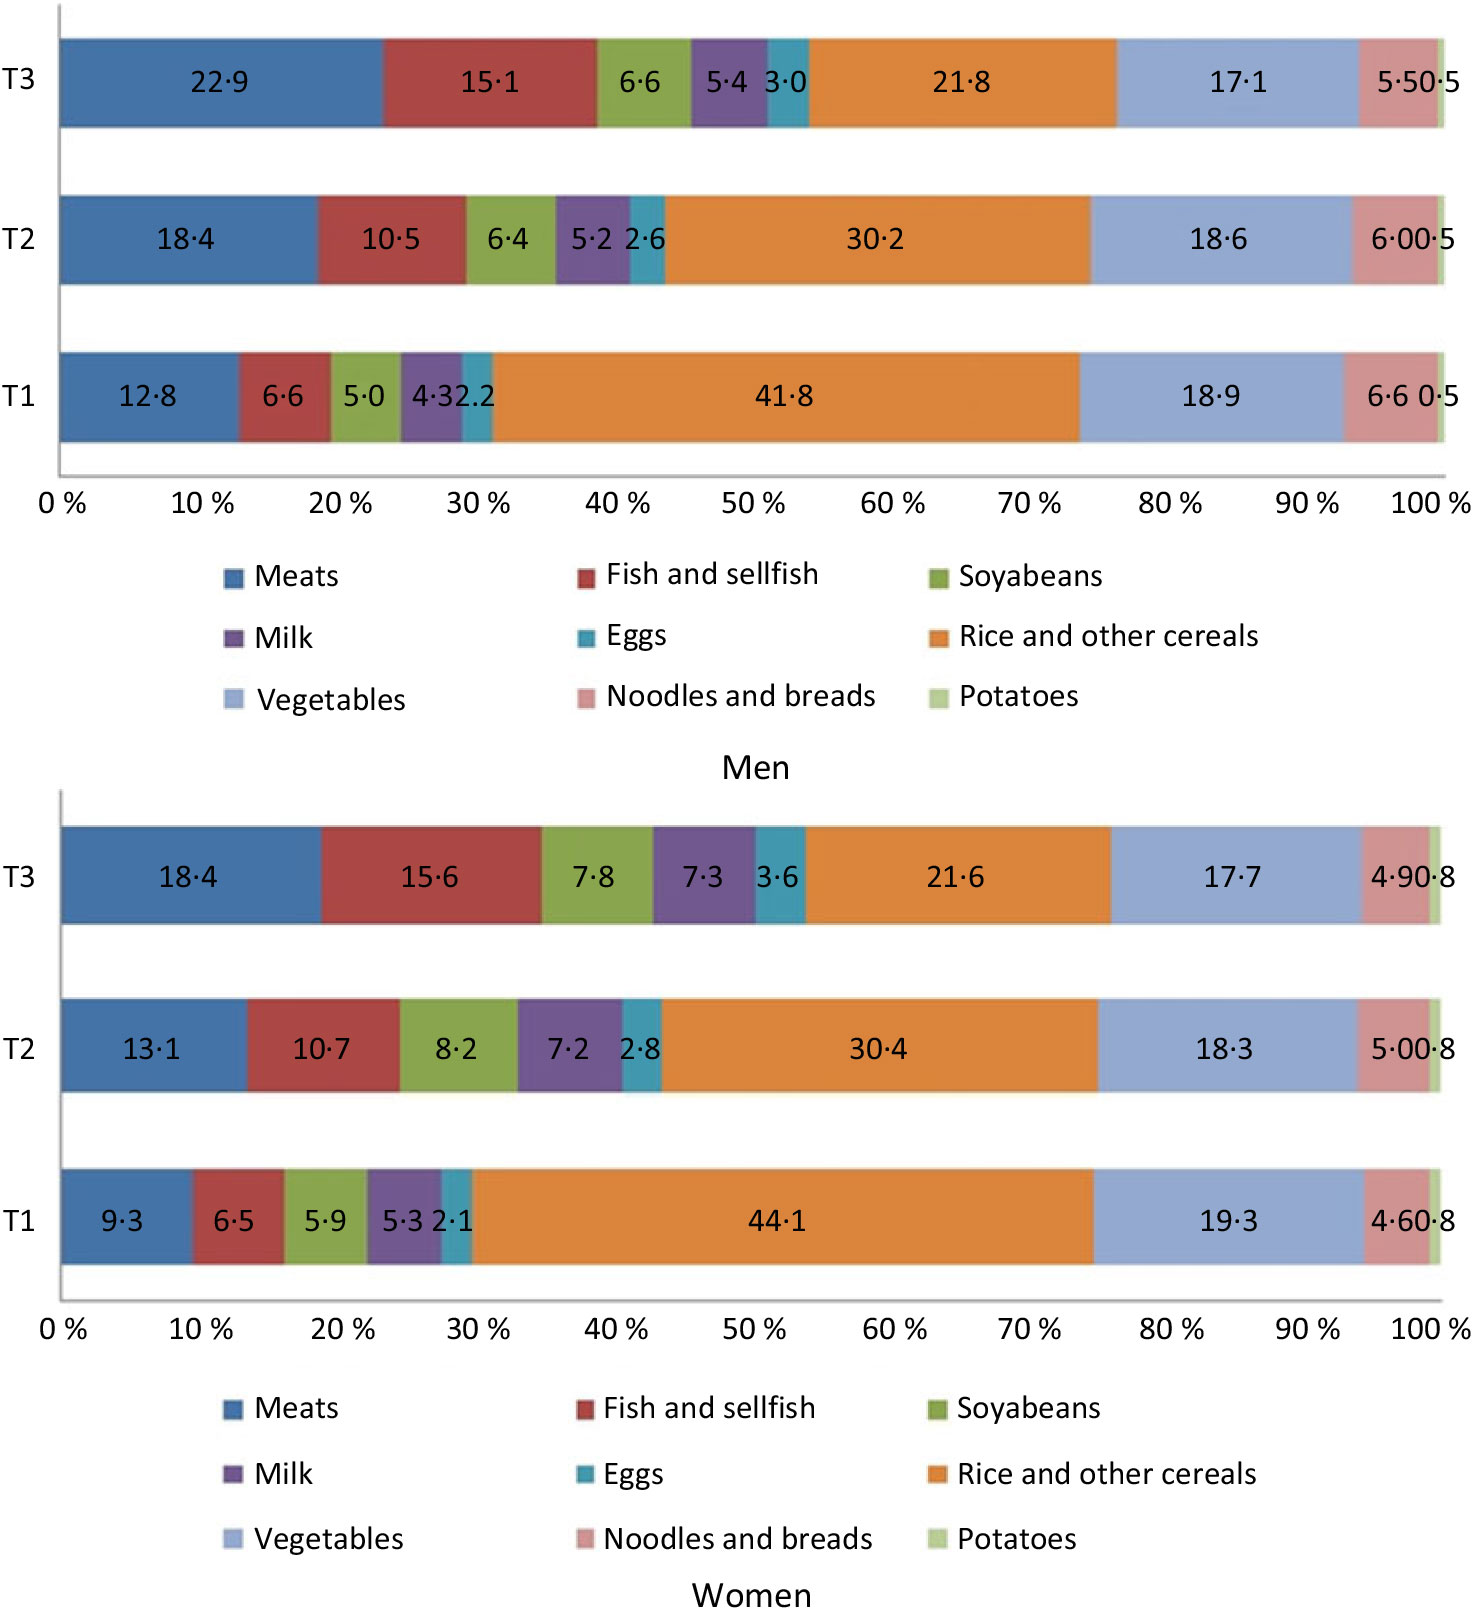
Fig. 1. Contribution of protein source foods to total daily protein intake.
Among men, the percentage change in body composition after 12 years of follow-up did not differ significantly according to protein intake, whereas women with a higher protein intake had lower reductions in weight, BMI and lean mass during the follow-up period (P < 0·001, P = 0·014 and P < 0·001, respectively). Among both men and women, older participants (≥50 years) had a greater reduction in lean mass compared with the younger group (<50 years) (P < 0·001; T1, T2 and T3) (Fig. 2).
Fig. 2. Percentage change in body composition over 12 years by tertiles of protein intake per 1000 kcal (4184 kJ). Percentage change = ((12-year follow-up value – baseline value)/baseline value × 100). Values are means. * Significantly linear trend across tertiles of protein intakes: P for trend < 0·05. Among both men and women, older participants (≥50 years) had a greater reduction in lean mass, compared with the younger group (<50 years) (P < 0·001; T1, T2 and T3) using Student’s t test.
Table 2 shows the results of multiple linear regression models using a stepwise procedure for selecting variables that predicted lean mass at baseline. In men, a higher fat mass (β = 0·59, P < 0·001), younger age (β = 3·75, P < 0·001), regular physical activity (β = 1·07, P < 0·001), higher income (β = 0·83, P = 0·002), current smoking (β = 0·72, P = 0·002), protein intake (β = 0·50, P = 0·039) and the presence of chronic disease (β = −2·25, P = 0·019) were associated with a higher lean mass at baseline. In women, a higher fat mass (β = 0·46, P < 0·001), younger age (β = 2·20, P < 0·001), regular physical activity (β = 0·89, P < 0·001) and alcohol consumption (β = 0·63, P < 0·001) were associated with a higher lean mass at baseline.
Table 2. Predictors of lean mass at baseline
(β-Coefficients with their standard errors; R 2)
KRW, Korean won.
* The variable was not selected during the stepwise procedure due to P > 0·05.
† Predictors were selected by a regression model with stepwise procedure.
‡ Protein intake per 1000 kcal (4184 kJ). Variables initially included in the model were fat mass (kg), age (<60/≥60 years), protein intake (T2, T3), marital status (married/others), education (≥college/others), income (≥3 000 000 KRW per month/others), smoking (yes/no), alcohol consumption (yes/no), regular physical activity (yes/no), self-perceived dental health status (poor/others), chronic diseases (myocardial infarction, congestive heart failure, coronary artery disease, peripheral arterial disease, cerebrovascular disease, asthma, chronic obstructive pulmonary disease, cancer, dementia and arthritis).
In linear mixed-effects models, a higher protein intake at baseline was associated with a higher lean mass after 12 years of follow-up in both men (β = 0·79, P = 0·001; highest v. lowest tertile) and women (β = 0·28, P = 0·082; highest v. lowest tertile) after adjusting for covariates (Table 3). These associations were attenuated after additional adjustment for fat mass at baseline. In further evaluation according to obesity status, the associations were stronger in the normal-weight group (men, β = 0·85, P = 0·002; highest v. lowest tertile; women, β = 0·97, P < 0·001; highest v. lowest tertile) but were not detected in the obese group. Age (men, β = 4·08, P < 0·001; women, β = 2·61, P < 0·001) and regular physical activity (men, β = 0·88, P = 0·054; women, β = 0·76, P < 0·001) were significantly associated with lean mass after 12 years of follow-up, regardless of obesity status. Higher income (men, β = 1·36, P = 0·001; women, β = 0·43, P = 0·046) and alcohol consumption (men, β = 1·16, P = 0·005; women, β = 0·56, P = 0·002) in both obese men and women, and smoking (β = 1·82, P < 0·001) and chronic disease (β = −2·42, P = 0·071) in obese men, were significantly associated with lean mass after 12 years of follow-up.
Table 3. Estimates of lean mass after a 12-year follow-up by protein intake according to obesity status at baseline‡
* P < 0·05, ** P < 0·01, † P < 0·1.
‡ Model 1 was adjusted for age, income, alcohol consumption, smoking, regular physical activity and chronic diseases. Model 2 was adjusted for variables in model 1 plus fat mass.
§ Percentage body fat <25 for men and <30 for women.
‖ Percentage body fat ≥25 for men and ≥30 for women.
¶ Protein intake per 1000 kcal (4184 kJ).
‡‡ Coefficient estimates and standard errors are derived from linear mixed-effects models adjusted for lean mass at baseline.
Discussion
To our knowledge, this is the first large, community-based prospective cohort study in Korea to investigate the associations between protein intake and changes in lean mass according to obesity status in middle-aged individuals. The results showed that men and women with higher protein intakes had a higher lean mass after 12 years of follow-up, but that these differences were attenuated after additional adjustment for fat mass at baseline. The associations were stronger in the normal-weight group but were not detected in the obese group.
Women with a higher protein intake had lower reductions in lean mass during the follow-up period. In a meta-analysis of adult men and women with a mean age of ≥50 years, a higher protein intake (≥25 % of the daily total energy intake or ≥1·0 g/kg per d) was associated with increased lean mass retention and fat mass loss during intentional weight loss(Reference Kim, O’Connor and Sands33). Another cohort study investigated the association between dietary protein and changes in lean mass and appendicular lean mass in older, community-dwelling men and women, and reported that community-dwelling older adults with the highest quintile of protein intake lost approximately 40 % less total lean body mass and appendicular lean mass over 3 years compared with the loss in the group with the lowest quintile of protein intake(Reference Houston, Nicklas and Ding34). Our study showed similar results in women, not in men. In women, a high protein intake was associated with smaller reductions in lean mass, weight and BMI. However, there was no significant association in men between protein intake and changes in body composition. The Quebec longitudinal study on Nutrition as a Determinant of Successful Aging reported a stronger association between protein distribution (standard deviation of g of protein per meal divided by g of total protein) and muscle strength in women than in men (men, β = −0·44, P < 0·05; women, β = −0·68, P < 0·001)(Reference Farsijani, Payette and Morais35). Other studies showed that the associations between diet and grip strength (men, β = 0·18, P = 0·035; women, β = 0·27, P < 0·001)(Reference Robinson, Jameson and Batelaan36) or physical performance (men, β = 0·995, P = 0·383; women, β = 0·985, P = 0·091)(Reference Martin, Aihie Sayer and Jameson37) were stronger in women than in men. Although those studies did not focus on protein intake, the authors noted that women usually had healthier diets with higher micronutrient densities compared with men, which may have affected women’s health outcomes such as grip strength or physical performance. In another study, however, total protein intake was related to lean mass only in men, while the protein distribution was related to lean mass in both sexes but more so in men(Reference Farsijani, Morais and Payette38). Declining muscle mass can be affected by lifestyle factors as well as age-related physiological and systemic changes in the body(Reference Rom, Kaisari and Aizenbud7); therefore, the roles played by various lifestyle factors in age-related changes in body function should be further investigated to clarify sex-specific associations between dietary protein intake and lean mass.
Consistent with the results of previous studies, we observed a positive association between protein intake and lean mass retention, after adjusting for covariates and lean mass at baseline in both men and women. Previous cohort studies of older adults have demonstrated that the quantity of dietary protein intake is the main nutritional factor associated with preserving muscle mass and maintaining physical function(Reference Isanejad, Mursu and Sirola39–Reference Chan, Leung and Woo41). In one of these studies, compared with women in the lowest tertile of protein intake (<66 g/d), those in the highest tertile (>87 g/d) had 5·4–6·0 % higher whole-body and appendicular lean mass(Reference Meng, Zhu and Devine40). A Japanese study also reported that the consumption of seafood, dairy products and protein-rich foods may help older adults to maintain their independence(Reference Yamaguchi, Yamada and Nanri42). There is growing evidence that protein intake levels exceeding the recommended daily allowance may benefit elderly adults by preventing or mitigating sarcopenia(Reference Volpi, Campbell and Dwyer9,Reference Morley, Argiles and Evans43) . A review study also concluded that a protein intake level meeting the nutritional requirements of all healthy individuals does not provide protection from age-related sarcopenia(Reference Wolfe, Miller and Miller44–Reference Landi, Calvani and Tosato46). According to data from the 2008–2012 Korean National Health and Nutrition Examination Survey, 18·8 % of adults ≥60 years and 34·9 % of adults ≥70 years consumed less protein than the estimated average requirements for Koreans (40 g/d for men and 35 g/d for women), indicating that many older Korean adults may have insufficient protein intake(47). Therefore, the effects of dietary protein intake in the attenuation of age-related loss of lean mass among older adults require further investigation.
The results of the present study showed that obesity reduced the muscle preservation effects of dietary protein. Dietary protein intake had a significant effect on lean mass after the 12-year follow-up in the normal-weight group but not in the obesity group. Sarcopenia and obesity share several pathophysiological mechanisms(Reference Choi12) that may synergistically increase the risk of negative health outcomes(Reference Newman, Kupelian and Visser48). Moreover, the rates of physical disabilities(Reference Lee, Kim and Kim15,Reference Baumgartner49) , co-morbidities(Reference Stephen and Janssen50) and mortality(Reference Tian and Xu51,Reference Li, Xia and Zhang52) are higher in sarcopenic obesity than in sarcopenia or obesity alone. A recent cross-sectional study reported that normal-weight women had 14 and 10 % higher muscle quality values (i.e. leg power (W) normalised for lower-body mineral-free lean mass (kg)) compared with overweight and obese women, respectively(Reference Brady, Straight and Schmidt53). Furthermore, fat mass was associated with functional decline and muscle weakness in elderly individuals(Reference Isanejad, Mursu and Sirola39,Reference Himes and Reynolds54,Reference Koster, Patel and Visser55) . In contrast, a recent meta-analysis showed that protein supplementation combined with resistance exercise training effectively prevented age-related muscle mass attenuation and leg strength loss in the elderly, regardless of body weight(Reference Liao, Tsauo and Wu56). However, on the basis of protein supplementation alone, individuals with a mean BMI ≥ 30 kg/m2 did not exhibit a greater change in muscle volume and handgrip strength compared with those with a mean BMI <30 kg/m2. The authors concluded that protein supplementation may not prevent age-related muscle loss in obese elderly. Although little is known about the mechanisms underlying the impact of obesity on lean mass in the elderly, obesity may be accompanied by a state of chronic oxidative stress, which could promote protein breakdown and direct muscle fibres into a catabolic state that ultimately leads to muscle wasting(Reference Bowen, Schuler and Adams57). Moreover, in overweight elderly, ineffective autophagic mechanisms may be associated with insulin resistance due to the inhibition of protein synthesis and accumulation of misfolded proteins, thus contributing to age-related skeletal muscle loss(Reference Potes, de Luxan-Delgado and Rodriguez-Gonzalez58). In our study, protein intake may have had less impact on the prevention of lean mass loss in elderly obese than in elderly adults with normal weight. Further research is needed to fully understand the impact of obesity on lean mass.
Similar to the results reported by previous studies, regular physical activity was positively associated with lean mass retention in both men and women, regardless of obesity status. Recent meta-analyses have reported that exercise interventions may be beneficial in improving muscle strength and physical performance(Reference Liao, Tsauo and Wu56,Reference Cruz-Jentoft, Landi and Schneider59,Reference Beaudart, Dawson and Shaw60) . A prospective cohort study concluded that a higher intake of animal protein foods alone, especially in combination with a physically active lifestyle, was associated with the preservation of muscle mass and functional performance in elderly individuals(Reference Bradlee, Mustafa and Singer61). A randomised controlled trial in elderly Japanese women with sarcopenia demonstrated significant effects of exercise and amino acid supplementation on the enhancement of muscle strength and on the combined variables of muscle mass and walking speed or muscle mass and strength(Reference Kim, Suzuki and Saito62). The lifestyles of obese men and women may, therefore, have an important influence on the retention of lean mass.
The strengths of the present study include its large cohort and long follow-up period, which enabled the investigation of associations between protein intake from habitual diets and lean mass in Korean elderly. However, our study also had several limitations. BIA for assessing muscle mass is a useful non-invasive method in large population-based studies; however, factors such as age, hydration status, food or beverage consumption and exercise intensity may affect the results. To reduce the possibility of measurement errors, the participants were requested to fast before BIA assessment, and their hydration status was monitored carefully. The European Working Group on Sarcopenia in Older People suggested BIA as a portable alternative to dual-energy X-ray absorptiometry(Reference Cruz-Jentoft, Baeyens and Bauer6). Additionally, we assessed dietary protein intake only at baseline and did not determine whether the protein intake of participants had changed over the course of the follow-up period.
Conclusions
Our findings support the current evidence that higher protein intakes are beneficial in preserving lean mass. The associations between dietary protein and increased lean mass were more apparent in the normal-weight group but were not detected in the obese group. Our population-based findings may inform the development of improved healthcare programmes for the Korean elderly, with an aim to preserve muscle mass and maintain functionality. However, further comprehensive investigations of the factors affecting muscle strength, functional status and muscle mass are needed to clarify the dose–response effects of varying weight status in older adults.
Acknowledgements
This research received no specific grant from any funding agency, commercial or not-for-profit sectors.
E. S. performed data analyses and wrote the paper; H. J. and S. K. C. reviewed the manuscript. All authors take primary responsibility for the final content.
The authors have no conflicts of interest associated with the present study.


