


Introduction
There is vast literature investigating the environmental risks of agricultural support policies (e.g., Wu, Mapp, and Bernardo Reference Wu, Mapp and Bernardo1994; Lewandrowski, Tobey, and Cook Reference Lewandrowski, Tobey and Cook1997; Smith and Goodwin Reference Smith and Goodwin2003; Eagle, Rude, and Boxall Reference Eagle, Rude and Boxall2016; Babu, Mavrotasa, and Prasaia Reference Babu, Mavrotasa and Prasaia2018). In the past two decades, the Organization for Economic Co-operation and Development (OECD) countries have enacted agricultural policy reforms to reduce negative environmental impacts (e.g., OECD 2013). Some literature studies have suggested that, on simple economic theory, with all other things being equal, market price support (MPS), output payments (per output unit produced), and input subsidies (e.g., fertilizers, pesticides, water, and energy) are all environmentally harmful, since these provide the greatest incentive to increase commodity production (OECD 2013). The OECD categorized agricultural policies into four categories: potentially most harmful, potentially less harmful, potentially more beneficial, and potentially most beneficial policies. Potentially most harmful supports consist of MPS; payments based on commodity output, without imposing environmental constraints on farming practices; and payments based on variable input use, without imposing environmental constraints on farming practice (OECD 2005, 2013). As quantifying the link between agricultural policies and environmental impact is complicated, and the relationships are site-specific, the impacts were qualified as “potentially.” In reality, the environmental impact should depend on the country, production technology, production system, and trade of agricultural goods.
Therefore, Henderson and Lankoski (Reference Henderson and Lankoski2019, Reference Henderson and Lankoski2020) studied agricultural support policy based on the OECD Producer Support Estimate (PSE), drawing on results from ex-ante modeling frameworks on agricultural policies’ marginal environmental impacts at market and farm levels using European Union (EU) data. The report concluded that MPS and payments based on unconstrained variable input use were the most environmentally harmful, and decoupled support payments based on noncurrent crop area were the least harmful. However, the study indicated that some conditions affect the strength of the relationship between agricultural support measures and their environmental impacts; therefore, “Insights from the analysis are limited to the farming systems and regions considered in the study. The analysis of other farming systems, such as more specialized farms in other OECD countries with different economic and agronomic conditions, could generate different analytical findings” (Henderson and Lankoski Reference Henderson and Lankoski2019, p. 7).
Thus, the impacts of some support measures are not defined (OECD 2017). The direction and magnitude of the impacts of specific agricultural policies on the environment are considered an empirical matter. Ex-ante modeling analyses on the marginal environmental impacts of agricultural policies at farm levels targeting Asian monsoon countries have not been conducted. Therefore, this study focuses on Asian paddy farming, analyzing farm-level data using policy instruments based on OECD PSE categories. In Japan, most agricultural land is located in the Asian monsoonal zone, which is favorable for rice production. The Japanese agricultural landscape results from a long history of human interaction with nature: groundwater recharge and flood prevention are made possible by maintaining paddy fields and irrigation systems. The “Satoyama”Footnote 1 landscape with paddy fields plays a crucial role in providing landscapes and buffer for water flows and contributes to food security (Uetake Reference Uetake2015). Estimating environmental impacts based on paddy field characteristics may differ significantly from those based on field crops and livestock farming. Therefore, farm-level policy simulation is worthwhile for policy-design perspectives from an academic point of view. In Japan, reports on ex-ante policy analysis for policy development and evaluation at the farm level are few except for Sasaki (Reference Sasaki2012), and Uetake and Sasaki (Reference Uetake and Sasaki2014). The model used in this study quantifies how the following policy measures influence agricultural production practices and environmental effects: nitrogen (N) runoff, greenhouse gas (GHG) emissions, and biodiversity in paddy fields. For the first time, this study looks at an ex-ante quantitative assessment of agricultural policy impacts on biodiversity in paddy fields. Specific land-use patterns in Japan can influence a policy's environmental impact, especially rice paddies that dominate agricultural land use (54.4 percent of Japan's cultivated land in 2018). The characteristics of rice paddies should be considered when examining environmental impacts. Rice paddies are artificial wetlands that supply people with several types of noncommodity outputs.
At the farm level, positive and negative environmental impacts of agricultural policies occur in several pathways. In general, agricultural policies' potential environmental effects are explored by analyzing policy impacts on the following: (1) crop production's intensive margin (e.g., the selection of inputs and the intensity), (2) crop production's extensive margin (e.g., the allocation of land between different crops or different production technologies), and (3) the entry-exit margin for crop production (e.g., land allocation between cultivated cropland and other uses). Policies that incentivize an increase in production on the intensive margin can have negative environmental impacts. However, determining the impact on the (3) entry-exit margin offers a challenge when the paddy's multifunctional roles, such as seminatural habitat and artificial wetland, are considered. For example, unlike other crop fields, leaving cultivation and an abandoned paddy field might negatively affect biodiversity since well-maintained paddy fields themselves provide biodiversity. Therefore, the final criteria should consider various regional situations.
The study provided several key findings. As a result of the simulation, MPS’ effect is complex and not straightforward. Under the specific parameter setting in this analysis where typical Japanese paddy farms have been studied, MPS does not necessarily increase nitrogen runoff or total GHG emissions, unlike the findings in the European livestock and upland farming case in Henderson and Lankoski (Reference Henderson and Lankoski2019). Also, all types of agri-environmental payments achieved greater environmental benefits. Currently, agri-environmental payments cover only 2 percent of Japan's cultivated area, and the share of the payments with voluntary agri-environmental constraints in producer support is quite low. Thus, there is potential to rebuild the Japanese farm support policy, which currently does not have environmental requirements.
The outline of this article is as follows. A theoretical framework is presented in the next section, followed by empirical specifications, where a new formula for biodiversity in paddy fields is outlined. Then follows the policy simulations section where agricultural policies based on the PSE category are reported. Sensitivity analyses are also conducted to check the robustness of key conclusions. Finally, concluding remarks are presented.
Theoretical framework
Land-use allocation
In general, policy analyses at the farm level can be grouped into mathematical programming (i.e., linear/nonlinear programming), econometric, and advanced programming techniques. This article uses the mathematical programming approach. This type of approach has several advantages that justify its recent increased use. For example, the approach allows the explicit representation of behavior that facilitates interdisciplinary research on agri-environmental interactions and agricultural systems’ environmental assessment (Ciaian et al. Reference Ciaian, Espinosa, Gomez y Paloma, Heckelei, Langrell, Louhichi, Sckokai, Thomas and Vard2013).
Following the modeling exercise of paddy farming in Sasaki (Reference Sasaki2012), land is divided into rectangular fields that are uniform in size and homogeneous in land quality (productivity: q) but heterogeneous between fields, an idea originally proposed by Lichtenberg (Reference Lichtenberg1989, Reference Lichtenberg, Gardner and Rausser2002). Each field is an assumed 0.1 ha, and the total surface area of cultivated land is 6 ha (60 fields). Japanese national statistics data on a 5–7 ha farm size are used in this study to estimate the profit function assuming a full-time commercial farmer. The structural transformation of Japanese agriculture toward more productive, profitable, and larger-scale farms has been a major policy goal. The area covered by farmers with more than 5 ha of farmland has been increasing in recent years, accounting for more than 60 percent in some regions.
In this study, the land-use allocation is assumed to include rice paddies, upland crops, and abandoned land (Figure 1). It is assumed that rice paddy is cultivated on the low q (productivity, drainage ability) land, and soy and wheat are cultivated on high q land. Most of Japan's land have been paddy fields, and the government is promoting shifting cultivation, such that the land with good “drainage conditions” and high productivity is now converted to wheat and soy cultivation. Compared with rice, the profit margins of soybeans and wheat are quite low.
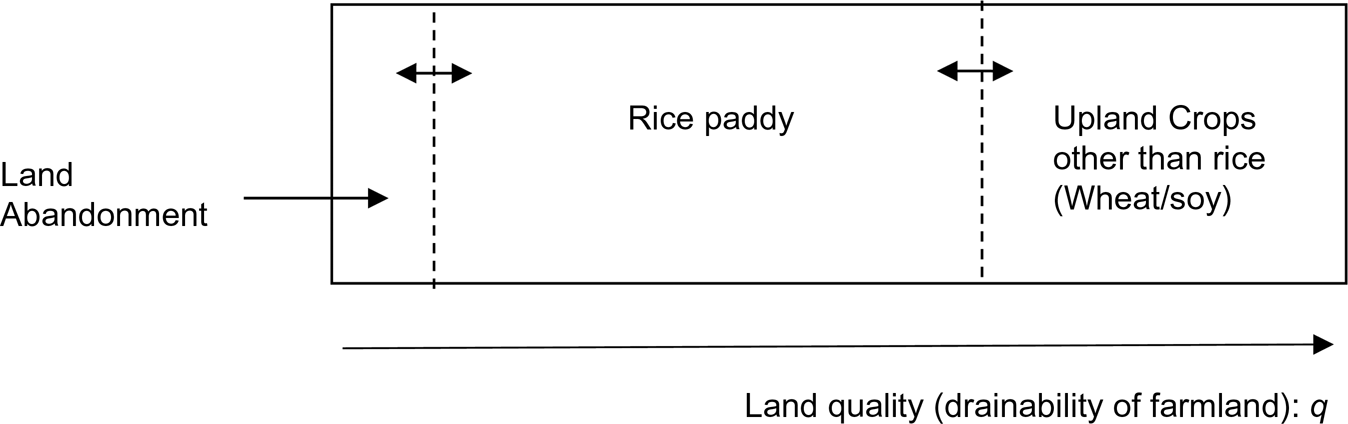
Figure 1. Spatial Characteristics Assumed in the Model. The Land-Use Allocation Assumed to Include Rice Paddies, Upland Crops, and Abandoned Land.
There is some trade-off between paddy fields and upland crops in terms of environmental externalities. For example, although methane emissions from upland fields amount to zero, N2O emissions are higher (Nishimura et al. Reference Nishimura, Sawamoto, Akiya, Sudo and Yagi2004). Consequently, it is beneficial to analyze rice paddy and the upland crop cultivation in a continuous analytical framework by formulating their main characteristics from both economic and environmental perspectives. It is assumed that land reforms in paddy fields (drainage canal and subsurface drainage) have already been initiated; this implies that a farmer may allocate land based only on the profit generated from each field; therefore, it is not necessary to incorporate “the land conversion cost” exogenously (OECD 2010).
Lichtenberg (Reference Lichtenberg1989, Reference Lichtenberg, Gardner and Rausser2002), Lankoski and Ollikainen (Reference Lankoski and Ollikainen2003), Lankoski, Lichtenberg, and Ollikainen (Reference Lankoski, Lichtenberg and Ollikainen2004), Lankoski, Ollikainen, and Uusitalo (Reference Lankoski, Ollikainen and Uusitalo2006), and developed a framework for analyzing the joint production of commodity and environmental outputs as well as negative externalities under heterogeneous land quality, which provides the foundation for the modeling in this study. Details of the theoretical framework are explained in the Annex.
Empirical specification
The following empirical specification section is based on Sasaki (Reference Sasaki2012), but the profit function and nitrogen response function are revised using the most recent available data. The nitrogen response function of soy and the relationship between chemical fertilizer application and biodiversity are newly introduced in this study.
Profit functions
Farmers’ profits from production in the absence of government intervention are:

where p
i
refers to crops’ price, y
i
to the yield/10a, c to the fertilizer (nitrogen) price, w
i
to wage rate per hour, ni
to labor input, and o
i
to other costs. The model employs a quadratic nitrogen response function,
$y_i = a_i + {\rm \alpha }_ix_i + {\rm \beta }_ix_i^2$
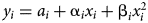 , where x
i
refers to the amount of N application (kg/10a) estimated for crop 1 (rice), crop 2 (wheat), and crop 3 (soy). When farmers consider the use of organic fertilizer application x
oi
in addition to (or partially converting) chemical N fertilizer x
ci
, the total amount of N application to the agricultural field is the summation of N fertilizer and N content of organic matter. Despite the recommended organic matter application amount (e.g., 1.0–1.5 t/10a for paddy fields in Japan), the implementation is inactive due to the following barriers: difficulties in realizing the manure application effects from the farmers’ viewpoint due to the diverseness of manure quality; a huge amount of the application is needed compared with the chemical one (high spreading cost); a lack of cooperation among crop and livestock farming (high transportation costs).
, where x
i
refers to the amount of N application (kg/10a) estimated for crop 1 (rice), crop 2 (wheat), and crop 3 (soy). When farmers consider the use of organic fertilizer application x
oi
in addition to (or partially converting) chemical N fertilizer x
ci
, the total amount of N application to the agricultural field is the summation of N fertilizer and N content of organic matter. Despite the recommended organic matter application amount (e.g., 1.0–1.5 t/10a for paddy fields in Japan), the implementation is inactive due to the following barriers: difficulties in realizing the manure application effects from the farmers’ viewpoint due to the diverseness of manure quality; a huge amount of the application is needed compared with the chemical one (high spreading cost); a lack of cooperation among crop and livestock farming (high transportation costs).
The average N content in organic fertilizer (cow manure) is set at 0.7 percent based on Sasaki (Reference Sasaki2012), and then the total amount of N application is expressed as:

where 1,000 represents the conversion of the unit from tonne to kg.
Generally, N requirement * substitution rate (%) = the amount of organic fertilizer (kg/10a) * N content rate (%) * Fertilizer efficiency (%), where fertilizer efficiency is 30 percent.
Suppose that the positive effect for yield is expressed as Φ i (x oi ) and that of paddy is approximately 105 percent and that of wheat and soy 110 percent under the 1 t application, based on the several field survey data. The profits function is expressed as follows taking into consideration the additional cost for organic matter application:

where c op refers to the price of organic matter (JPY/tonne), c ot to transportation cost (JPY/tonne), and c os to the spreading cost (JPY/tonne).
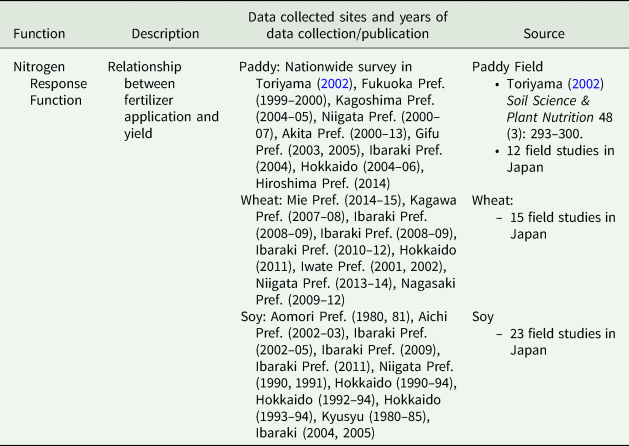
The quadratic nitrogen response function of rice paddy was estimated using data from over 50 sample field surveys, which were collected by Toriyama (Reference Toriyama2002), and recently collected field experiment data in 12 field studies from the 1990s to 2010s:

Even without fertilizer, nutrition in irrigation water affects yield. It is generally said that the yield without fertilizer decreases only by 1/5 due to the paddy's high fertility. To reflect actual yield in paddy fields, ai is given as a fixed value to exclude the effect of irrigation water, and then the land quality q is incorporated into the response function. The response function is expressed as:

Following the above field data, the yield spread is about 30 percent under the average N application amount. Thus, each of the parameters is obtained. Also, a positive yield effect Φ i (x oi ) of applying manure plays a significant role because the pros of manure application for farmers are expressed only by this positive yield effect in the model. In the model, a positive relationship between manure application and yield effect is expressed as quadratic equations based on field survey data (e.g., Shibahara et al. Reference Shibahara, Takehisa, Komatsu and Habe1999; NARO 2007). Then, Φ i (x oi ) is now expressed for rice paddy and wheat (=soy) as follows:


The quadratic nitrogen response function of wheat (converted from rice paddy cultivation) was estimated using the National Agricultural Centre data sets (1989) and recently collected field experiment data of 14 field studies in Japan from the 2000s to 2010s:

The wheat response function to nitrogen is expressed as:

Since the yield spread is about 30 percent under the average N application amount, each parameter is obtained. In general, wheat yield is more responsive than paddy rice to nitrogen applications.
Soy's quadratic nitrogen response function is also estimated as follows based on data of 23 field studies in Japan from the 1980s to 2010s:

The soy response function to nitrogen is expressed as:

The spread using the average N application amount was assumed, and then each of the parameters was estimated to reflect the actual plotted yield data.
The parameters for the profit function are summarized in Table 1, and data sources used for the nitrogen response function are outlined in Table 2.
Table 1. Parameter values in the profit function
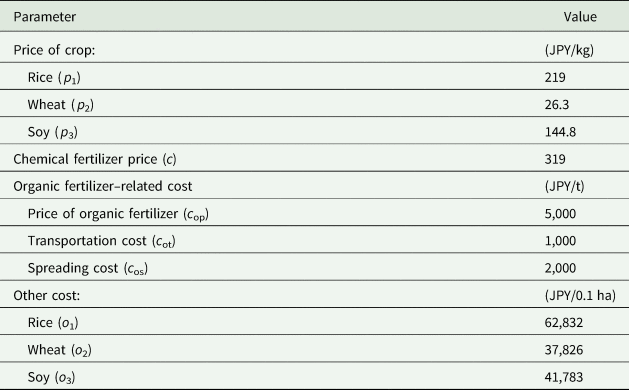
Source: 2016 MAFF stat.
Parameters to estimate the profit function, following OECD's (2010) and Sasaki (Reference Sasaki2012)'s specification.
Table 2. Data sources of the nitrogen response function
Nitrogen response function
It is difficult to formulate the relationship between N application and its impact by the easy-to-use way because N runoff from irrigation and meteoric water might affect the N balance in paddy fields. Generally, N runoff from paddy is explained as follows: [N runoff (surface runoff + subsurface flow)] = [The effect of irrigation water-load] + [The effect of meteoric water-load] + [The effect of N application]. We tried to estimate the relationship between N application and runoff by an exponential form (e.g., Tabuchi and Takamura Reference Tabuchi and Takamura1985, p. 70):

where z i refers to the amount of N runoff (surface and subsurface) and x i is the amount of N application.
Paddy fields could be N removal sites or pollution sites depending on agricultural activities and irrigation water nitrogen concentration. It is well known that paddy fields and wetlands effectively improve water quality by removing nitrogen due to denitrification and absorption, which is effective only when irrigation water is highly concentrated.
Although the nitrogen movement in paddy is not simple, the relationship was estimated in Sasaki (Reference Sasaki2012) using available field survey data in Kunimatsu and Muraoka (Reference Kunimatsu and Muraoka1989). An exponential relation was found between the amount of N application and runoff.

In a precise sense, soil condition, crops, cropping season, and methodological condition could affect N runoff. Nevertheless, approximately 30 percent of applied N could runoff as the average in the Japanese condition. However, a linear function is not appropriate for optimization. Consequently, the exponential form was estimated based on Japanese field data, which were worked out by the National Institute for Agro-Environmental Science (NIAES), and the function was revised using new data as follows:

where z 2 refers to the amount of N runoff and x 2 to the N application.
Due to the lack of observation and data, R2 is not sufficiently high. The linear functions and general nitrogen runoff ratio were compared in to verify the robustness of the estimated exponential curve. There is consistency with the other estimation results under the average amount of N application, such as lower than 20 kg/10a.
GHG (CH4, N2O) emission and carbon sequestration function
Agriculture does not account for a high percentage of the total GHG emissions in Japan,Footnote 2 although agriculture is an important anthropogenic source of CH4 and N2O emissions. GHG emissions from agricultural land (IPCC's 4C category rice cultivation and 4D category agricultural soils) derived from chemical and organic fertilizer applications account for approximately 80 percent of total emissions. In this analysis, therefore, fertilizer application amounts could be considered as control variables. Rice cultivation is a main anthropogenic source of CH4 (methane) emissions. Fertilizer application and plowing of organic soil cause ammonium ions in the soil, and then N2O is emitted. N2O is also emitted via denitrification.
Since the amount of fertilizer application is the control variable in the profit function (nitrogen response function), it is possible to incorporate the CH4, N2O, and carbon sequestration function into the model; then, the net GHG emission (CO2 equivalent) is explained by using the following equationFootnote 3 :

It is a fact that rice cultivation is a primary anthropogenic source of CH4 emissions. Sasaki (Reference Sasaki2012) estimated the CH4 emission (t CH4/0.1 ha/year) equation based on IPCC guidelines as follows:

Conversely, methane is not generated in other uplands because upland soils are normally oxidative and aerobic.
The fertilizer application and plowing of organic soil cause ammonium ions inside the soil. Then, N2O is emitted in the process of oxidizing the ammonium ions into nitrate-nitrogen under aerobic conditions. Also, N2O is emitted via denitrification. Sasaki (Reference Sasaki2012) estimated the N2O emissions associated with fertilizer application as

where N2Odirect_i refers to direct N2O emissions derived from fertilizer application in land use i (t N2O), 1/1,000 means the conversion of the unit from kg to tonne, EFdi to emission factors (kgN2O-N/kgN) (for paddy: 0.0031 and upland crop: 0.0062), xi to the amount of N application (kgN), and 44/28 means the conversion of N2O-N emission to N2O emission.
When E adi is N2O emissions associated with atmospheric deposition (kgN2O) and E li is emissions associated with nitrogen leaching and runoff (kgN2O), indirect emission N2Oindirect_i is expressed as follows:

Sasaki (Reference Sasaki2012) estimated emissions from atmospheric deposition as

where E adi refers to N2O emissions from atmospheric deposition, 1/1,000 means the conversion of the unit from kg to tonne, 0.01 refers to emission factors (kgN2O-N/kgN), RF is the rate of deposition from fertilizer (for chemical fertilizer: 0.1 and for organic fertilizer: 0.2), and xi refers to the amount of nitrogen application.
Emissions from nitrogen leaching and runoff (E li) are defined by Sasaki (Reference Sasaki2012) as

where 1/1,000 means converting the unit from kg to tonne, 0.0124 is the emission factor from nitrogen leaching and runoff (kgN2O-N/kgN), and Zi refers to the runoff amount (kgN).
In addition to CH4 and N2O emissions, agriculture could significantly reduce the risk of climate change by taking carbon out of the atmosphere and storing it in the soil.Footnote 4 Japan has country-specific continuous survey data undertaken in 52 areas for paddy and 26 areas for upland crops. Soil samples are taken from the top surface up to 30 cm depth, and the amount of soil carbon is measured at the field level. Gray lowland soil and Gley soils for paddy and Andosols for upland crop data, the dominant soil types in Japan, are used in this study to reduce the uncertainty (of measurement depending on soil type).
The overall average data reveal that organic matter applications increase the amount of carbon sequestration: 1 t/10a manure application cause 40.6–77.4 kgC/10a sequestration in paddy fields, and 1.5 t/10a manure results in 37.3–170.9 kgC/10 sequestration in uplands. The amounts of carbon sequestration via organic matter application differ among soil types. These soil types are some of the representative soils widely found in Japan. Also, the use of the dominant soil type could permit extrapolation to a more spatially aggregate level.
The amount of carbon sequestration is expressed as follows:
Regarding specification of function form, since there is an upper bound for carbon sequestration capacity, polynomial functions are estimated using data from the MAFF, which include the amount of application per year and the increased amount of soil carbon in each soil type. Then, carbon sequestration is estimated for paddy and upland fields, respectively.


Biodiversity
This study examined the relationship between chemical fertilizer usage and biodiversity using empirical evidence from Japanese biologists’ field surveys. Katayama et al. (Reference Katayama, Osada, Mashiko, Baba, Tanaka, Kusumoto, Okubo, Ikeda and Natuhara2019) indicated a negative relationship between production intensity (conventional, environmentally friendly practice, and organic farming) and paddy fields’ many types of flora and fauna. Based on their study, the following relationship is derived when BD, defined using the Native Plants Species Richness Index for paddy fields, gives organic farming paddy fields a score of 100. Native plants data were used in this study because they are most heavily affected by farming practices.

In addition, Koshida and Katayama (Reference Koshida and Katayama2018) found that rice-field abandonment's effect on biodiversity was negative overall in a first comprehensive meta-analysis in Japan. Species richness decreased 56–72 percent after abandonment. This reduction is unlikely to recover and continues for plant species richness even 10–15 years further on from abandonment. These results suggest that rewilding (land renewal) may not be achieved by rice-field abandonment. The Native Plant Species Richness Index value of the abandoned area is expressed by using data recalculated from Koshida and Katayama (Reference Koshida and Katayama2018)Footnote 5 as:

where BDconventional is 75.64, using the average chemical fertilizer application of conventional farming (Katayama et al. Reference Katayama, Osada, Mashiko, Baba, Tanaka, Kusumoto, Okubo, Ikeda and Natuhara2019).
The Native Plants Richness Index calculation for paddy fields is based on equations (24) and (25) (Figure 2). The summated biodiversity value BD in the baseline is normalized as 1 for easy comparison with the results of each simulation.

While surrounding environments might affect species richness in general, it is assumed that other arable lands and paddy fields do not usually affect each other's biodiversity. As the study considers a relatively large farm with a plain field, land-use diversity is not considered.
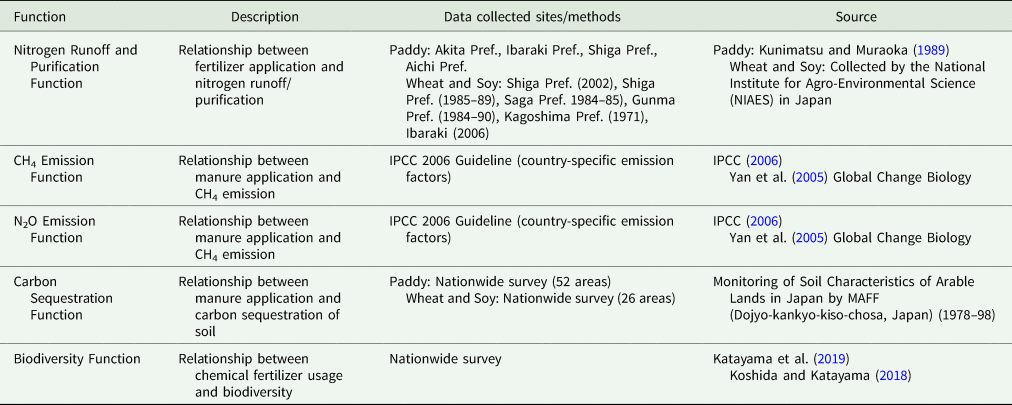
Data sources, data collection sites, and methods for the environmental impact estimation are summarized in Table 3.
Table 3. Data sources of the environmental impact estimation
Policy simulations and results
Agricultural support policies
The study uses a benchmark scenario excluding the policy called “Baseline (market solution)” to compare the performance of individual policy instruments. Each support policy simulates payment increases or MPS equivalents by 10 percent of the value of each commodity and simultaneously applies these to the following commodities. Following this revenue-oriented rule, for example, MPS represents the price increase of rice, wheat, and soy by 5.5, 27, and 13 percent, respectively, to achieve a 10 percent revenue increase accounting for fertilizer application/yield changes before and after policy shocks. This MPS setting will encourage rice paddy's cultivation due to the high profitability. Prices in the mathematical programming model are given, and they change in scenarios; then changes in acreage/production will not impact prices. So, there are no indirect effects on policy scenario runs.
The individual policy instruments analyzed are:
-
• market price support (MPS),
-
• payment based on variable input (nitrogen fertilizer subsidy),
-
• payment based on the noncurrent area (decouple payment),
-
• agri-environmental payment for complying with fertilizer application constraint (50 percent) plus organic fertilizer (manure) application,
-
• agri-environmental payment for complying with fertilizer application constraint (100 percent),
-
• agri-environmental payment for complying with fertilizer application constraint (50 percent) plus cover crop (hairy vetch for paddy field, rye for arable land, and rotary tilling).
This revenue-oriented rule does not apply to “Payment based on variable input (nitrogen fertilizer subsidy)” since the nitrogen fertilizer price is low and does not significantly impact the profit function. The chemical fertilizer price reduction was technically unable to produce a 10 percent increase in revenue, so a 20 percent reduction of the chemical fertilizer price per kg is introduced as a reference. Details of these scenarios and parameter changes are summarized in Table 4.
Table 4. Details of policy scenarios
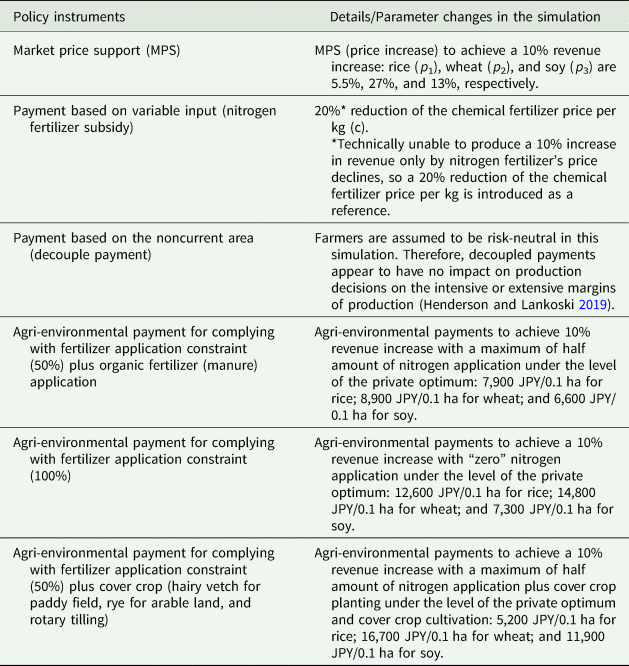
The baseline scenario specifies that rice paddy receives 75,000 JPY/0.1 ha, wheat receives 82,000 JPY/0.1 ha, and soy receives 62,000 JPY/0.1 ha as area payment. This subsidy is consistent with the Japanese government's introduction of a subsidy for arable crops to ensure competitive incomes with rice paddy. Also, this subsidy was designed to incentivize crop diversification so that farmers would shift from rice production to other crops (e.g., wheat and soybean), but the payment is assumed to depend on the production type, not on the production level. This direct payment for rice paddy was abolished in 2018. However, data in the profit function were extracted from 2016 national statistical data, so direct payment for rice paddy remains in the model.
Results of policy simulation
Profit-maximizing choices for alternative agricultural policies per field are aggregated across heterogeneous 60 fields to analyze regional-level implications for production, profits, and environmental effects. The environmental effects of agricultural policies are explored in two methods: (1) crop production's intensive margin and (2) crop production's extensive margin. In general, policies that incentivize an increase in production on the intensive margin have a negative environmental impact. However, determining the impact on the entry-exit margin is complicated depending on the baseline of environmental effects.Footnote 6
Table 5 outlines the impact of policies on land-use allocation, the amount of fertilizer application per 0.1 ha, and the total nitrogen input. In all policy simulations, abandonment of cultivation does not occur because of the introduction of area payment as a baseline. When looking at the causes of agricultural land abandonment in Japan, low profit is not always critical, but socioeconomic drivers (decline and aging of the rural population) are dominant (MAFF-Japan 2013).Footnote 7
Table 5. Land allocation and the amount of fertilizer application
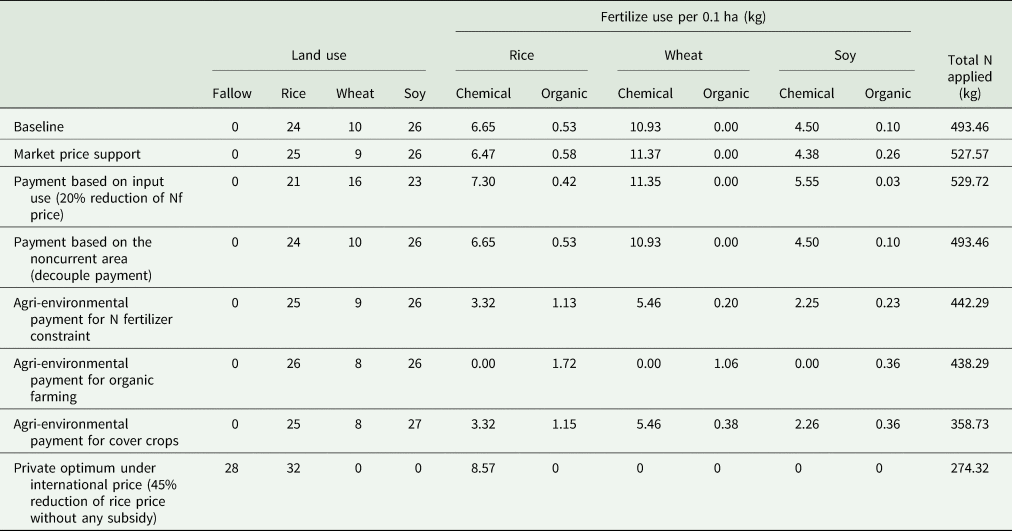
MPS and payments based on the input used consistently increase the total nitrogen input. However, MPS increases organic fertilizer (e.g., matured compost) over chemical fertilizer in rice paddy and soy. All types of agri-environmental payments to comply with the fertilizer application constraint decrease nitrogen's optimal level. Payments based on the noncurrent area (decoupled area payment) have no impact on production decisions.
Optionally, to analyze the entry-exit margin, the additional hypothetical scenario, “elimination of baseline payment and application of international price,” is added, where baseline payments are abolished, and the rice price is cut by 45 percent by aligning it to the international rice price (e.g., price of Californian japonica rice). Under this scenario, land allocation, fertilizer application, and total N input are obtained. However, this scenario is not realistic. It could be considered a reference, not a baseline, since high-value-added Japonica rice does not compete with other rice types in Japan.
Table 6 presents the environmental impacts of different policy instruments. This study conceptually supposes an occurrence of fallow/abandoned land in low-quality lands, but the simulation results do not indicate that profit per field is negative. Therefore, cultivation continues in all fields, as this study uses a large and profitable farm with the consideration of a basic decoupled subsidy. Land abandonment may occur if a small farm in mountainous regions is studied.
Table 6. Environmental impact of policy instruments
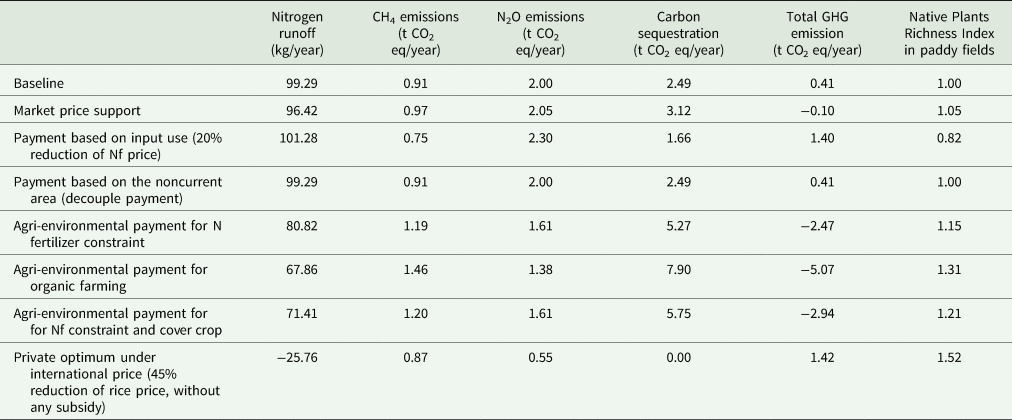
The effect of MPS is mixed. Under the parameter setting in this analysis, where large farms are considered, MPS does not necessarily increase nitrogen runoff and total GHG emissions. A higher profit derived from higher product prices allows farmers to use more organic fertilizers, which, while costly, has a positive effect on the yield by maintaining good soil conditions. Increased revenue could cover additional input, transport, and spread of manure costs. The cost for applying organic fertilizer (manure) is calculated at 8,000 JPY/0.1 ha (fertilizer 5,000 JPY, transportation 1,000 JPY, and spread 2,000 JPY) based on MAFF (Ministry of Agriculture, Forestry and Fisheries) Japan survey data. Productivity increase is a positive aspect of organic fertilizer. In the baseline scenario, a small amount of organic fertilizer is applied, but the increased revenue due to MPS (an increase of product price) could cover a certain percentage of additional input, transport, and spread of manure costs even though the total nitrogen application increases. For wheat, since the nitrogen response function is relatively steep, the farmer chooses a less expensive chemical fertilizer to achieve high yield and revenue.
Due to the partial transition of chemical fertilizer to organic fertilizer, nitrogen runoff decreases slightly, CH4 and N2O emissions increase, but carbon sequestration increases due to manure application. The Native Plant Species Richness Index increases slightly; the index is normalized at one under the Baseline Scenario.
Scenario for Payment based on input use consistently increases nitrogen and GHG emissions and decreases the Native Plant Species Richness Index value, while scenarios for agri-environmental payment with fertilizer application constraints constantly improve them.
Among the three types of agri-environmental payments, payment for organic farming [complying with fertilizer application constraint (100 percent)] achieves the greatest environmental benefit. As a cover crop, hairy vetch for paddy fields, rye for arable land, and rotary tilling data are used. The effect of the cover crop and management of GHG emissions is an increase in carbon sequestration: 0.528 CO2t/year (hairy vetch), 0.800 CO2t/year (rye), and an increase of N2O emissions; 0.272 CO2t/year (hairy vetch); and 0.233 CO2t/year (rye). The hairy vetch and rye were plowed in as green manure, reducing chemical fertilizer use (Komatsuzaki Reference Komatsuzaki2011). These relationships are incorporated into the model. As a result, a greater environmental effect is achieved by complying with the nitrogen fertilizer constraint compared with standard agri-environmental payment.
Sensitivity analysis
To test the results’ robustness, we conducted sensitivity analyses for private optimum and MPS for organic fertilizer's positive effect on yield, chemical fertilizer price, and organic fertilizer cost by ±10 percent.
Sensitivity analyses were conducted to test the credibility and robustness for different assumptions and compare the baseline and MPS scenarios. It is difficult to test all parameters and combinations, so key parameters to determine chemical fertilizer and organic fertilizer application were assessed. The nitrogen application level and chemical/organic fertilizer combination are the fundamental drivers of net positive environmental outcomes in the model. Using Pannell's (Reference Pannell1997) and OECD's (2010) approach, we estimated the 10 percent shocks in chemical fertilizer prices, the organic fertilizer–related costs (collection, transportation, and spread), and the yield effect of organic fertilizer in the baseline and MPS scenarios. The results are presented in Table 7.
Table 7. Sensitivity analyses: ±10 percent shocks to chemical and organic fertilizer prices, and organic fertilizer's positive yield effect on productivity
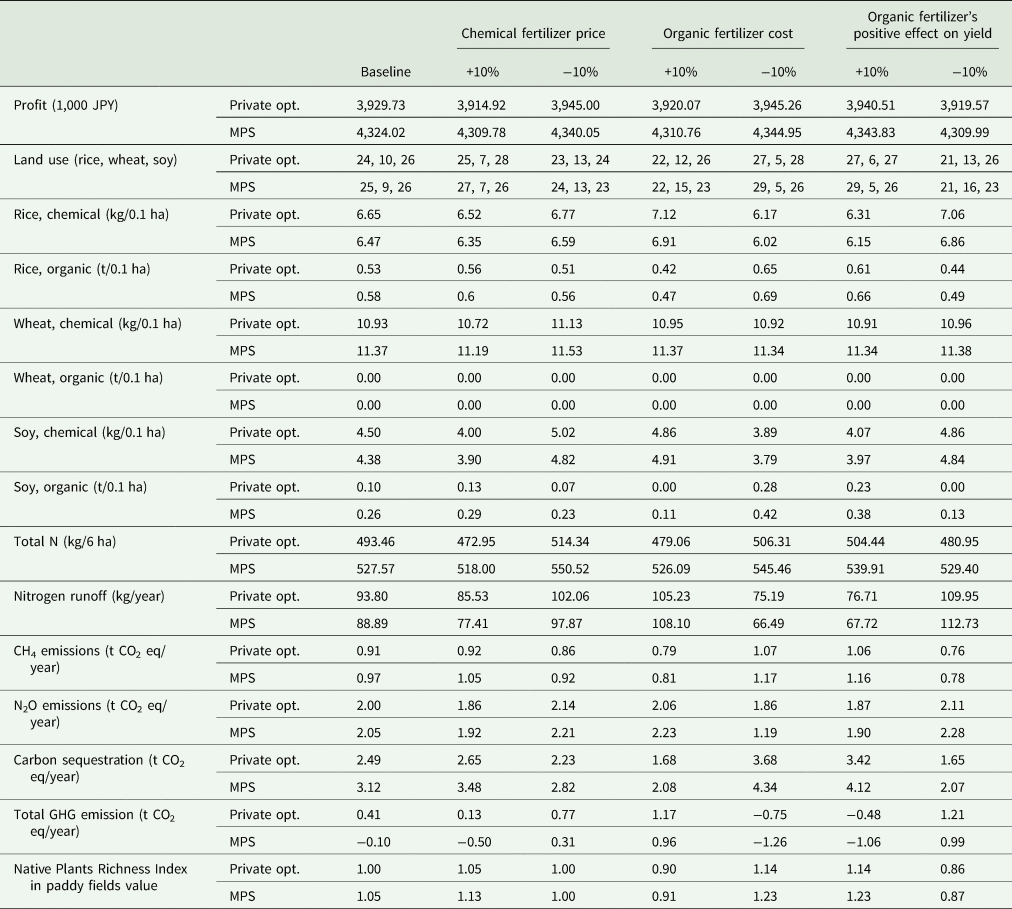
Using Pannell's (Reference Pannell1997) and OECD's (2010) approach, we estimated the 10 percent shocks in chemical fertilizer prices, the organic fertilizer-related costs (collection, transportation, and spread), and the yield effect of organic fertilizer in the baseline and MPS scenarios.
The fertilizer price −10 percent shock indicates that nitrogen runoff becomes relatively intensive. Per 0.1 ha, nitrogen runoff for the crop has little effect on activity; the changes reflect shifting the land use to wheat. The functional form used for modeling nitrogen response implies low price elasticity. Under the MPS scenario, which is the same as the original scenario, the partial transition of chemical fertilizer to organic fertilizer has occurred, and nitrogen runoff and GHG emission decrease. In the case of a +10 percent shock, the nitrogen application and the environmental effect are, in contrast, less intensive.
A decrease in organic fertilizer cost will result in an increase in its application and reduced chemical fertilizer use, vice versa. A remarkable point here is that nitrogen runoff increases under the MPS scenario in contrast to the original scenario because land use is changed from soy to wheat, which requires more nitrogen. The last simulation relates the long-term application of organic fertilizer, which gives a positive yield effect change of +10 percent. Under the scenario of a 10 percent increase, all results continue to hold. Conversely, a −10 percent scenario results in a slight increase in nitrogen runoff due to land-use change from soy to wheat.
We found that key results from this study hold even after the sensitivity analysis, although results rely on assumptions used. Some key assumptions (e.g., combining chemical and organic fertilizer) would require caveats for model outcomes.
Discussion and conclusion
There is growing interest in phasing out agricultural subsidies that may be adversely affecting the environment. Policy measures that provide incentives to increase the production of specific agricultural commodities could bring marginal land into production and increase pressure on the environment. In contrast, the policy measures targeted at specific environmental goals could bring effective compliance. Still today, the impact of some measures has yet to be defined, as the direction and magnitude of agricultural policy impacts on environmental performance are an empirical matter.
When discussing agricultural policies’ environmental impacts, it is very important to carefully define the appropriate baseline for a relative comparison of environmental impacts depending on regional conditions. For example, understanding the environmental effect of land-use change among oilseed, wheat, and buffer strips such as in Europe would be simple because wheat is more intensive than oilseed, and there is solid evidence of a richer biodiversity and water purification function in the buffer zones than in these agricultural fields. Contrarily, in Japan and other Asian monsoon countries, the environmental impact of land-use change between paddy fields, other upland crops, and abandoned land must be carefully considered because paddy fields are a source of methane and water pollution due to chemical fertilizers and pesticides. At the same time, paddy fields themselves purify water pollution and work as a biodiversity nursery, and this is called “secondary nature.”
In this context, this study presents analyses environmental impacts of agricultural policy instruments in Japan. The results indicate that environmental effects are site-specific, and MPS does not inevitably increase nitrogen runoff or total GHG emissions at any time, unlike in Henderson and Lankoski (Reference Henderson and Lankoski2019), who analyzed European crop-livestock land use. In this model, the total N application increases, but the chemical fertilizer application decreases since it is partially replaced with organic fertilizer under the MPS scenario. As an interpretation of farmer behavior, chemical fertilizer can be categorized as “inferior goods” compared with organic fertilizer, that is, the chemical fertilizer demand decreases when farmer income rises. In reality, Japanese farmers do not fully understand the superiority of organic fertilizer, and there is also uncertainty and time lag on yield increase effects. Furthermore, switching costs make farmers’ optimal decisions difficult (this can also be understood as “status-quo-bias”). Therefore, farmers tend not to necessarily view organic fertilizer positively. However, the positive yield effects are clearly defined without uncertainty, empirically. The social indirect cost is assumed to be zero in the model (only manure price, transportation, and spreading costs are modeled). Then, the optimal level of nitrogen application is estimated. There may be discrepancies between actual farmer decision-making and an optimal solution solved in the nonlinear programming problem. This partial shift of chemical fertilizer to organic fertilizer due to a price increase could occur. There is no accumulated empirical evidence, but Datai, Sato, and Tanaka (Reference Datai, Sato and Tanaka2005) surveyed farmers in Japan on the conditions of fertilizer application and behavior changes. They obtained data that 40 percent of farmers would like to increase organic fertilizer application in the event of any output price hike.
As an additional important finding from this study, simulations did indicate that all agri-environmental payments achieved the environmental benefit for the land studied. Currently, agri-environmental payments cover only 2 percent of Japan's cultivated area, and the share of the payments with voluntary agri-environmental constraints in producer support was 0.2 percent in 2015–17 in Japan compared with 9 percent in the European Union and 13 percent in the United States in 2015–17 (OECD 2019). Most farmers do not participate in the agri-environmental payment program, which could potentially improve their environmental performance. The impact of some support measures should be carefully defined. Still, it seems that there is potential to rebuild the Japanese farm support policy, which does not currently require any environmental conditions for farmers.
Acknowledgments
The authors wish to thank the researchers at the National Agriculture and Food Research Organization, especially Dr. Sadao Eguchi, for providing the yield, nitrogen application, and runoff data. We also appreciate the feedback offered by colleagues in the Ministry of Agriculture, Forestry and Fisheries, Japan, Permanent Delegation of Japan to the OECD, and the OECD Trade and Agriculture Directorate. The authors would also like to thank Enago (www.enago.jp) for the English language review.
Funding statement
This study was financially supported by the Policy Research Institute, Ministry of Agriculture, Forestry and Fisheries, Japan.
Competing interest
The authors declare that there are no conflicts of interest.
Data availability statement
Replication material are available on request.
Appendix
Annex: Theoretical Framework
Land use
Following the literature (e.g., Lichtenberg Reference Lichtenberg1989, Reference Lichtenberg, Gardner and Rausser2002; Lankoski and Ollikainen Reference Lankoski and Ollikainen2003; Lankoski, Lichtenberg, and Ollikainen Reference Lankoski, Lichtenberg and Ollikainen2004; Lankoski, Ollikainen, and Uusitalo Reference Lankoski, Ollikainen and Uusitalo2006; OECD 2010), let G(q) denote the cumulative distribution of q (acreage quality q, 0 ≤ q ≤ 1), while g(q) is its density, assuming that g(q) is continuous and differentiable. We assume that q is a quality of drainage condition directly related to productivity for wheat and soy. This element is the first propriety when paddy fields are converted to fields for other crops. The total amount of land in the region is:

To simplify the discussion, it is assumed that only rice paddy and one upland crop are cultivated in this region, i = 1, 2. Both crops are produced under constant returns to scale. The output of each crop per unit of the land area is denoted by yi , and yield is a function of land quality q and fertilizer application xi : y i = f i (x i ;q). The applied amount of fertilizer xi is the combination of chemical fertilizer xci and organic fertilizer xoi . This production function is increasing and concave in fertilizer and land quality.
Assume that the arable land can be allocated to either paddy rice or an upland crop. The share of each crop L 1 and L 2 is represented by:


Land abandonment is not considered in the theoretical part to simplify the theoretical framework.
Profit functions
The profit from agricultural production is expressed as:

Here, pi
refers to the price of crops and c to the fertilizer price, which are both taken as given. Organic fertilizer causes a yield-increase effect, which depends on the amount of application Φ
i
(x
oi
), defined as 1 < Φ
i
(x
oi
) with
$\Phi _x^i > 0$
 and
$\Phi _{xx}^i < 0$
and
$\Phi _{xx}^i < 0$
 .Footnote
8
At the same time, the additional cost of organic fertilizer collection, transportation, and spreading are incorporated in the profit function. In the presence of the yield-increase effect and additional cost of organic application, the profit function is modified as follows:
.Footnote
8
At the same time, the additional cost of organic fertilizer collection, transportation, and spreading are incorporated in the profit function. In the presence of the yield-increase effect and additional cost of organic application, the profit function is modified as follows:

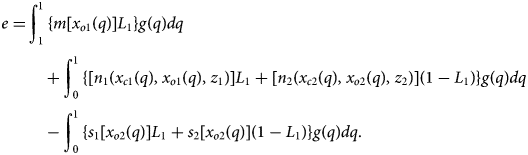
Environmental impacts
In this study, aggregate nitrogen (N) runoff is a function of chemical fertilizer use and N content of organic fertilizer use. N runoff from organic fertilizer is presumed to be 50 percent compared with that from chemical fertilizer. Runoff data of organic fertilizer vary depending on natural conditions, but organic fertilizer (especially the fully matured compost used in Japan) does not run off easily. In the Sasaki (Reference Sasaki2012), the N content in organic fertilizer was not included in the N runoff function, because N in organic fertilizer could be a serious problem only when the application amount is substantial. In their models, the maximum application of organic fertilizer was approximately 1.5 t/10a due to economic factors (high additional cost of manure application). However, in this study, aggregate N runoff is defined as a function of chemical fertilizer and N content of organic fertilizer applied. N-runoff volume due to organic fertilizer is supposed as half compared with that of chemical fertilizer. The runoff rate of organic fertilizer varies depending on natural conditions. Still, it is evident from field surveys that organic fertilizer (especially fully matured compost used in Japan) does not run off as easily and has fewer environmental impacts.Footnote 9 One of the most large-scale field studies in Shiga prefecture reported 48 percent N leaching reduction because of environmentally friendly farming, where farmers are encouraged to reduce the use of agricultural chemicals and chemical fertilizers by 50 percent or more compared with conventional farming.Footnote 10 Therefore, in the simulation, 50 percent reduction is used as an approximation based on the Shiga studies.
The runoff of nutrients (kg) from each field is expressed as a function of chemical and organic fertilizer applied x ci and xoi as:

with v x > 0, v xx > 0. Thus, the runoff function is convex in the fertilizer application. Paddy fields improve water quality by removing nitrogen through denitrification and absorption. When the total nitrogen inflow in paddy field water exceeds the total outflow of nitrogen discharged from the paddy field water, the paddy fields remove nitrogen, which means z 1 is negative. The total amount of runoff from the land area devoted to a rice paddy and an upland crop can be expressed as:

Agriculture is an anthropogenic source of CH4 and N2O. A response curve can describe the amount of the applied material and CH4 emissions. CH4 generation is not possible if the soil is not maintained in an anaerobic state. Upland soils are normally oxidative and anaerobic, and CH4 is not produced. CH4 emission is denoted as:

with m x > 0, m xx < 0. The runoff function is concave in the organic fertilizer application (Yan et al. Reference Yan, Yagi, Akiyama and Akimoto2005; IPCC 2006).
Following the Intergovernmental Panel on Climate Change (IPCC) guidelines, if the N2O emission is a combination of direct emissions (denitrification) and indirect emissions (atmospheric deposition and nitrogen runoff):

with n x > 0, n xx < 0, then the emission function is concave in the fertilizer application.
In addition to GHG emissions, agricultural soils serve as a carbon sink. Soil carbon stock is affected heavily by fertilizer management as well as CH4 and N2O emissions from agricultural land. Appropriate amounts of organic fertilizer could increase the soil carbon content and stimulate the total GHG emission reduction. The carbon sequestration function is:

with s x > 0, s xx < 0. Thus, the sequestration function is concave in the organic fertilizer application.
Consequently, the net GHG emission is expressed as follows:
In rice paddy fields, the cultivation area plays an essential role as a habitat, and the factors most negatively impacting biodiversity during the paddy cultivation are pesticides and herbicides. This model does not account for pesticides and herbicides due to technical difficulty. However, there is a positive correlation between the amounts of chemical fertilizer used and pesticide and herbicide used. The pseudo-correlation between the amount of chemical fertilizer used and paddy field biodiversity (and ridges between rice fields) could be modeled using recent survey data.
Paddy field biodiversity index value BD can be expressed as a function of chemical fertilizers; this is a good proxy variable of agricultural intensification affecting biodiversity, and BD is expressed as:

On the other hand, biodiversity in arable lands (i.e., wheat and soy farms) are not included in the modeling exercise, as there is insufficient scientific evidence for Japan.
The land is allocated to the highest returning crop for each field, seeking optimal inputs and profits for each crop. This study estimates the baseline without any policy intervention and private optimum, which incorporates several agricultural supports. For private optimum, the farmer ignores the effects of environmental externalities.


 Open access