


There is growing interest in food environment research including policy and programme development in North America(Reference Raine1–4). Generally, the food environment involves any opportunity to get food, including the accessibility and proximity to retail stores/outlets(Reference Ruff, Akhund and Adjoian5) and accessibility to and affordability (cost) of foods and beverages, as well as marketing of foods and beverages(Reference Craig, Bauman and Cameron6,Reference Ferreira, Van and Wendel-Vos7) . The food environment has been implicated in promoting an overconsumption of unhealthy food and beverage choices(Reference Buhler, Raine and Arango8,Reference Spence, Cutumisu and Edwards9) , and influencing the diet and health of individuals(Reference Ruff, Akhund and Adjoian5). Spence et al.(Reference Spence, Cutumisu and Edwards9) found that obesity in the Canadian context is associated with the relative availability of different types of food outlets around peoples’ homes – the proximity of the obesogenic environment to individuals(Reference Spence, Cutumisu and Edwards9). In addition to availability, research has shown that the low price of unhealthy food options has contributed to an increased consumption of unhealthy foods(Reference Anderson and Butcher10,Reference Datar and Nicosia11) .
As a major determinant of dietary intake, the food environment influences diet-related outcomes such as weight gain and obesity(Reference Glanz, Sallis and Saelens12). While the prevalence of obesity in adults (defined by a BMI ≥30 kg/m2)(13) has remained stable over 10 years in Canada (2007–17), the prevalence is much higher in Nova Scotia (35 %) compared to the Canadian average (27 %)(14). Research has shown a correlation between area or neighbourhood-level socioeconomic status (SES) (i.e. the risk factor for obesity measured on the basis of a relation between income, education and obesity) and obesity in adults(Reference Harrington and Elliott15) and children and youth in Canada(Reference Janssen, Boyce and Simpson16,Reference Oliver and Hayes17) . These historically high levels are in spite of efforts targeting primarily individual behaviours to promote changes in diet and physical activity(Reference Buhler, Raine and Arango8). The high rates of obesity in Nova Scotia and Canada are linked to an increased risk of many chronic diseases, including type 2 diabetes, certain types of cancer, sleep apnoea and hypertension(Reference Guh, Zhang and Bansback18–Reference Luo, Morrison and de Groh20). High rates of obesity and related chronic diseases in Canada contribute to high healthcare costs, estimated at $4·3 billion annually in 2005(Reference Katzmarzyk and Ardern21).
There is substantial literature showing the association between obesity and food insecurity, especially in women and, to some extent, in adolescents and children(Reference Frongillo and Bernal22,Reference Martin and Lippert23) . Food insecurity and obesity tend to coexist given that both are consequences of economic and social disadvantage(Reference Frongillo and Bernal22). Food insecurity can cause health issues, including chronic diseases such as obesity, depression and stress(Reference Fuller-Thomson and Nimigon24–Reference Muirhead, Quiñonez and Figueiredo26). It also has a potential to increase healthcare costs(Reference Tarasuk, Cheng and de Oliveira27). Nova Scotia has consistently had some of the highest rates of food insecurity of all Canadian provinces – 17·5 % households in Nova Scotia experienced food insecurity in 2012 compared to 12·6 %, the national average(Reference Tarasuk, Mitchell and Dachner28).
Dietitians of Canada have identified the availability and cost of healthy foods as one of the six main barriers to healthy food environments and have called for advocacy to healthier food environments(Reference Whittington-Carter, MacDonald and Vanderkooy29). As such, this study investigated the food environment in Nova Scotia to understand if there are differences in the overall availability and price of ‘healthier’ compared with ‘less healthy’ foods in grocery and convenience stores . Specifically, we examined the availability and price of ‘healthier’ v. ‘less healthy’ foods by geography (urban, rural), store category (chain, independent) and by store type (standard, pharmacy, gas) for convenience stores, and by store size (small, medium, large) for grocery stores in Nova Scotia.
Methods
Design
We employed a descriptive cross-sectional study to examine the availability and price of healthier compared to less healthy foods in Nova Scotia using data from the larger Nova Scotia Consumer Food Environment (NS-CFE) project undertaken by the Food Action Research Centre (FoodARC) in 2015/16.
Sample
We selected forty-seven grocery stores and fifty-nine convenience stores via stratified random sampling from a list of 210 grocery stores and 758 convenience stores initially identified in Nova Scotia. Grocery stores were classified as megastores (i.e. a physically large retail establishment that sells groceries in addition to a range of other non-food items), large, medium and small stores based on square footage using the number of cash registers as a proxy(Reference Glanz, Sallis and Saelens12,Reference Andreyeva, Blumenthal and Schwartz30) where square footage was unavailable. Small stores had 1–2 cash registers, medium stores had 3–4, and large stores had >4. Convenience stores were categorised into subtypes: (1) associated with gas stations, (2) pharmacies and (3) standard. The selected stores were located both in rural and urban areas. Stores that required paid membership and restaurants were excluded from the final list. Rural areas were defined as towns and municipalities outside of the commuting zone of urban centres, with a population ≤10 000; an urban area was defined as a community with a population >10 000 people(Reference du Plessie, Beshiri and Bollman31).
‘Healthier’ v. ‘less healthy’ classification’
We classified foods into ‘healthier’ and ‘less healthy’ categories to be consistent with Nova Scotia Department of Health and Wellness programmes and policies supporting and encouraging the consumption of fruits and vegetables among Nova Scotians. Foods classified as ‘healthier’ included fresh, frozen and canned fruits and vegetables having lower levels of sodium, free sugar and/or saturated fat(32) (e.g. one loaf of whole-wheat bread; 1 kg of lean-ground beef (extra lean seldom available); one can (398 ml) of peach juice (no sugar added), one can (398 ml) of pineapple juice (no sugar added); one can (796 ml) of tomatoes (no sodium/sugar); one can (398 ml) of peas (nothing added); one can (398 ml) of baked beans (low sodium, <400 mg/125 ml serving); one bag of baked lays chips; 1·75 litres of 100 % orange juice; 1·89 litres of 100 % vegetable juice (low sodium)). Those classified as ‘less healthy’ included foods high in fat, sugar or salt – salty snacks, cookies and crackers, doughnuts and pastries, and candy (e.g. one loaf of white bread; 1 kg of medium-ground beef; one can (398 ml) of peach syrup, one can (398 ml) of pineapple syrup; one can (796 ml) of tomatoes (regular); one can (398 ml) of peas (regular); one can (398 ml) of baked beans (>499 mg/125 ml serving sodium, >8 g/125 ml serving sugar); one bag of classic lays chips; 1·75 litres of 100 % orange juice cocktail; 1·89 litres of 100 % vegetable juice (regular sodium)). These nutrients are consumed in excess among the Canadian population, and dietary recommendations advise that Canadians should aim to limit their intake(4,32) . Specific nutrient criteria were adapted from the Nutrition Environment Measures Surveys in Stores (NEMS-S) and NEMS–Corner Stores (NEMS-CS) protocols as well as the Nova Scotia Healthy Eating in Recreation and Sport Setting Guidelines(33) for levels of sodium, sugar and/or saturated fat to determine if a food item would be considered ‘less healthy’ or ‘healthier’.
Data collection
We adapted the NEMS-S(Reference Lo, Minaker and Mah34) and NEMS-CS(Reference Cavanaugh, Mallya and Brensinger35) to the Nova Scotia context, eliminating food items that are not regularly purchased in Nova Scotia, such as mangoes (based on Statistics Canada’s survey of household spending – Annual Household Expenditures on Food 2010–14) and those that were not of interest to the research team (e.g. baked goods, cereal and other grains), while including foods of interest within the Nova Scotia context(36). Data were collected between 30 November 2015 and 22 January 2016, with a 2-week period over the holiday season where data collection did not occur. We pre-tested the draft survey tools for convenience and grocery stores on two separate occasions to ensure raters were completing assessments comparably. Data were recorded onto printed copies of the survey tools and were entered into a Microsoft Access database (version 1.18) developed specifically for this study. Data for shelf space measurements were inputted in units of metres while that for availability were coded to indicate if the item was available or unavailable. Data for affordability were coded to indicate the price of ‘healthier’ v. ‘less healthy’ food (i.e. number of healthier v. less healthy food items available) in grocery and convenience stores.
Data analysis
NEMS-S and NEMS-CS scoring systems were adapted as they were found to be relevant to the Nova Scotia food environment analysis(33). We modified the original NEMS scoring system based on the local food environment, as recommended by its publishers (Table 1). Because data on price and quality of food and beverage items were not collected in a format that was amenable to scoring on the NEMS tool, we calculated the scores for availability based on the modifications made to NEMS-CS and NEMS-GS. Lower NEMS scores denoted the availability of less healthy foods; however, the total number of varieties of fruits and vegetables in each store were not specifically collected. Thus, scores were not converted to the point system as originally used (where <5 varieties = 1 point; 5–9 = 2 points; and 10+ = 3 points) as it would likely not be representative of the total variety of fruits and vegetables at each store.
Table 1 Descriptive outcomes of analyses of food availability, pricing and shelf space of healthier and less healthy foods in convenience stores
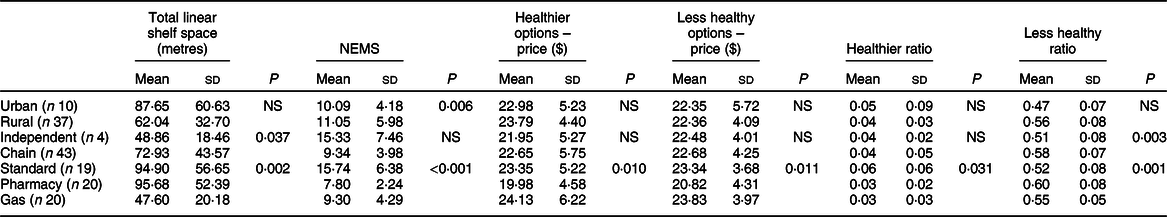
NEMS, Nutrition Environment Measures Surveys; n denotes the number of convenience stores.
To examine geographic representation across the province, post hoc χ 2 or Fisher’s exact tests were run on the distribution of grocery stores and convenience stores/sub-type by zone, as appropriate. Additionally, it should be noted that grocery stores were not stratified by store size for sampling; this was a post-stratification factor; given the methods for store size classification, small and medium stores were combined for examining geographic representation. Bivariate Pearson correlations were run to examine the relationship between shelf space ratios and healthy food availability via the NEMS score. ANCOVA were run to examine the differences in NEMS scores, and price across predictor variables, including rurality (urban, rural), store category (chain, independent), store type (standard, pharmacy, gas) for convenience stores, and across rurality and store category for grocery stores, controlling for total shelf space. Base-10 log-transformed NEMS scores were used in this analysis due to violations of normality of residuals and homogeneity of variance. Mann–Whitney U tests and Kruskal–Wallis tests with pairwise comparisons, as appropriate, were used to compare total shelf space, as well as healthier and less healthy space ratios across rurality, store category and store type for convenience stores, and to compare shelf space, healthy and less healthy space ratios as well as price across rurality, store category and store size for grocery stores. Bonferroni corrections were applied for multiple tests, when appropriate.
For price analysis, the lowest prices of items that had a healthier and less healthy alternate were summed for each store, correcting for the size of cans or bottles that were measured in a different size such that all measured for that amount. Prices were also corrected for availability, as each store did not have all the items available. Thus, the summed price was divided by the number of items available, and then multiplied by the total number of items possible in the pricing score. Convenience stores had eight items in each category, whereas grocery stores had ten items in each category.
For linear shelf space, the scores for healthier and less healthy shelf space were converted to ratios to correct for total shelf space measured, as these data more accurately reflect the proportional space dedicated to healthier and less healthy foods when comparing across stores of different sizes (Table 2). All data were analysed using SPSS v.24.0(37).
Table 2 Correlations between shelf space ratios and rurality, store type/size and store category for grocery and convenience stores
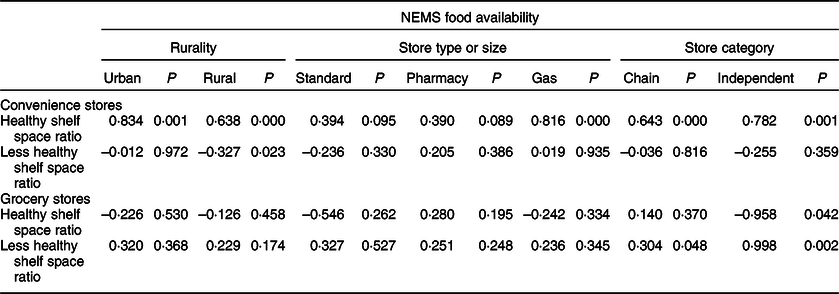
NEMS, Nutrition Environment Measures Surveys.
Results
Convenience stores
There were significant differences in total shelf space available across store categories (P = 0·04) and store types (P < 0·01). As such, scores for healthier and less healthy space were converted to ratios, correcting for total shelf space measured. There was a significant effect of rurality on food availability as measured by the NEMS scores (P < 0·01) whereby rural stores had greater healthier food availability than urban stores, after controlling for total shelf space (see Table 1).
There was also a difference in food availability across store sizes after controlling for shelf space, where standard convenience stores had greater healthier food availability compared to both pharmacy and gas station stores (both P < 0·01). For shelf space, standard convenience stores had a higher ratio of shelf space dedicated to healthier food compared to gas station stores (P = 0·04), but not compared to pharmacies. With less healthy shelf space, pharmacies had a greater proportion of space dedicated to less healthy food compared to standard convenience stores (P = 0·001) and gas station stores (P = 0·037). The ratio of less healthy food space was also higher in chain stores compared to independent stores (P < 0·005) (see Table 2).
With respect to the price of healthier food options, there was a significant difference in price across store types (P = 0·01), whereby standard convenience stores and gas station stores had more expensive pricing than pharmacies (both P < 0·01) after controlling for store size. For the price of a basket of less healthy food, the results were similar, in that gas (P < 0·01) and standard convenience stores (P = 0·01) had more expensive pricing compared to pharmacies. However, overall, the price for a basket of healthier (mean 22·47, sd 5·60) v. less healthy (mean 22·63, sd 4·15) foods in convenience stores was similar (P > 005).
To better understand the relationship between shelf space and the availability of healthier food, we examined the ratio of less healthy to healthier shelf space to food availability. There was a positive correlation between the ratio of healthy shelf space and NEMS food availability (r = 0·53, P < 0·001), and a negative correlation between the ratio of less healthy shelf space and NEMS food availability (r = –0·29, P = 0·03). There was a wide variation in the ratio of less healthy to healthy shelf space across store types and across stores (see Fig. 1).
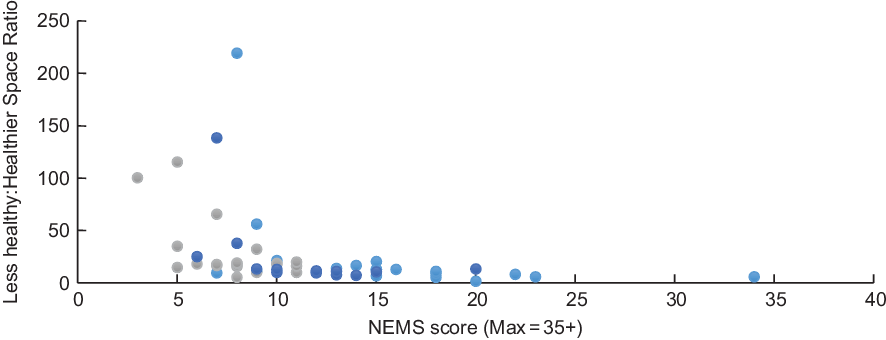
Fig. 1 Food availability and ‘less healthy–healthy shelf space’ ratio for food options in convenience stores in Nova Scotia by store category. NEMS, Nutrition Environment Measures Surveys. ![]() , standard convenience stores;
, standard convenience stores; ![]() , pharmacy;
, pharmacy; ![]() , gas station
, gas station
For example, in one convenience store classified as ‘standard’, the less healthy ratio was over 200 times higher than the healthier ratio. Also, salty snacks and candies were available in all (100 %) of convenience stores of all types in both urban and rural areas, compared with fresh fruits (36 %) and canned and preserved fruits (mostly canned pineapple) (66 %). The ratio of healthy shelf space was significantly related to NEMS food availability in urban and rural areas (both P < 0·001) (Table 2). Healthy shelf space ratio and food availability were also significantly related by store category (chain and independent stores) (both P ≤ 0·001). There was no significant relation between less healthy shelf space and NEMS food availability score for urban areas (P = 0·972), store type (standard P = 0·330; pharmacy P = 0·386; gas P = 0·935) or by store category (chain P = 0·816; independent P = 0·359). However, there was a significant negative correlation between less healthy shelf space and NEMS food availability score in rural stores (P = 0·023).
Grocery stores
There were significant differences in total shelf space by rurality, store category and store size (all P < 0·001) (Table 2). Thus, all subsequent analyses looking at shelf space used a ratio of healthier/ total and less healthy/total shelf space to understand whether the proportion of space for healthier or less healthy foods still differed after controlling for the total size of the store. Additionally, shelf space was controlled in the analyses comparing food availability and price across rurality, and store category to correct for this confounding effect. There were differences in healthier food availability as measured by the NEMS score by store category even after controlling for the total shelf space. Chain stores had greater healthier food availability compared to independent stores (P < 0·01). There was also a significant difference in food availability as a function of store size, whereby large stores had greater healthier food availability compared to both small and medium (P < 0·001 and P < 0·01, respectively) stores (see Table 3).
Table 3 Descriptive outcomes of analyses of food availability, pricing and shelf space of healthier and less healthy foods in grocery stores
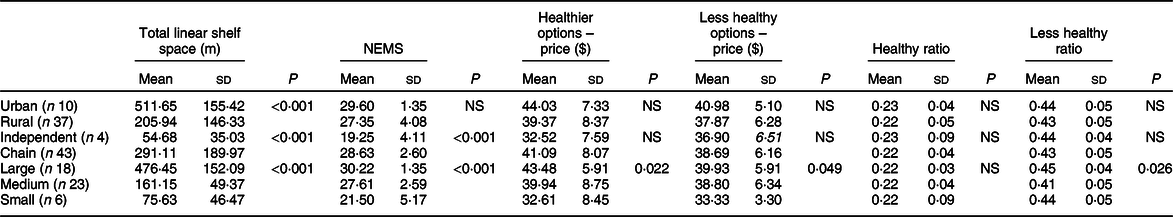
NEMS, Nutrition Environment Measures Surveys; n denotes the number of grocery stores.
The overall price of a basket of healthier foods (mean $40·36, sd 8·31) was similar to the price of a basket of less healthy foods (mean $38·54, sd 6·14) (P > 005). When looking at the price of healthier food options, we found that there were no significant effects of rurality or store category after controlling for total shelf space (Table 2). However, the price of food was significantly different across store sizes overall, whereby the price of healthier foods was higher in large compared to small stores (P = 0·02), and the price of less healthy foods was higher in large stores compared to small stores (P < 0·05). Relatedly, there was still a significantly higher proportion of less healthy shelf space in large compared to medium stores (P = 0·02).
The relationship between shelf space and food availability was quite different in grocery stores compared with convenience stores. Generally, the ratio of healthier shelf space (r = –0·09, P = 0·54) or less healthy shelf space (r = 0·24, P = 0·11) was not significantly related to food availability in grocery stores. The only positive associations that emerged were between the ratio of less healthy shelf space and food availability in independent stores (P < 0·01), and the ratio of less healthy shelf space and food availability in chain stores (P < 0·05). The ratio of healthier shelf space was negatively related to food availability in independent stores (P < 0·05); however, this result was likely skewed due to the small number (n 4) of independent stores, which still had a higher proportion of less healthy shelf space than healthier shelf space, but had a range (14–24) of food availability scores (See Table 2). Despite these mainly non-significant findings for the relationship between shelf space and food availability, there was still a large variability in the ratio of less healthy to healthier space in relation to food availability by store size (see Fig. 2). The availability of less healthy foods was positively skewed with a greater availability in larger compared to small and medium grocery stores.
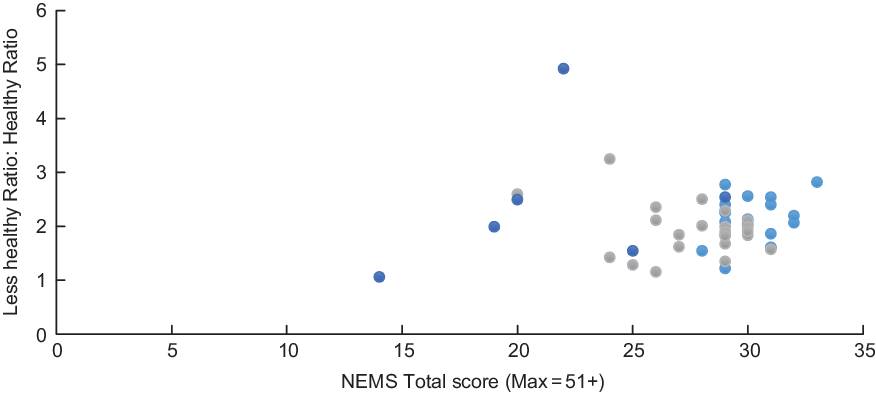
Fig. 2 Food availability and ‘less healthy–healthier shelf space’ ratio for food options in grocery stores in Nova Scotia by store size. NEMS, Nutrition Environment Measures Surveys. ![]() , large;
, large; ![]() , medium;
, medium; ![]() , small
, small
Discussion
This research sought to examine the availability and price of ‘healthier’ compared with ‘less healthy’ foods by geography (urban, rural), store category (chain, independent) and store type (standard, pharmacy, gas) for convenience stores, and store size (small, medium, large) for grocery stores. In terms of food availability, we found that there was a significant effect of rurality on food availability, with a higher availability of healthy foods in rural compared to urban areas for convenience stores. This contradicts previous research that found little differences in rural and urban areas and limited healthy food options in smaller stores in rural areas (i.e. less densely populated communities)(Reference Racine, Batada and Solomon38–Reference Racine, Kennedy and Batada41). This may be because these stores (convenience stores, independent stores), which are more common in rural areas, tend to offer a smaller selection of more healthier foods than in urban areas(Reference Bustillos, Sharkey and Anding42,Reference Larson, Story and Nelson43) . However, research shows that convenience stores in rural areas are generally perceived as food retailers that promote minimally nutritious food options(4,Reference Black, Ntani and Inskip44) .
Results of this study also showed disparities in food availability across store categories for grocery stores in Nova Scotia. They showed that healthier food options were more readily available in chain stores than in independent stores, as well as in large- v. medium-sized grocery stores. These findings are consistent with previous studies that showed that chain stores have a greater availability and selection of healthier food options than smaller grocery stores(Reference Glanz, Sallis and Saelens12,Reference Walker, Keane and Burke45,Reference Powell, Slater and Mirtcheva46) . The availability of fewer healthy food options in independent and medium grocery stores is a public health concern given that these are often the store categories present in rural areas(Reference Walker, Keane and Burke45,Reference Powell, Slater and Mirtcheva46) . Moreover, this may have potential adverse implications on dietary patterns and might contribute to the risk of obesity(Reference Morland, Diez Roux and Wing47).
Although the price of a basket of healthier v. less healthy food options remained similar across all convenience stores, the study showed variations in the price of a basket of healthier v. less healthy foods across grocery store types. We found that it was more expensive to buy healthier foods in large grocery stores than in small grocery stores in Nova Scotia. Similarly, less healthy food options were more available in large grocery stores than in small grocery stores in Nova Scotia. These findings are contrary to previous studies that found more favourable prices for healthier food items in larger stores compared to small stores(Reference Black, Ntani and Inskip44,Reference Moore, Diez Roux and Franco48) . This finding emphasises the need for research considering rural food environments conducted at a functional regional or provincial level(Reference Minaker, Shuh and Olstad49).
A few limitations need to be addressed. The data do not cover the complete food environment in Nova Scotia; it did not include stores requiring paid membership, as well as restaurants. Also, data for this study were collected in November 2015 and January 2016. Since then, policies to improve the nutritional quality of foods and beverages and to encourage healthy eating behaviours are underway in post-secondary institutions and the healthcare sector(Reference Vanderlee, Goorang and Karbasy50). Therefore, more exhaustive investigations are needed to confirm these findings and to evaluate the impact of these policies on dietary health. Though our sample size for both convenience and grocery stores was adequate, it became quite small when comparisons were made within categories of rurality, store type, store category and/or size. Although there was enough power to run all the analyses described, caution should be taken in the reproducibility of these results, or the ability to make generalisations beyond the sample within the current study. These are, of course, limitations of small sample and selection bias, which might limit the generalisability of findings(Reference Kumar, Jim-Martin and Piltch51–Reference Martinez, Rodriguez and Mercurio53).
Limitations aside, the current study fills a gap in CFE research by providing a snapshot into the food retail environment across Nova Scotia, Canada, including rural and urban areas. CFE research has mainly focused on the United States and many Canadian studies have been conducted in urban regions(Reference Minaker, Raine and Cash54,Reference Minaker, Raine and Wild55) . The present study represents the largest to date to look at food availability and price across these descriptive variables in Nova Scotia. Given the influence the food environment has on dietary behaviours and on health(Reference Ruff, Akhund and Adjoian5,Reference Malik, Schulze and Hu56,Reference Vartanian, Schwartz and Brownell57) , this study focused on the availability and affordability of healthier v. less healthy foods in convenience stores and grocery stores in Nova Scotia. The research underlined a strong relation in the availability of healthier foods by rurality and store category (more healthier food options were available in rural compared to urban areas, and in chain and large stores compared to independent and medium stores). This points to the possible targets for improving the accessibility of healthier foods in Nova Scotia, that is, for interventions to encourage the availability of healthier foods in convenience stores (especially in urban areas), and in medium and independent grocery stores. This may reduce the potential negative effects of a higher availability of less healthy foods on the dietary behaviours and health of Nova Scotians. Such interventions align with previous research suggesting that increasing the availability and affordability of healthy foods is one of the fundamental ways to improve the food environment. For example, there was an increased availability of healthier foods in point-of-purchase stores in low-income areas in Baltimore city, thanks to a 10–30 % price discount on selected healthier food items for a period of 6 months(Reference Budd, Cuccia and Jeffries58).
Findings of this study (specifically those relating to price) highlight the need for potential public policy measures to improve access to healthy foods given that price is an important determinant of food choices and diet (WHO 2004). Previous studies have suggested that the implementation of taxes and price manipulations on sugar-sweetened beverages, high-calorie-low-nutrient foods, or foods high in added sugar or saturated fats may influence food consumption, consumers’ purchasing patterns, body weight or diet-related chronic diseases(Reference Powell, Chriqui and Khan59–Reference Powell and Chaloupka63). For example, Block et al.(Reference Block, Chandra and Mcmanus64) reported that a 35 % tax on sugar-sweetened drinks in a hospital cafeteria led to a 26 % decline in sales. Also, Nakamura et al.(Reference Nakamura, Mirelman and Cuadrado65) found that sales of sugary drinks decreased by 21 % 1 year after Chile raised tax from 13 to 18 % on drinks containing >6·25 g added sugars per 100 ml. In addition to raising tax on sugar-sweetened beverages, some studies suggest that the tax monies raised be used to subsidise programmes targeting socioeconomically disadvantaged groups(Reference Langellier, Lê-Scherban and Purtle66,Reference Kawther and Jenny67) . Thus, the implementation of taxation on sugar-sweetened beverages, high-calorie-low-nutrient foods, etc., in Nova Scotia has a potential to reduce the rate of chronic conditions, especially obesity.
Findings of this study show that food environment in Nova Scotia is dominated by less healthy foods that are accessible at lower prices than healthier food options. Given the significant role that the food environment plays in contributing to poor dietary habits and health risks(Reference Shemilt, Marteau and Smith62,Reference Powell and Chaloupka63) , there is a need for government action to support food environments that have a potential to support healthier diets among Nova Scotians.
Acknowledgements
Acknowledgements: Thanks are owed to grocery and convenience stores in Nova Scotia for participating in the research. Thanks are also owed to the members of the Nova Scotia Consumer Food Environment and Research Advisory Committee for their support and advice, as well as to the many partners, staff and students who supported several aspects of this research Special thanks to Nicole Druhan-McGinn and Amy MacDonald, formerly with the Nova Scotia Department of Health and Wellness, for their contributions to the study design and initial data analysis and interpretation. Financial support: This work was commissioned and supported by funding to the Food Action Research Centre (FoodARC) from Nova Scotia Department of Health and Wellness. Conflict of interest: None. Authorship: M.E. contributed to study design, analysis and interpretation of data and drafted the manuscript. P.L.W. conceived and designed the study, contributed to data analysis and interpretation, and provided critical revisions to the manuscript for important intellectual content; she is also the guarantor of the study. A.G. provided statistical and qualitative data management and analysis expertise; she also provided critical revisions to the manuscript for important statistical content. M.W. contributed to study design, participated in data collection and contributed to analysis and interpretation of data, as well as provided critical revisions to the manuscript. M.T., R.M., C.J. and K.K. provided critical feedback to the manuscript and contributed to the interpretation of data. Ethics of human subject participation: This study was conducted according to the guidelines laid down in the Declaration of Helsinki and all procedures involving study participants were approved by the Mount Saint Vincent University Ethics Review Board. Written informed consent was obtained from all participants.


