


Introduction
Following initial infection, the kinetics of pathogen growth and host response can shape population-level disease patterns [Reference Pepin1]. The infectious period has long been recognised as a key component of epidemiology [Reference Anderson and May2] and more recently, heterogeneity in pathogen load and shedding has been suggested as an underlying driver of large-scale transmission patterns [Reference Hawley and Altizer3, Reference Handel and Rohani4]. While some pathogens may generate consistent infection patterns from host-to-host, others may produce a range of mild to severe diseases, variable shedding rates or inconsistent immune responses [Reference Grodio5, Reference Teunis6]. As a result, population disease parameters derived from cross-sectional surveys may be highly dependent on where hosts lie on the infection timeline [Reference Nielsen, Toft and Gardner7] or where they fall on the gradient of possible responses [Reference Lachish8]. Estimating temporal variation in infection parameters and the distribution of possible host responses are therefore important first steps to model and manage infectious diseases.
In wildlife, these infection dynamics can be difficult to estimate as individuals are often sampled infrequently, timing of infection is typically unknown and reliable diagnostic tests may be unavailable. Managers may therefore face uncertainty when determining whether pathogens pose significant threats to rare species and how to best monitor and mitigate those threats. The Agassiz's desert tortoise (Gopherus agassizii) is one example of a managed species impacted to some unknown degree by infectious disease [9]. Identified bacterial pathogens, Mycoplasma agassizii and M. testudineum, can cause a chronic upper respiratory tract disease (URTD) in tortoises within the genus Gopherus [Reference Jacobson10], which can lead to mortality but more often results in long-term morbidity. Infection with either pathogen can result in visible-clinical signs including palpebral edema and nasal and ocular discharge, but clinically silent hosts and time periods appear common [Reference Brown11–Reference Weitzman, Sandmeier and Tracey13]. Standardised health assessments and robust diagnostic tools only recently became widespread in this system, and so many of the basic attributes of URTD infection and epidemiology have not been thoroughly quantified [14].
Without understanding pathogen and disease dynamics within individuals, the chronic and cryptic nature of URTD can prevent meaningful interpretation of population-level health data. Prior M. agassizii challenge studies monitored tortoises over short time periods – often less than 1 year – and lacked quantitative methods to monitor infection loads beyond the initial doses given [Reference Brown15–Reference Sandmeier17]. Inoculations may also misrepresent natural infection patterns, as pathogen dose can determine the time course or severity of disease experienced [Reference Handel and Rohani4], and doses transmitted via contact may differ from those chosen for direct inoculations. To characterise the kinetics of M. agassizii infection (considered the more virulent and prevalent of the two identified pathogens associated with URTD), we monitored a captive population of adult G. agassizii that were infected with M. agassizii through contact during experimental exposures [Reference Aiello18]. During and after the initial exposure periods, we performed regular health assessments and collected tissues for multiple diagnostic tests over the course of 4 years to characterise the dynamics of pathogen load, pathogen shedding, antibody production and clinical signs.
Methods
Study animals and monitoring protocol
We conducted this study at the Desert Tortoise Conservation Center (DTCC), Clark County, Nevada, USA – an outdoor captive facility constructed within native creosote-bursage desert scrub. Tortoises lived in open-air pens that contained native shrubs and two artificial burrows. Throughout the study, we used aseptic techniques when entering pens and handling tortoises and provided food and water on a schedule developed by San Diego Zoo. All research and captive-care protocols were conducted in accordance with Federal (TE030659) and State permits (NV: 317351) and were approved by the Penn State University IACUC committee (#38532 and #46114).
As a result of transmission studies described in Aiello et al. [Reference Aiello18], 14 captive adult desert tortoises (six female, eight male) became infected with the pathogen M. agassizii following contact with one of eight infected male hosts. In addition to the presence of M. agassizii in the nasal and oral cavity, all donors had occasional to consistent nasal discharge and detectable adaptive antibodies. Following initial introduction to donor hosts (19 August 2013), we conducted visual-health assessments and collected oral swabs, nasal flush samples and blood from all exposed tortoises at three time points: 2, 6 and 10 weeks post-exposure to ensure infections had established. After winter dormancy (November 2013–March 2014), all exposed tortoises were quarantined in single pens and examined weekly from late March/early April–October in 2014–2016 and from April–July in 2017. During weekly health assessments, we collected oral swabs to estimate infection intensity and nasal swabs to estimate shedding rates. A subset of these assessments (typically three per year) also included a blood draw to estimate the timing of antibody production.
Visual-health assessments and clinical-sign scores
We modified visual-health assessment procedures developed by USFWS [14] to include additional clinical abnormalities and gradients of clinical-sign severity (Table S1). Trained technicians documented all observed clinical signs and sign severity on the day of the assessment and took detailed photos of the face and any abnormalities observed on the skin or shell. All photos were later reviewed by C.M.A., and a revised health assessment dataset was created that included any additions or modifications to clinical signs as determined by the photo review.
Each clinical sign was given a numerical value of 1–4 and summed to create a clinical-sign index (CSI) for each health assessment as an indication of disease severity. For each tortoise, we calculated the mean CSI for all assessments conducted prior to M. agassizii exposure. We then calculated a ΔCSI for each post-exposure assessment as the difference between the current CSI and the pre-exposure CSI. Positive ΔCSI values therefore indicated worsening health relative to a tortoise's pre-exposure condition. We also summed nasal discharge values given to each naris to create a nasal discharge score for each assessment that ranged from 0 to 8. Clinical-sign definitions and assigned values can be found in Table S1.
Tissue collection methods and analysis
Oral swab, nasal flush and blood collection procedures were previously described in Aiello et al. [Reference Aiello18]. We collected nasal swabs by placing a single sterile micro-tipped polyester swab against one naris with mild pressure and spinning the swab 360 degrees. The same swab was then moved to the other naris, which was swabbed in the same manner. The swab tip was placed in a sterile vial and stored on ice. All samples (oral swabs, nasal swabs, nasal lavage fluid, blood plasma and red blood cells) were temporarily stored in a standard freezer (−20 °C) until transferred to an ultra-cold freezer for extended storage (−70 °C).
For all 2013 health assessments, oral swabs (one per assessment) and nasal lavage samples were shipped on dry ice to the San Diego Zoo Amphibian Disease Laboratory (Escondido, CA, USA) for quantitative polymerase chain reaction (qPCR) to detect the M. agassizii 16S ribosomal RNA gene and estimate abundance of bacteria per sample [Reference Braun19]. In 2014, we sent all weekly oral and nasal swabs (one per assessment) for qPCR analysis and in 2015–2017, we sent all biweekly oral and nasal swabs for qPCR tests. Results for each qPCR test could be negative, positive or equivocal (inconclusive). A positive result also included three estimates of M. agassizii abundance – we used the mean of these three values in all data summaries and analyses. Negative or equivocal results were considered a non-detection and given an M. agassizii abundance of zero. All blood plasma samples were shipped to the Dr Mary Brown Laboratory at the University of Florida (Gainesville, FL, USA) for an Enzyme-Linked Immunosorbent Assay (ELISA) to detect antibodies to M. agassizii [Reference Wendland20]. Wendland et al. [Reference Wendland20] previously defined categorical ELISA results as negative (antibody titre <32), suspect (antibody titre ⩾32 and <64) or positive (antibody titre ⩾64) results. We used these result categories as they are the current standard method for determining seropositivity in G. agassizii populations [14].
Statistical analyses
Summary statistics
Since we could not determine the exact day new infections established, all analyses were conducted in reference to the week infected tortoises were introduced to naïve hosts (weeks post-exposure). All M. agassizii abundances estimated by qPCR were log transformed after adding 1 to the abundance so that zero values would remain zero on the transformed scale. All results, plots and analyses refer to these transformed values. For each tortoise, we calculated the area under the curve (AUC) by the trapezoidal rule [Reference Carnahan, Luther and Wilkes21] for all oral swab-based M. agassizii abundances as an indication of cumulative infection intensity. We calculated the AUC of nasal swab-based M. agassizii abundances as an indication of the cumulative amount of pathogen shed throughout the study. For each tortoise, we summed all positive ΔCSI values for the first five health assessments (weeks 2–33 post-exposure) to represent initial disease severity, and we summed positive ΔCSI values and nasal discharge scores for all assessments as indicators of long-term disease severity and persistence.
Associating cumulative shedding with host response to infection
We used generalised linear regression models (GLM) to assess the effect of total host infection intensity (oral swab AUC) and discharge severity (∑nasal discharge score) on the amount of pathogen shed and detected throughout the study (nasal swab AUC). The response variable, nasal swab AUC for the ith tortoise (y i), could only take on positive, continuous values and so we assumed a Gamma distribution and used a log link function to relate the linear predictor to the expected response. The gamma distribution, which is described by a shape (ν) and scale (λ) parameter can be re-parameterised using λ = ν/μ i [Reference Faraday22] so that:
 $$y_i\sim\; \hbox{Gamma}(\mu _i,\nu )$$
 $$g(E(y_i)) = \log (\mu _i) = \; \beta _0 + \; \beta _1x_{1,i} + \; \beta _2x_{2,i}$$
We included two continuous covariates in the linear predictor-oral swab AUC (x 1) and nasal discharge score (x 2)–which were first checked for correlation, and then centred by their mean prior to use in regression models. Due to the small sample size we did not include an interaction term between covariates. After fitting an initial model with both predictors, we used data simulation and residual diagnostic plots to assess model fit [Reference Gelman and Hill23]. We determined that logging oral swab AUC prior to use in the model improved model fit and diagnostic plots (no indication of assumption violations), and so we report results from the model fit using logged values. Alternative response distributions (Poisson, quasi-Poisson and lognormal) were considered, but either worsened or did not improve model fit or diagnostics compared with the Gamma model. Coefficients in the final model were considered significant if P-values were <0.05. All analyses were conducted using the Program R and data simulation and model diagnostics were completed using the package DHARMa [24, Reference Hartig25].
Estimating temporal patterns of antibody detection and shedding
To estimate the timing of detectable seroconversion and duration of pathogen shedding, we used continuous time multi-state Markov models [Reference Jackson26]. This class of models uses observations collected longitudinally on individuals at arbitrary time points as they move through different states to estimate a matrix of transition intensities (instantaneous risk of moving from one state to an alternate state). The transition intensity matrix allows estimation of three parameters of interest: the probability of being in a state at a given time, the expected first transition time from one state to another, and the expected length of time spent in any one state. The Markov model assumes the exact time of state change is unobserved, but that transition to another state depends on the current state; the transition intensities can also be allowed to vary with time or with static and temporal covariates. We fit all Markov models using the package msm for Program R [Reference Jackson27].
To estimate the first time to ELISA-detectable antibody production, we used a three-state Markov model to represent the possible sample results: negative, suspect or positive. We did not allow transition intensities to vary with time due to the limited number of plasma results and inability of the model to converge with time-varying intensities. To determine the extent of the infectious period, we used a two-state model that included the states: shedding (positive nasal swab result) or not-shedding (negative nasal swab result). We estimated six versions of the shedding model, which assumed transition intensities (1) were time-homogeneous, (2) varied by week, (3) varied with tortoise sex, (4) varied with initial disease severity, (5) varied with the timing of seroconversion or (6) varied with infection intensity (oral swab AUC). We compared models with Akaike's information criterion, corrected for a small sample size (AICc, where n = number of independent time series) [Reference Burnham and Anderson28] and ran modified Pearson goodness-of-fit tests [Reference Aguirre-Hernandez and Farewell29] on the highest-ranking model to assess the prediction fits to the observed data using a P-value cutoff of 0.05. Parameters estimated with Markov models are presented with 95% confidence intervals (CIs) based on bootstrapping using 1000 replicates [Reference Jackson27].
Results
In June 2014, one tortoise rapidly developed severe disease and was found dead. We included this individual's early infection response and samples in result descriptions, but omitted its data from statistical analyses. A second tortoise died in May 2017 due to non-health related circumstances. Since this was very near the end of the study we included this tortoise in all analyses and discussions. The colour scheme used in Figures 1 and 2 designates tortoise identities and was consistent to assist comparisons between plots.
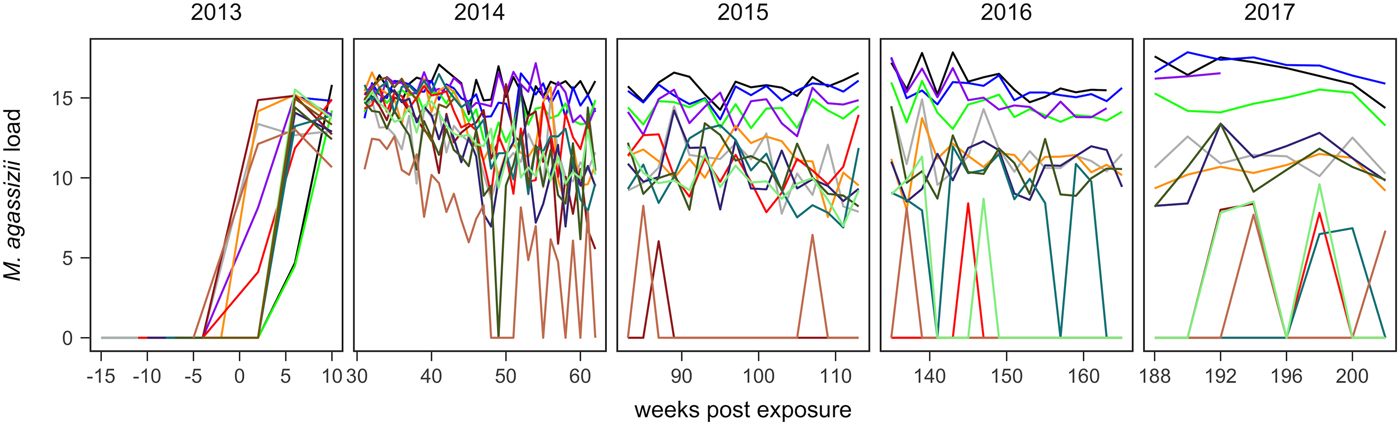
Fig. 1. Time series of Mycoplasma agassizii infection loads in 14 captive desert tortoises before and after initial exposures to an infected host (week 0). Infection load values are the log of 1 plus the mean abundance estimated by three qPCR runs per oral swab. Two time series end in 2014 and 2017 due to mortality.
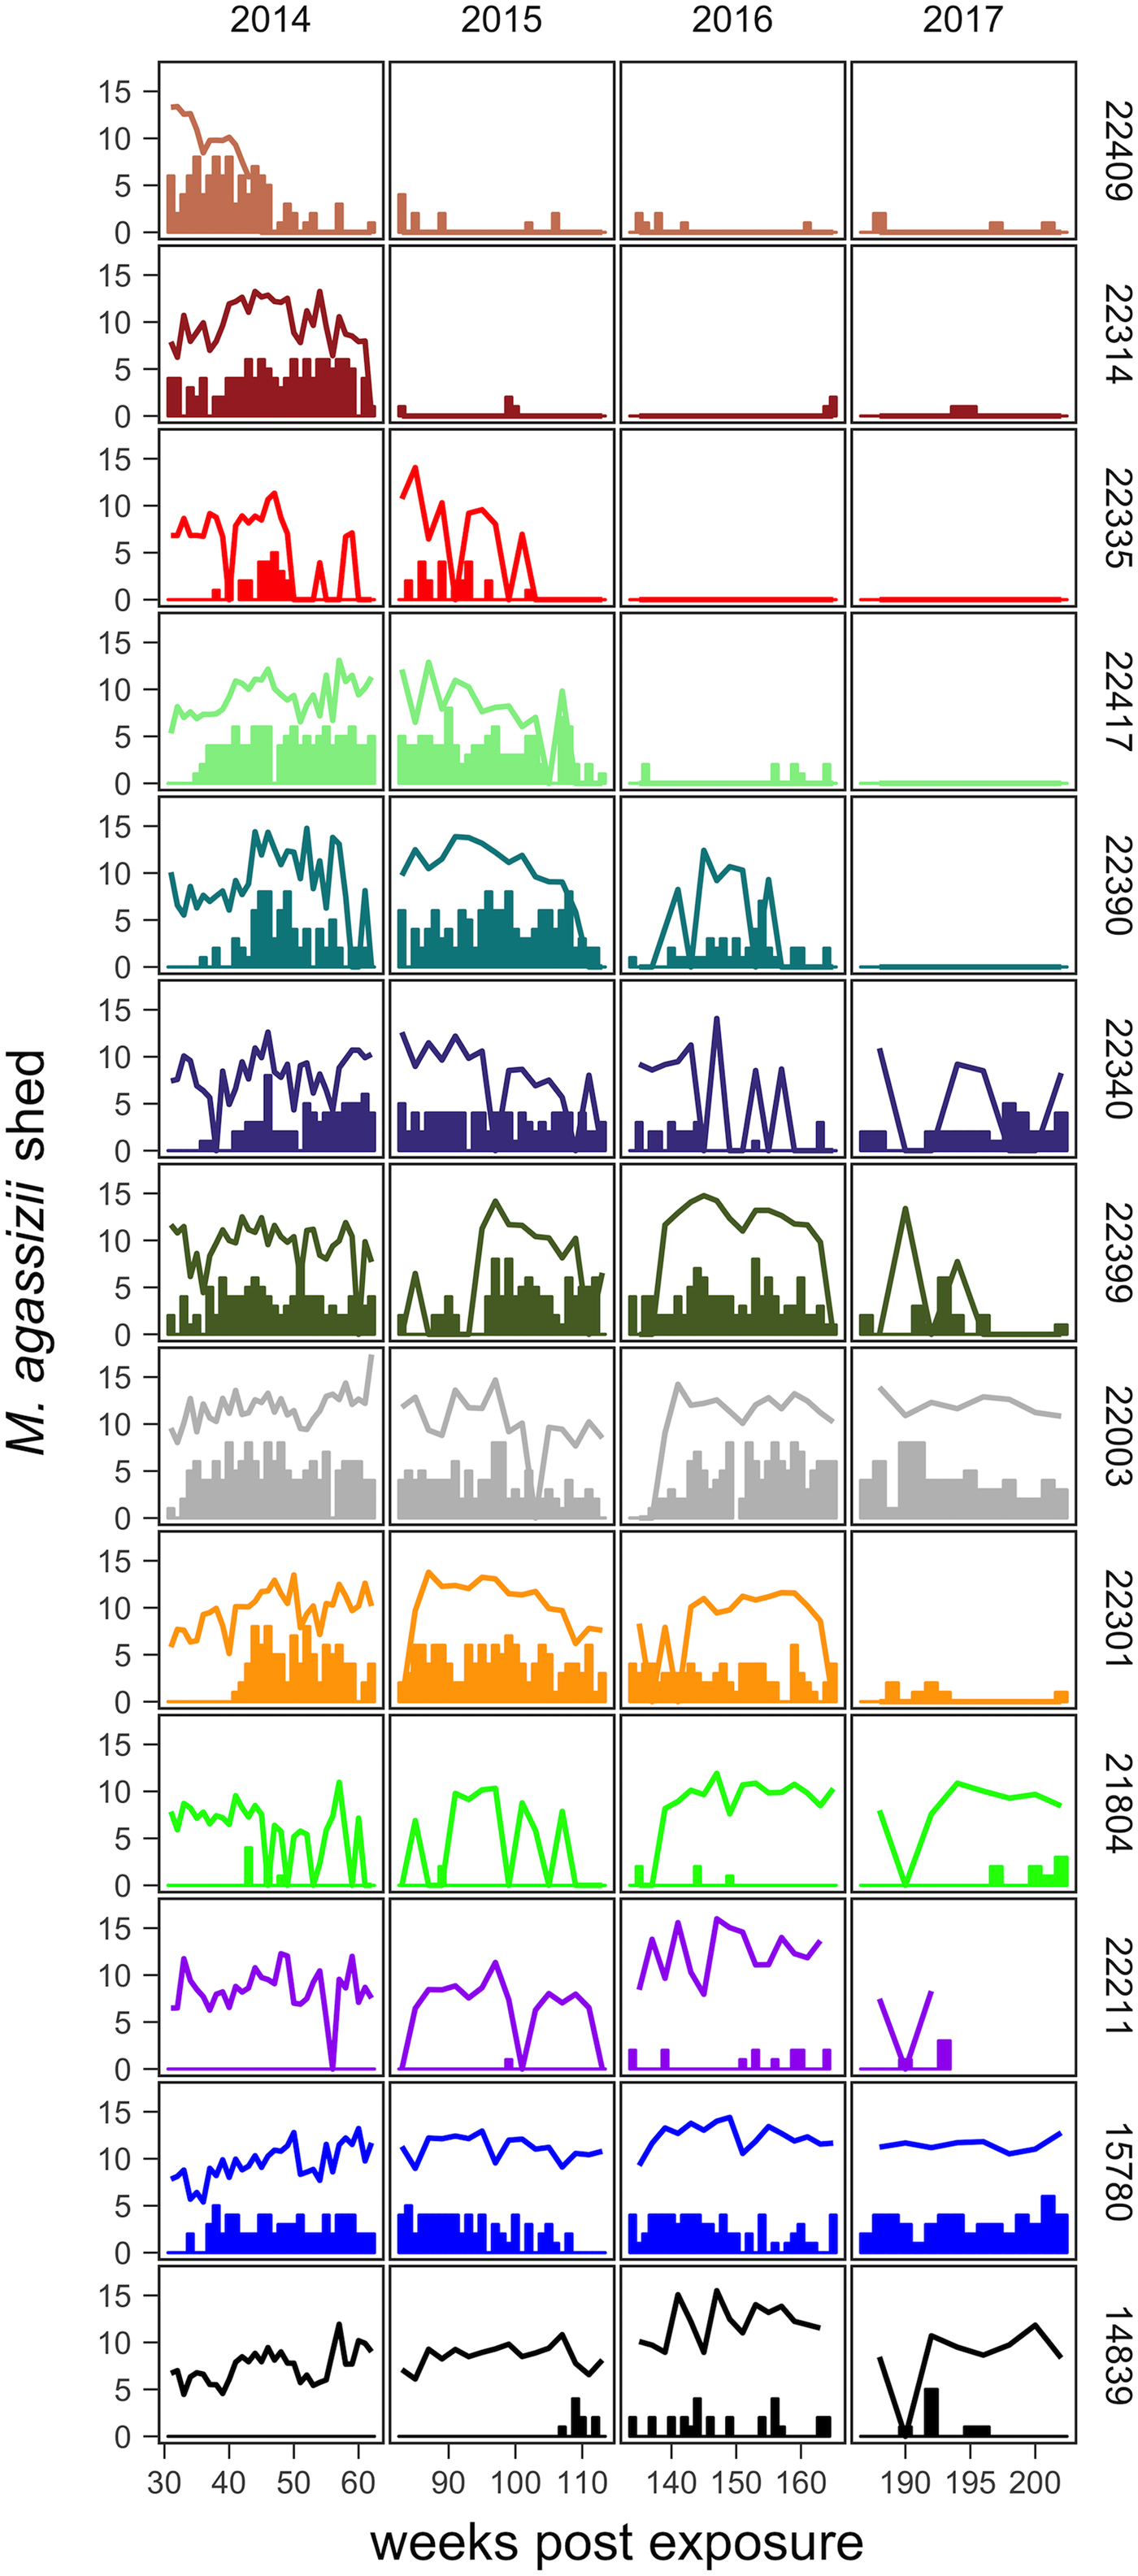
Fig. 2. Time series of Mycoplasma agassizii shedding (lines) and nasal discharge (bars) in 13 desert tortoises newly infected in late 2013. Shedding values shown are the log of 1 plus the mean abundance estimated by three qPCR runs per nasal swab. Nasal discharge scores range from 0 to 8. Each row and colour shows data for a single tortoise (IDs indicated on right side of the plot) and tortoises are plotted from top to bottom in the order of the highest to lowest resistance to infection (i.e. total infection intensities were highest for individuals lowest in the plot).
In the weeks following initial exposure, M. agassizii infection loads initially exhibited exponential growth and appeared to reach asymptotic peaks before tortoises entered winter dormancy (Fig. 1). Throughout 2014, infection loads showed signs of decline in nine of 13 (69%) hosts, with loads then fluctuating around relatively stable means in 2015 (Fig. 1). In 2016, three hosts experienced a second decline in infection load. At various time points, M. agassizii became consistently undetectable in five of 13 (38%) hosts. Though most qPCR results for these five tortoises remained negative, occasional low-load positives suggested they were still infected, but at levels low enough to evade regular detection by oral swab. The mean bacterial abundance per oral swab for these occasional positives ranged from 60–14 727 plasmid copies. At the end of the study, infection loads had diverged into three distinct groups: hosts with low resistance and persistent high loads (n = 4, 31%), hosts with moderate resistance that had reduced loads to intermediate levels (n = 4, 31%) and hosts with high resistance that reduced loads below detection (n = 5, 38%; Table 1).
Table 1. Summary data for tortoises monitored during the establishment of new Mycoplasma agassizii infections acquired through contact with an infected host (donor)

Data were sorted from the lowest to highest oral swab AUC (total infection intensity).
Tissue samples were collected at regular intervals to detect the presence of M. agassizii with qPCR or antibodies to M. agassizii with an ELISA. The presence of new clinical signs of disease were recorded, scored and summed for the first five assessments (early ∑ΔCSI) and for all assessments (∑ΔCSI). Level of pathogen resistance was categorised as low, moderate or high, based on the extent of pathogen load decline during the study (Fig. 1).
* Tortoise found dead May 2017 due to non-disease related circumstances.
** Tortoise found dead June 2014 due to poor health.
The timing and severity of clinical signs of disease during M. agassizii infections varied considerably. During the 10 weeks of exposure, we observed new nasal discharge in five of 14 (36%) tortoises and documented severe clinical signs in three of 14 (21%) tortoises within their first five assessments (Table 1). The percentage of tortoises with nasal discharge steadily increased until reaching peak value (86%) at week 43. We noted tortoises with few to mild signs for the duration of the study (n = 3), moderate to severe signs for a majority of the study (n = 5) and moderate to severe signs lasting 1–2 years (n = 5; Fig. 2).
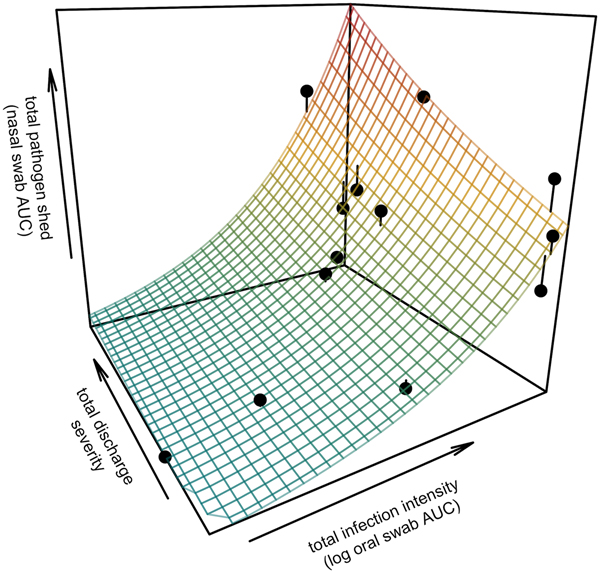
All tortoises showed evidence of shedding M. agassizii in 2014, i.e. consistently positive nasal swab qPCR results. Over the course of the study, seven individuals (54%) ceased shedding detectable amounts of M. agassizii from the nares at various time points – the earliest being 44 weeks and the latest at 194 weeks post-exposure (Fig. 2). At the last health assessment, at 202 weeks post-exposure, five of the 12 (42%) remaining tortoises still showed signs of shedding M. agassizii. In our GLM analysis, the cumulative amount of pathogen shed (nasal swab AUC) by each tortoise was significantly related to the intensity of the infection (log oral swab AUC; β 1 = 1.49, P < 0.001) and the ∑nasal discharge score (β 2 = 0.0015, P < 0.001). Predicted shedding totals from the GLM regression indicated that hosts with the highest shedding output are those that maintain high infections, with shedding potential increasing if hosts also exhibit severe or consistent nasal discharge (Fig. 3). The pattern of state transitions from shedding to non-shedding indicated that transition rates changed over time (Fig. 4a), but were best described by a model that allowed transition intensities to vary with infection intensity (Table 2; modified Pearson test: P < 0.001). The model estimates suggested that hosts with higher resistance to infection, i.e. greater ability to reduce bacterial burdens, transitioned to the non-shedding state faster, and thus had shorter periods of detectable pathogen shedding (Fig. 4b).

Fig. 3. Prediction surface for GLM regression of the total amount of pathogen shed by each tortoise and detected during the study in relation to each host's total infection intensity and discharge severity. Total pathogen shed and infection intensity were estimated using the AUC of all qPCR results from nasal swabs (shedding) and oral swabs (intensity) and discharge severity reflects the summed discharge scores for all visual-health assessments conducted following exposure. Surface plot colour ranges from blue (low pathogen output) to red (high pathogen output). Points show observed data for 13 infected tortoises and lines connecting points to the surface plot indicate the error between the observed and GLM-predicted values. Axes range from the minimum to the maximum of observed values in the study.
Fig. 4. Predictions and 95% CIs of (a) the probability hosts would be shedding over time (based on multi-state models with state transition rates varying by week) and (b) the number of weeks (out of 202 weeks) a tortoise is expected to be nasal swab positive relative to that individual's overall Mycoplasma agassizii infection intensity. Infection intensities were estimated using the AUC of all qPCR oral swab results following exposure and then used to estimate multi-state models with state transition rates that varied with infection intensity.
Table 2. AICc values and weights for multi-state Markov models fit to Mycoplasma agassizii detections on nasal swabs
A two-state model was used to describe qPCR result transitions between positive (shedding M. agassizii) and negative (shedding not detected) over time. Covariates were compared with determine their relative influence on the rate of transition between states.
One tortoise tested ELISA positive for M. agassizii antibodies as early as 6 weeks, but most tortoises showed a longer lag period between exposure and seroconversion with a median of 83 weeks and maximum of 163 weeks. The three-state Markov model provided a good fit to observed ELISA results (modified Pearson test: P = 0.008) and predicted a tortoise's first suspect result would occur at 42 weeks (95% CI 26–88 weeks) and first positive result would occur at 62 weeks (95% CI 45–101 weeks; Fig. 5). Compared with other detection methods, ELISA was the last method to detect M. agassizii infections and required the inclusion of suspect results as a detection to maintain consistent and high detection rates (Fig. 6). As infection loads decreased and clinical signs diminished, ELISA often detected more infections compared with qPCR and observations of nasal discharge.
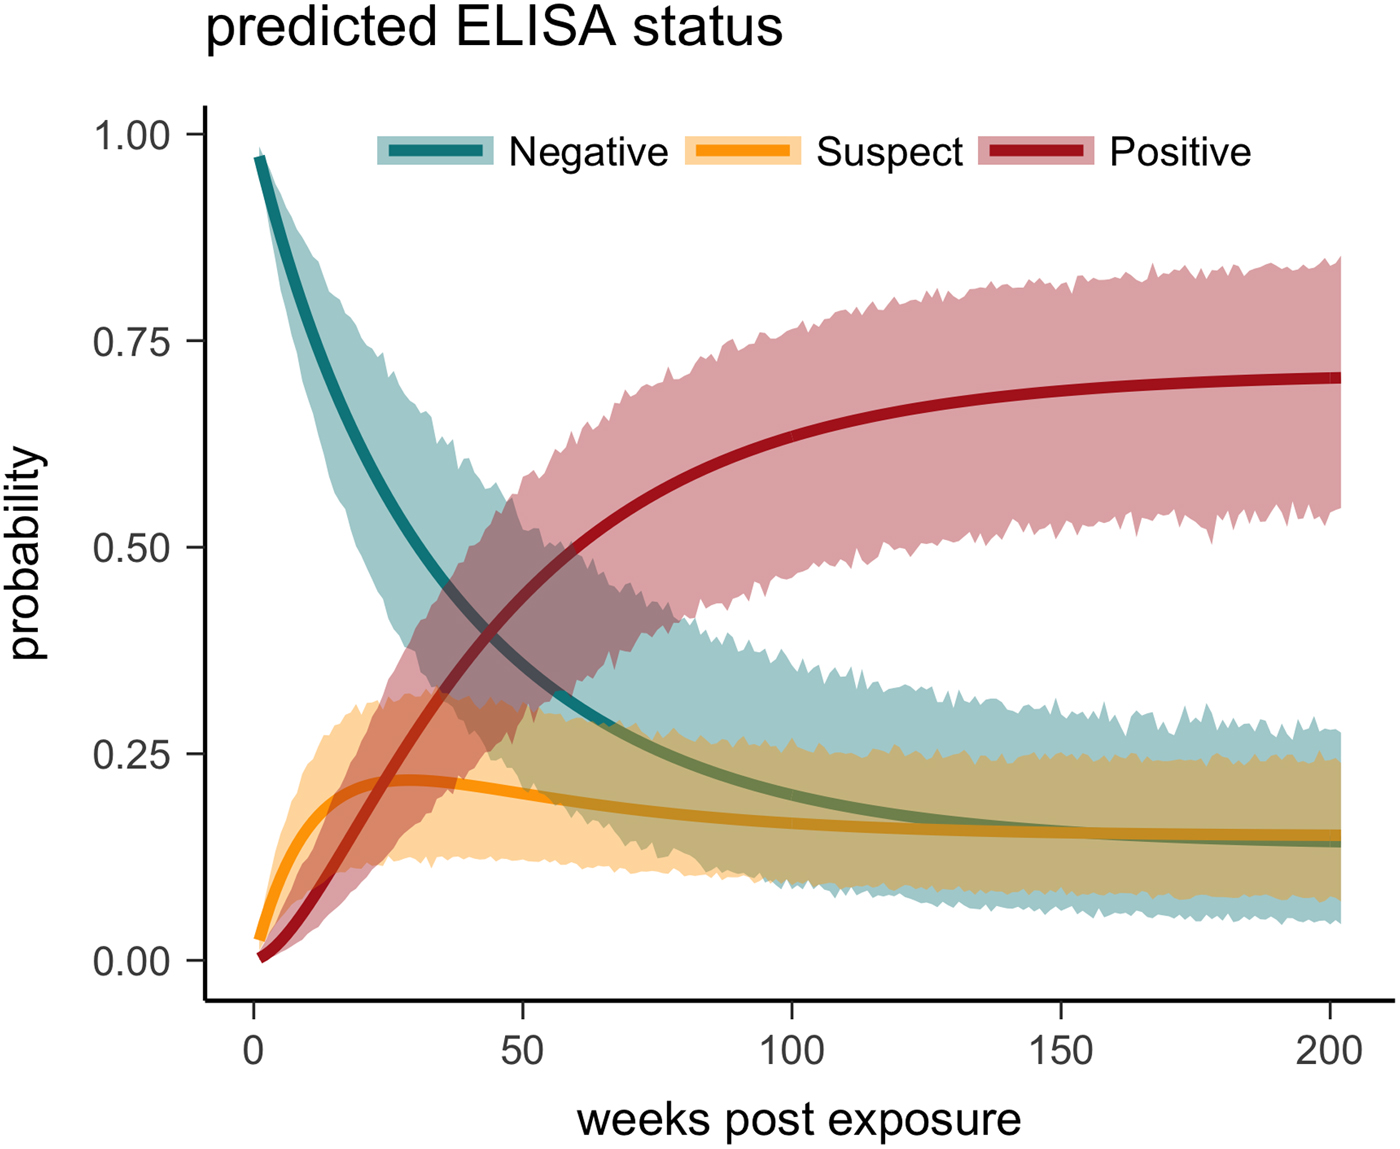
Fig. 5. Multi-state Markov model predictions with 95% CIs of the probability a tortoise will test ELISA negative (turquoise), suspect (yellow) or positive (red) when plasma is sampled over the course of the infection and tested for antibodies to Mycoplasma agassizii.
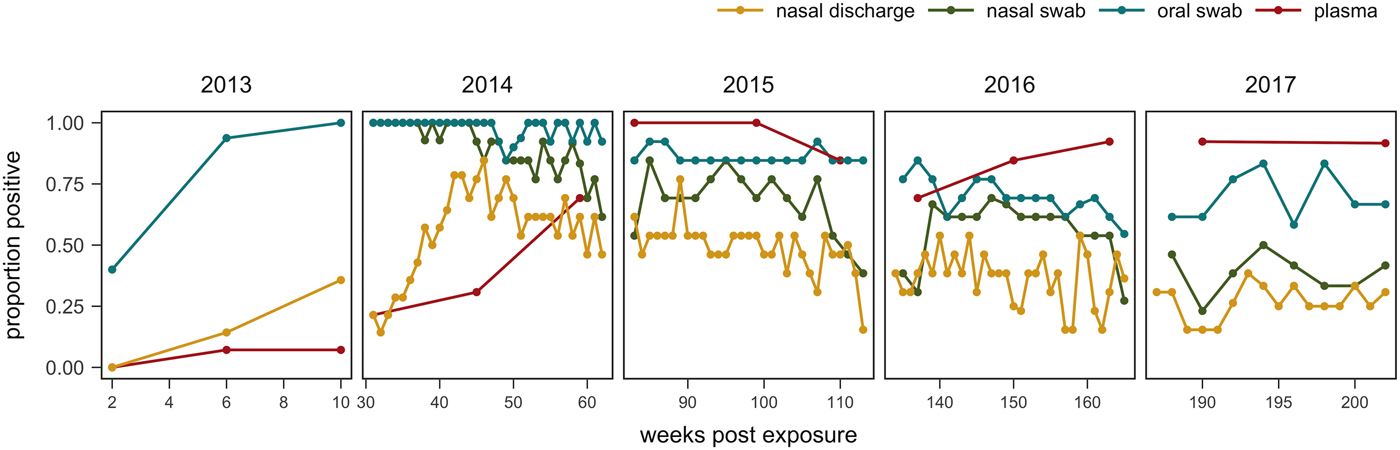
Fig. 6. Proportion of tortoises (weeks 0–43: n = 14; weeks 44–193: n = 13; weeks 194–202: n = 12) with positive evidence of Mycoplasma agassizii infection as determined by observation of nasal discharge during health assessment (yellow), bacteria detected on nasal swab by qPCR (green), bacteria detected on oral swab by qPCR (blue) or antibodies detected in plasma by ELISA (red). Either ‘positive’ or ‘suspect’ ELISA results were considered evidence of infection.
Discussion
URTD progression and consequences for diagnostic testing at the population level
The infection dynamics documented in this study matched many assumptions previously made by Brown et al. [Reference Brown11] regarding URTD progression in this host but include new insights into the timing and variability of host–pathogen interactions throughout the early years of infection. Following initial exposure, we documented the presence of M. agassizii in all tortoises within 10 weeks, suggesting infections had established. Clinical signs typical of URTD appeared with highly variable speed and severity (Table 1, Fig. 2), which occurs in many mycoplasma–host systems and has been attributed to numerous factors [Reference Simecka, Blanchard and Browning30]. Irrespective of the presence of clinical signs, we documented bacterial shedding in all tortoises, though hosts with severe nasal discharge tended to shed greater numbers of bacteria overall (Fig. 3). The adaptive immune response lagged behind infection, shedding and clinical disease, which is consistent with expectations for slow-responding reptile immune systems [Reference Zimmerman, Vogel and Bowden31], but more variable than seroconversions documented after challenge studies [Reference Brown15, Reference Brown16]. After inoculations, desert tortoises seroconverted within 12 weeks [Reference Brown15], while our study estimated an average time to first seroconversion ranging from 45 to 101 weeks post-exposure (26–88 weeks if a suspect result was considered a detection). This discrepancy may stem from the conditions of transmission: inoculations allow a controlled dose to enter the nasal cavity, while transmission through contact may result in lower initial doses. Sandmeier et al. [Reference Sandmeier17] documented seroconversion delays similar to those described here (ranging 2–20 months with a 14.1 month average) when captive tortoises of mixed disease status were allowed to transmit infections through contact. Alternatively, the characteristics of the pathogen or host could account for variation in immune responses as well as variable patterns of infection and clinical signs, which we discuss in more detail below. Regardless of the underlying cause, the delay in seroconversion led to infection misclassification by ELISA when many animals were at peak infection intensity (Figs 1 and 6). In some cases, a detected antibody response coincided with reduced M. agassizii loads that thereafter could not be consistently detected with qPCR.
These data present strong evidence that temporal changes within hosts after infection can affect diagnostic patterns, particularly in chronic and variable diseases such as URTD. These longitudinal dynamics could be one (of several) plausible explanations for the patterns documented in recent cross-sectional surveys for URTD in desert tortoise populations. In Sandmeier et al. [Reference Sandmeier12], many qPCR-positive animals were clinically silent or seronegative, which resulted in qPCR-based prevalence that did not correlate with clinical signs unless low-load positives were excluded, and did not correlate with antibody prevalence. A second analysis found that average population infection intensities were associated with prevalence of both clinical signs and positive qPCR status [Reference Weitzman, Sandmeier and Tracey13]. In the first year after exposure, we observed high M. agassizii loads, consistent positive qPCR results and apparent clinical signs of URTD in infected hosts, which could lead to strong correlations between high-value qPCR results and both prevalence of clinical signs and infection. In early infections, many hosts also lacked detectable antibodies, which could weaken correlations between qPCR and ELISA results, and between ELISA-based prevalence and clinical signs of URTD. Tortoises that substantially reduced bacterial loads after 1–3 years also lacked clinical signs and had inconsistent and often negative qPCR results. Most positive tortoises sampled in Sandmeier et al. [Reference Sandmeier12] exhibited mild visual signs of disease and low infection loads, which may indicate that infections established in years prior to the survey. Low-load infections possibly missed during tissue sampling (e.g. 20 ELISA positive animals were qPCR negative in Sandmeier et al. [Reference Sandmeier12]) could also have influenced observed correlations between population infection intensities and prevalence [Reference Weitzman, Sandmeier and Tracey13]. Alternatively, low-load populations may be in a later stage of disease introduction where most individuals are no longer infectious and transmission rates have slowed compared with recent introductions with potentially more high-load, infectious hosts.
The temporal variation in host status during M. agassizii infections also presents complications when determining the impact of disease on host survival. Most investigations of URTD-related mortality in wild Gopherus spp. populations have used ELISA to categorise host infection status and found inconclusive or variable relationships between serology and survival [Reference McCoy, Mushinsky and Lindzey32–Reference Berish34]. We show here that severe disease can often precede seroconversion, suggesting that the infected hosts at greatest risk of mortality would often be categorised as uninfected by ELISA and so may have confounded previous conclusions about URTD impacts. An assessment of URTD epidemiology in G. polyphemus found that M. agassizii-seropositive tortoises tended to survive at higher rates than seronegative tortoises, but also found that seronegative tortoises experienced higher mortality as population seroprevalence increased [Reference Ozgul33]. In light of our data, we suggest the results of Ozgul et al. [Reference Ozgul33] support the presence of an acute mortality risk following exposure to M. agassizii-infected hosts, but preceding seroconversion. We only observed one disease-related mortality event in this study, and the captive conditions (consistent supply of food and water) prevented any meaningful conclusions relative to disease-induced mortality. We do note that the time period between the onset of apparent disease and death in this case was brief (7 weeks) relative to the common survey intervals of most tortoise populations (seasonally or annually). As with many population trends in desert tortoises, disease dynamics appear to be complex and the product of both fast and slow processes – determining what impacts URTD may have on tortoise recovery will require consideration of these temporally changing host–pathogen interactions.
Multiple studies have now come to the resounding conclusion that URTD surveys should incorporate multiple diagnostic tools because of the possibility of misclassifying infection status [Reference Brown11, Reference Sandmeier12, Reference Sandmeier17]. We also suggest that finer-scale sampling intervals may be necessary to capture certain disease dynamics, such as acute responses to M. agassizii introduction. We highlight that the combined results of multiple diagnostic methods and when possible, multiple sampling events, may provide further value by indicating where hosts lie on the infection timeline and whether they're likely to contribute to onward transmission.
Variable responses may affect both host and pathogen fitness
The patterns exhibited by these hosts suggest that tortoises experience M. agassizii infection in fairly distinct ways, with infection timelines that may be tied to varying host resistance. We conceptualise a set of unique stages of URTD in Figure 7 and the movement of exposed hosts between these stages over time in relation to their ability to lower pathogen burdens. We note that the response-paths described here were the result of exposure to clinically apparent, infectious hosts and may not represent infections acquired from subclinical donors. Alternative paths and URTD stages likely exist, and future transitions to new or previously experienced stages are certainly a feature of this potentially life-long disease. Therefore, we propose these delineations as a starting point to model URTD dynamics and compare expectations to disease patterns in wild populations. Each of these response timelines implies various risks and benefits to both host and pathogen that could influence population disease dynamics.
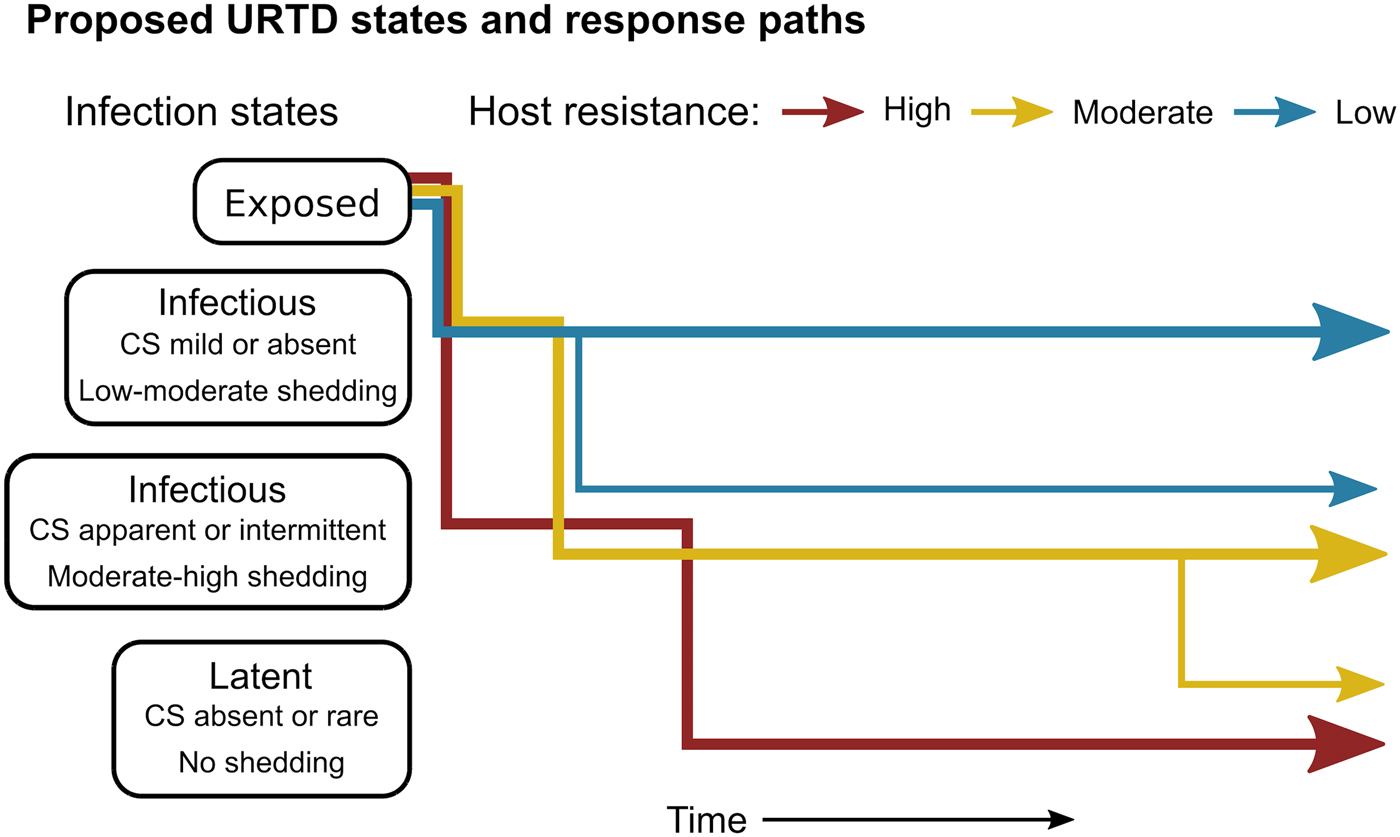
Fig. 7. Conceptual model of host-level URTD dynamics for desert tortoises newly infected with Mycoplasma agassizii based on the responses observed in 13 tortoises over 202 weeks. After exposure and initial latency, tortoises moved into different states characterised by shedding pattern and presence and severity of clinical signs of disease (CS). Tortoises varied in their ability to reduce pathogen burdens (resistance), which appeared to influence their infection path, i.e. which states they experienced, and the length of time spent in each state. Wider lines indicate that more tortoises within a resistance category followed that response path.
Tortoises that showed signs of greater M. agassizii resistance [Reference Medzhitov, Schneider and Soares35] (Fig. 1), often developed early and severe clinical signs – a likely consequence of the autoimmune features of URTD (Table 1) [Reference Simecka, Blanchard and Browning30]. However, resistant hosts spent less time in this clinically apparent and highly infectious state relative to less-resistant hosts, and transitioned into a latent, and possibly non-infectious state thereafter (Figs 2 and 7). This response path may include costs as present data indicate female tortoises may temporarily cease reproductive output during initial periods of severe clinical disease [Reference Rostal, Rostal, McCoy and Mushinsky36]. Further and formal investigation of this relationship could provide important insight into the existence of trade-offs relative to infection response. At the other extreme, tortoises that appeared less resistant, i.e. they maintained high M. agassizii burdens, generally developed very few or mild clinical signs (Fig. 2). These hosts may avoid early mortality risks or temporary loss of reproductive output associated with an over-active response, but it is unclear whether sustained, high infection loads impact host fitness in the long-term.
The different infection timelines in Figure 7 also suggest some important differences in parameters that influence the pathogen's ability to persist and spread to new hosts. As tortoise resistance to infection decreased, the period of detectable pathogen shedding lengthened (Fig. 4b). This may indicate a benefit to the pathogen, but also a cost. Persistent high-load infections often lacked consistent or severe discharge, suggesting that these hosts may often be less infectious than clinically severe hosts (Fig. 3), though for much longer periods (Figs 2 and 7). Though we cannot definitively conclude that bacteria detected on nasal swabs were viable, our prior analysis of M. agassizii transmission patterns implies higher qPCR values indicate greater infectiousness [Reference Aiello18]. Subclinical hosts have initiated URTD outbreaks in captivity, demonstrating their infectiousness [Reference Sandmeier17, Reference Rostal, Rostal, McCoy and Mushinsky36], but captive situations may inflate contact between hosts and promote transmission even at low shedding rates.
Wild tortoise populations generally exhibit low connectivity and brief, interspersed contacts [Reference Aiello18, Reference Aiello37] suggesting intermediate host resistance may be most beneficial to M. agassizii transmission. These hosts tended to exhibit both long periods of shedding and apparent and frequent nasal discharge (Figs 2 and 7), which may facilitate transmission when infrequent contacts do occur. Multi-year infectious periods would also improve pathogen spreading potential within populations and increase the chances of dispersal to distant populations [Reference Cross38]. Long-distance dispersal events in tortoises appear rare, but occur with enough frequency to genetically mix fairly large regions of the tortoise range [Reference Hagerty and Tracy39]. Regardless of the type of response, all infections showed evidence of persistence beyond the study, which allows for future reactivation of discharge and shedding. The potential for prolonged infectious periods and recrudescence likely contributed to the widespread distribution and high prevalence of M. agassizii infections found in recent surveys [Reference Weitzman, Sandmeier and Tracey13].
Possible outcomes beyond initial years of infection
Given the chronic nature of M. agassizii infections, this framework is limited by the lack of data beyond the observed 202 weeks of infection. Considering the patterns observed thus far and existing knowledge of URTD, we suggest a number of outcomes are plausible for these infections in the years following the study. When we modelled transition rates from shedding to non-shedding status as a function of time since exposure, the model predicted all animals would cease shedding by approximately 400 weeks (Fig. 4a). However, host resistance may play a large role in determining shedding duration (Fig. 4b). Tortoises with intermediate resistance will likely further reduce their bacterial loads and cease shedding – we saw indications of this at the end of the study (i.e. less-frequent shedding in 2017, Fig. 2). The future state transitions of less resistant hosts are difficult to predict as the condition of hosts within this group remained relatively consistent throughout the study.
Tortoises that did decrease infection loads below detection remained subclinical and lacked signs of shedding for the remainder of the study. Once hosts reach this state, the chances of remaining there likely depend on the conditions experienced thereafter. Secondary exposures to M. agassizii have triggered rapid and clinically severe disease in Gopherus hosts [Reference Jacobson10], which suggests that tortoises in a low-load, clinically silent state may re-start the infection timeline upon re-exposure. In the absence of secondary exposure, recrudescence can still occur [Reference Sandmeier17]; a crucial step in URTD research will be to investigate the factors that trigger reactivation of clinical disease and pathogen shedding. The range-wide study of Weitzman et al. [Reference Weitzman, Sandmeier and Tracey13] indicates that M. agassizii infections are more prevalent than expected in tortoise populations, but often in a subclinical state. With the anticipated changes in climate and drought patterns in the Mojave [Reference Seager40, Reference Cayan41] and the suspected (but unstudied) influence of environmental stress on URTD severity [Reference Brown11], tortoise populations could be at risk of future outbreaks or of compound effects of disease and other population stressors.
Sources of infection variation
Studying within-host dynamics in captivity allowed consistent and detailed documentation of disease, but the use of captive tortoises presents many uncontrolled variables that could have influenced our results. These infections resulted from contact with eight male tortoises randomly chosen from a pool of qPCR positive and symptomatic captive tortoises. The original infected hosts acquired M. agassizii infections from unknown sources and thus the pathogen strain and possible co-infections transmitted in this study were unknown. Mycoplasmas, like other pathogens, can vary in virulence and their ability to evade or influence the host immune system [Reference Brown16, Reference Simecka, Blanchard and Browning30]. Despite the unknown strain-types used here, we suspect that pathogen strain was not the only factor influencing the observed infection dynamics. Several challenge studies that have controlled for Mycoplasma spp. strain in multiple host species have documented highly variable responses to infection [Reference Grodio5, Reference Brown15, Reference Sydenstricker42]. Another potential contributing factor may have been the presence and transmission of other organisms or particulates along with the pathogen during host contact. Inoculations with infected donor exudate have caused more severe URTD in tortoises than pure M. agassizii culture [Reference Brown15], which suggests virulence may be influenced by co-infections or other exudate-borne materials. There were not enough replicates per donor host in this study to determine whether infection patterns were associated with the source of the infection, but we note that tortoises exposed to the same infected host followed very different infection timelines and patterns in multiple instances (Table 1).
Similarly, the naïve tortoises infected in our study came from an existing pool of captive tortoises with variable and unknown histories. We tested tortoises for evidence of prior exposure to M. agassizii and M. testudineum; however, some tortoises could only be sampled once prior to exposure. One tortoise in this study mounted a very rapid and robust immune response, which may indicate prior but undetected exposure to M. agassizii [Reference Jacobson10, Reference Simecka, Blanchard and Browning30]. Though these tortoises lacked overt signs of URTD or poor health, the presence of other abnormal conditions cannot be ruled out and may have had unknown effects on M. agassizii infections. Many clinical signs associated with mycoplasmosis are attributed to immunopathology [Reference Simecka, Blanchard and Browning30], so the mechanisms underlying response variation may be rooted in differences in immune function [Reference Simecka, Blanchard and Browning30, Reference Medzhitov, Schneider and Soares35, Reference Hurtado43]. Innate and adaptive immune responses may be genetically based, but may also be affected by host condition at the time of infection [Reference Hawley and Altizer3]. For example, hosts immunosuppressed from chronic stress or poor nutrition, perhaps in response to extended captivity, may be incapable of effectively resisting invading pathogens [Reference Buehler, Piersma and Tieleman44, Reference de Assis45]. Our lack of detailed knowledge of both host and pathogens used in this study limits our inference regarding the role of initial conditions on observed infection patterns.
The temporal trends characterised here also represent a subset of all potential outcomes, as wild tortoises will generally experience much more environmental fluctuation throughout the lifetime of their infection. In this study, we provided captive tortoises with consistent food, water and shelter, while restricting available habitat and physical interaction between tortoises. Variation in nutritive, hydric, environmental and social stressors on the host throughout the course of an infection may produce different patterns in the severity and timing of infection loads and clinical disease [Reference Vale, Choisy and Little46–Reference Kock48]. Forage availability and nutritive quality as well as drinking opportunities show stark variation between seasons and years within G. agassizii home ranges [Reference Esque, Drake, Nussear, Rostal, McCoy and Mushinsky49], which has important effects on tortoise health and immune function [Reference Nagy and Medica50, Reference Drake51]. Changing external (e.g. resources, predators) or internal (e.g. testosterone levels) conditions also coincide with shifts in tortoise behaviour (e.g. burrow-use patterns, aggression [Reference Rostal, Rostal, McCoy and Mushinsky36, Reference Duda, Krzysik and Freilich52, Reference Nafus, Germano and Swaisgood53]) that can affect the microenvironment experienced by the host or stimulate social interactions that require energy expenditure [Reference Zimmerman54–Reference Lane56]. Our methods prevented many of these situations, and so do not incorporate the potential influence of these factors on host and infection status. Investigating how M. agassizii infections respond to heterogeneous conditions within and across individuals and habitats will be an important next step in URTD research. The data from this captive and environmentally controlled study could act as a useful reference, and we encourage further longitudinal data collection from wild hosts to facilitate comparisons of infection characteristics produced under different scenarios.
Conclusion
The dynamics of URTD and M. agassizii infections within hosts have not been characterised in detail beyond the first year of infection. Many assumptions regarding the temporal patterns of this disease have thus been based on data from mycoplasma infections in other host species and situations where tortoises have been sampled at large temporal intervals. This longitudinal study provides support for many existing assumptions but also sheds new light on how variable responses to infection and infection patterns over time may influence disease patterns observed in wild tortoise populations. The insights gained here and the relative ease and low cost of qPCR point to new and exciting opportunities for URTD research beyond presence/absence. This study highlights the importance of understanding the timing and heterogeneity of within-host processes in order to elucidate larger-scale dynamics such as between-host transmission and population-level prevalence. Future studies investigating the factors influencing infection variation in tortoises could prove valuable to characterising disease dynamics and estimating long-term impacts in this species.
Supplementary material
The supplementary material for this article can be found at https://doi.org/10.1017/S0950268818002613
Acknowledgements
We thank A. Berger, S. Bardot, A. Grajal-Puche, J. Jozkowski, J. Lopez, R. Moylan and M. Walden as well as numerous SCA interns and volunteers for their contributions to data collection; J. Braun and A. Preston for managing lab work; R. Averill-Murray, K. Fields, A. Walsh and San Diego Zoo and DTCC staff for logistical support; F. Sandmeier and two anonymous reviewers for insightful suggestions that improved this manuscript. The content of this paper was stimulated by the collaboration and discussions of members of the desert tortoise disease assessment workgroup including N. Lamberski, B. Rideout, J. Simecka, R., Swaisgood, C.R. Tracy and several others.
Financial support
This work was supported by the National Science Foundation Ecology of Infectious Diseases (Grant #1216054) and T.C.E. and C.M.A. received support from the US Geological Survey Western Ecological Research Center. Any use of trade, product or firm names is for descriptive purposes only and does not imply endorsement by the US Government.


 Open access