


Healthy ageing is the process of developing and maintaining the functional ability that enables well-being in older age, which can be achieved by preventing chronic disease and maintaining physical and mental functions throughout life(1). Given that common chronic conditions, such as obesity, CVD, diabetes and cancer, are related to nutritional factors, having a balanced and healthy diet that provides enough energy to meet daily demands is vital to achieve these goals(Reference Critselis and Panagiotakos2).
Oral health is an essential component of general health and plays an important role in healthy ageing(Reference Meurman, McKenna and Murtomaa3). However, three recent systematic reviews provided inconclusive evidence for the association of mastication(Reference Tada and Miura4), tooth loss(Reference Gaewkhiew, Sabbah and Bernabe5) and oral function(Reference Kiesswetter, Poggiogalle and Migliaccio6) with dietary and nutrient intake among independently living older adults. Most studies identified were cross sectional and used the count of teeth (either self-reported or clinically determined) which does not accurately reflect the distribution of teeth within the mouth and their functioning(Reference Kayser7). A functional dentition (FD), i.e. one that consists of all six anterior occlusal contacts and at least four (out of a maximum of sixteen) posterior occlusal contacts, allows individuals to satisfy masticatory, appearance, comfort and social requirements(Reference Witter, van Palenstein Helderman and Creugers8). The only previous longitudinal study measuring FD found greater reductions in intake of nutrients (protein, fibre, vitamins A and E, Ca, Na and K) and food groups (vegetables and meat) after 5 years among Japanese older adults without FD than among those with FD(Reference Iwasaki, Yoshihara and Ogawa9).
A possible explanation for these inconclusive findings has to do with the emphasis on the role of single nutrients (protein or fibre) or foods (fruits and vegetables) over the role of the entire diet of individuals(Reference Hu10,Reference Tucker11) . A whole diet assessment can better explain habitual food consumption because humans consumed foods as a combination or a variety of foods(Reference Tucker11). The analysis of DP recognises the complexity of diets, potential additive effects between different food groups, as well as the variability in DP existing within and between populations(Reference Hu10). DP can be derived either a priori or a posteriori (Reference Burggraf, Teuber and Brosig12). The a priori approach evaluates the healthiness of the diet based on current nutrition guidelines, which are then aggregated to produce a summary measure of dietary quality of individuals(Reference Waijers, Feskens and Ocké13). The a posteriori approach is based on multivariate data reduction techniques that reveal underlying common food consumption patterns(Reference Newby and Tucker14). There is growing evidence that a diverse diet may help prevent chronic conditions(Reference Asghari, Mirmiran and Yuzbashian15,Reference Kant16) . However, to the best of our knowledge, no previous dental study has explored whether FD can play a role in explaining DP. To fill this gap in knowledge, a study was conducted to investigate the association between FD and changes in DP among Thai older adults.
Methods
This report is based on data from a 12-month prospective study conducted among older adults in Phetchaburi province, Thailand. All participants signed a written informed consent.
Study population
In 2018, health authorities in four of the eight districts in Phetchaburi agreed to participate in the study. In these four districts, six urban and eleven rural sub-districts (out of sixteen and thirty nine, respectively) agreed to participate. Overall, 788 Thai adults, aged 60 years and over, were recruited (97 % response rate) via social media websites and community meetings. Participants were included if they were Thai nationals, registered with the healthcare system and had scores ≥8 in the Abbreviated Mental Test Score(Reference Hodkinson17) and ≥12 in the Activities of Daily Living index(Reference Katz, Ford and Moskowitz18). Both instruments are routinely used in primary care in Thailand. Participants were excluded if they could not communicate or had disabling conditions. All participants were invited to a follow-up survey a year later, of which 651 participants were re-assessed (83 % retention rate). The mean follow-up time was 11·6 months (sd: 0·8, range: 10–13).
A minimum sample of 298 participants (60 with and 238 without FD) was required to estimate a moderate size effect (standardised mean difference of 0·50 units between groups), assuming the outcome was measured over two time points, the correlation between outcome measurements was high (r = 0·90), 95 % CI and 80 % statistical power(Reference Guo, Logan and Glueck19). Sample size was increased to 373 (75 exposed and 298 unexposed) to compensate for a possible attrition rate of 25 %.
Data collection
Data were collected in primary healthcare centres via dental examinations at baseline and questionnaires at baseline and follow-up. The questionnaire collected information on demographic characteristics (sex, age and residence area), socio-economic circumstances (education and wealth index), behaviours (smoking status and physical activity) and chronic conditions. Ownership of ten household assets (air conditioner, bed, car, boiler, kettle, flushing toilet, house telephone, microwave, personal computer and washing machine) was assessed to derive the wealth index. Principal component analysis was used to extract the first common factor, which was subsequently used to obtain the wealth score and recoded it into quartiles(Reference Gaewkhiew, Sabbah and Bernabé20). Smoking status was determined with three questions on current and past cigarette consumption, from which participants were classified as never, former and current smokers(21). Physical activity was determined with four questions on weekly frequency of strenuous, moderate, mild and walking exercise. Responses were used to obtain a weighted measure of overall metabolically adjusted exercise-related physical activity, calculated as 2 × strenuous + moderate + mild + walking exercise sessions(Reference Banks, Lim and Seubsman22). Participants’ physical activity was classified as 0–6, 7 and 8 + sessions/week. Participants also reported whether they have ever been diagnosed with hypertension, hyperlipidaemia and diabetes, which are the three most common chronic conditions among older adults in Thailand(Reference Aekplakorn, Pakcharoen and Thaikla23). If a condition was reported, information on any medications taken was also collected from participants.
The questionnaire also included a 154-item semi-quantitative FFQ to assess intake of food and beverages in the last month. The FFQ was specifically devised for use among Thai older adults(Reference Banjong, Chitchaeng and Rojroongwasinkul24). The Thai elderly-FFQ was validated by comparing total energy intake and intake of protein, fat, Ca and Fe against 3 d of 24-h dietary recalls. The Spearman’s correlation coefficients between the two methods were 0·83 for energy, 0·69 for protein, 0·42 for fat, 0·47 for Ca and 0·28 for Fe(Reference Chawaratrungsun25,Reference Phromma26) . It covered fifteen main dietary groups: (1) rice/carbohydrate-based dishes and ready meals; (2) beans and tofu products; (3) fresh and processed vegetables; (4) fresh and processed fruits; (5) meat and meat products; (6) fish and seafood; (7) egg and egg products; (8) insects; (9) milk and dairy products; (10) beverages and drinks; (11) sweet snacks and desserts; (12) snacks containing legumes, beans and seeds; (13) sauces and seasonings; (14) chilli paste and other pastes and (15) Thai curry and soups. For each food item, participants reported their frequency of consumption using seven-point ordinal scales (from never to three or more times a d) and portion size using seven-point ordinal scales (from a quarter of a portion to two standard portions). They were assisted to estimate portion sizes using pictures of portion sizes and cooking measurements. The fifteen FFQ groups were further divided to create twenty-two food groups based on their similar nutrient profile, culinary use and previous studies in Thailand(Reference Aekplakorn, Satheannoppakao and Putwatana27,Reference Papier, Jordan and D’Este28) . All food groups with their constituent food items are shown in the Appendix. Daily servings were estimated by multiplying portion size and frequency of consumption of food items. These were then summed across all items within a group to reflect participants’ habitual consumption of that food group. Intake of food groups (servings/d) was estimated at baseline and follow-up separately.
Dental examinations were conducted to determine the number of functional tooth units (FTU), the condition of teeth and dentures. Two trained dentists examined participants on mobile dental chairs, under artificial light and using a mouth mirror and periodontal probe. An FTU was recorded as present if there were opposing teeth (natural or replaced with fixed prostheses). Opposing molars (including wisdom teeth) counted as two FTU, whereas premolars, canines and incisors counted as one FTU each. Dental caries was diagnosed according to the WHO criteria(29). In addition, teeth with severe mobility (i.e. >2 mm of buccolingual or any vertical movement(Reference Grace, Smales, Grace and Smales30)) were recorded. Removable complete and partial dentures were recorded as present if they were worn on the day of the examination and reported to be worn while eating food. FD was defined as having all six anterior FTU plus at least four (out of a maximum of sixteen) posterior FTU. An FTU was not counted as part of the ten or more FTU needed if it had a tooth with severe caries (root remnants) or severe mobility(Reference Gaewkhiew, Sabbah and Bernabé20,Reference Gaewkhiew, Sabbah and Bernabe31) . Participants’ dentition was classified as functional, non-functional with dentures and non-functional without dentures (reference group for comparisons).
Statistical analysis
All analyses were conducted in Stata 16 (Stata Corp.). We first compared participants who were successfully retained after 12 months with those lost to follow-up, using χ 2 test. We then compared the socio-demographic characteristics, behaviours, chronic conditions and medications taken between the three FD groups, using the χ 2 test. Thereafter, the association between baseline FD (exposure) and changes in intake of food groups (outcome) was evaluated in adjusted linear regression models. The adjusted models included controls for baseline socio-demographic characteristics (age groups, gender, residence area, education and wealth quartiles), behaviours (smoking status and physical activity), chronic conditions (hypertension, hyperlipidaemia and diabetes), medications taken, total energy intake and food group intake.
We used applied scores to estimate changes in DP over time(Reference Northstone and Emmett32,Reference Elstgeest, Mishra and Dobson33) . This approach is useful in longitudinal studies where the number of factors extracted and factor loadings would certainly change(Reference Northstone and Emmett32). Indeed, we identified different DP at baseline ad follow-up in terms of factors extracted, food groups describing them and size of factor loadings. Three steps were followed. First, exploratory factor analysis of the baseline intake of twenty-two food groups was conducted to identify food groups that loaded highly (factor loadings > 0·25) on a factor. The number of factors was determined based on an eigenvalue > 1, the scree plot and interpretability(Reference Hu10,Reference Tucker11) . Factors were rotated with an orthogonal (varimax) rotation to minimise correlation between factors and improve interpretability(Reference Tucker11,Reference Newby and Tucker14) . Second, standardised factor scores for DP were computed by adding intakes of food groups weighted by their factor loadings. Third, applied dietary pattern scores at follow-up were calculated by multiplying each participant’s intake of food groups at follow-up, which was standardised to the mean and sd of baseline intakes, by the coefficients from the factor analysis of baseline data, and summing across all food groups. With applied scores, the changes in factor scores reflect actual differences in the intake of food groups within the factor (dietary pattern) rather than a change in the participants’ position relative to the group average intake(Reference Togo, Osler and Sørensen34).
The crude and adjusted association between baseline FD (exposure) and changes in dietary pattern scores (outcome) was tested in linear regression models. The adjusted models included controls for baseline socio-demographic factors, behaviours, chronic conditions, medications, total energy intake and dietary pattern score.
Results
Six hundred and fifty one of the 788 participants at baseline were retained after 12 months. Participants lost to follow-up were significantly more likely to be men, from rural areas, smokers and non-diabetic as well as less likely to take multiple medications than those retained in the sample. In all, 14·1 % of participants had FD, 20·1 % had non-FD with dentures and 65·7 % had non-FD without dentures. The comparison of baseline characteristics by FD groups is shown in Table 1. Participants who had non-FD without dentures were older and took more medications than those in the other two groups. No other differences between the three FD groups were noted.
Table 1 Comparison of socio-demographic characteristics, behaviours and chronic conditions by functional dentition (FD) groups (n 651)
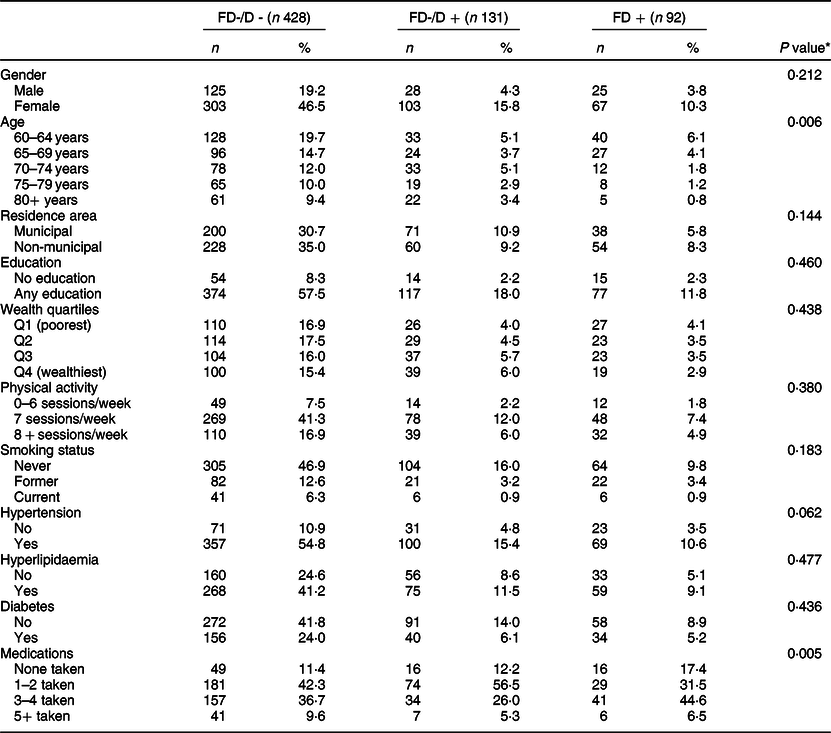
FD−/D−, non-FD without dentures; FD−/D+, non-FD with dentures.
* χ 2 test was used for comparisons.
Table 2 shows average changes in daily intakes for twenty-two food groups by FD groups. Of the twenty-two groups assessed, FD was associated with intake of vegetables only. Participants with FD at baseline had larger increases in intake of vegetables than those who had non-FD without dentures (1·33 v. 1·14 servings/d). This association remained significant after adjustments for confounders (adjusted regression coefficient: 0·16; 95 % CI: 0·04–0·28).
Table 2 Comparison of 12-month changes in daily intake (servings/d) of 22 food groups by functional dentition (FD) groups in Thai older adults (n 651)

FD−/D−, non-FD without dentures; FD−/D+, non-FD with dentures.
* Linear regression model was fitted for each food group separately.
† Regression coefficients (Coef.) were adjusted for baseline age groups, gender, residence area, education, wealth quartiles, smoking status, physical activity, hypertension, hyperlipidaemia, diabetes, medications, total energy intake and food group intake.
Three DP were identified through factor analysis of the intake data at baseline (Table 3), which explained 24·2 % of the variance in the twenty-two food groups. Pattern 1 was consistent with a healthy diet (i.e. it included high factor loadings for vegetables, fish and fermented fish/soybean, fruits, poultry, animal organs and fatty meat), pattern 2 was consistent with a diet rich in meat (positive loadings for red meat, poultry, processed meat, fatty meat, eggs, milk, shellfish and squid, food with coconut milk and negative loading for soymilk) and pattern 3 was consistent with a diet rich in carbohydrates (positive loadings for noodles, food with coconut milk, fruits, fried food and sweet snacks and negative loading for rice).
Table 3 Rotated solution from factor analysis of twenty-two food groups among Thai older adults (n 651)*
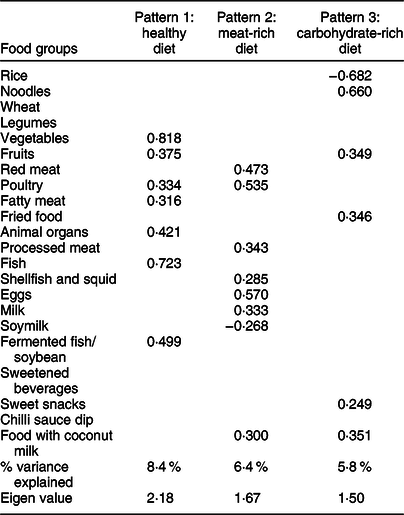
* Factor analysis was used to determine the number of patterns to be retained.
The factor loadings in Table 3 were used to estimate changes in DP using applied scores. Overall, there were increases in intakes of the healthy (0·21; 95 % CI: 0·09, 0·31) and carbohydrate-rich diets (0·60; 95 % CI: 0·48, 0·71) but no changes in intake of the meat-rich diet (−0·11; 95 % CI: −0·24, 0·01). Table 4 shows the association between baseline FD and changes in dietary pattern scores. Participants with FD had larger increases in intake of the healthy (0·13; 95 % CI: −0·13, 0·39) and carbohydrate-rich diets (0·12; 95 % CI: −0·17, 0·40) as well as larger reductions in the intake of the meat-rich diet (−0·12; 95 % CI: −0·45, 0·21) than those who had non-FD without dentures. However, these differences were not statistically significant.
Table 4 Regression models for the association between baseline functional dentition (FD) and 12-month changes in dietary pattern scores among Thai older adults (n 651)*
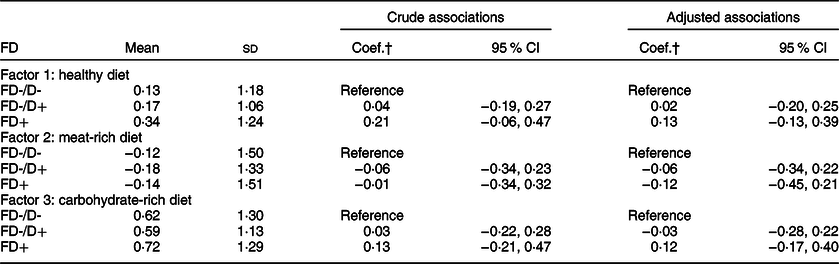
FD-/D-, non-FD without dentures; FD-/D+, non-FD with dentures.
* The adjusted coefficients were controlled for baseline age groups, gender, residence area, education, wealth quartiles, smoking status, physical activity, hypertension, hyperlipidaemia, diabetes, medications, total energy intake and dietary pattern score.
† Linear regression was fitted for each dietary pattern separately, from which regression coefficients (Coef.) were reported.
Discussion
This 12-month longitudinal study provided little support for the relationship between FD and changes in DP in a sample of Thai older adults. While our analysis by single food groups revealed an association between baseline FD and changes in intake of vegetables after adjustment for confounders, our analysis of the whole diet of participants could not replicate such a finding.
The lack of association between FD and most individual food groups was not surprising. A recent systematic review of longitudinal studies found no consistent associations between tooth loss and consumption of food groups across the eight studies included(Reference Gaewkhiew, Sabbah and Bernabe5). This finding agrees with two previous studies where adults with impaired dentition (≤5FTU) had greater declines in intake of vegetables and those with <21 teeth had lower future intake of vegetables(Reference Logan, McEvoy and McKenna35) than their corresponding counterparts. Taken together, these findings build evidence on the nutritional pathway (from missing teeth to unhealthy diet to chronic conditions) that has been proposed to explain the links between oral health and chronic conditions.
Our whole diet assessment, using factor analysis, identified three mutually exclusive (uncorrelated) DP that characterised participants’ diet. These patterns were consistent with those reported in previous analysis of Thai nutrition surveys(Reference Aekplakorn, Satheannoppakao and Putwatana27,Reference Papier, Jordan and D’Este28) . These similarities are noteworthy given the variations in the length of the FFQ (much shorter in previous studies) and the age of participants (middle-aged adults in previous studies) among studies. Unlike younger generations in Thailand who have been more exposed to a Western diet due to globalisation, older adults still rely on traditional diets based on starchy staples and fibre-rich foods (especially those living in rural areas). Interestingly, the prudent pattern (i.e. often characterised by high consumption of vegetables, fruits, fish, legumes, whole grains, fish and poultry) was identified in all three Thai studies, suggesting its generalisability and applicability to the local population. Also, while findings from our dietary pattern analysis underline the well-known elements of the Thai cuisine (i.e. a diverse mix of slow-cooked meats with steamed vegetables and rice as the main side dish), they also highlight some of their unhealthy elements such as traditional sweets and desserts (e.g. steamed egg custard and fruits with added sugars) and fried food (e.g. deep fried polished rice and deep fried pork skin).
One explanation for the lack of association between FD and changes in dietary intake could be the relatively short follow-up time (12 months). In that regard, some of the non-significant trends identified in this study could become significant if they are extended (projected) over time. Therefore, the present findings only correspond to short-term effects of having an FD in later life. In addition, participants did not lose their FD at the baseline assessment, but most have lived without an FD for variable periods of time before the baseline assessment. Indeed, some participants might have experienced change in dentition long time ago and already adapted their food consumption before the study was conducted. Thus, any impact of having a non-FD on diet may have already happened by the time of the baseline assessments and their diet may not have changed, or be expected to change, during the 12-month follow-up period.
The present findings have some implications for practice and research. They support the value of a whole diet assessment over the traditional analysis of specific nutrients or food groups. It provides a comprehensive evaluation of how individuals consume foods, which is especially relevant among Thai families where members gather around a table to enjoy a variety of freshly prepared foods. As for research, the present findings await confirmation from further longitudinal studies, especially those with longer follow-ups and including more waves of dietary data. It would also be an advantage to include multiple dental assessments to capture how changes from an FD to a non-FD or replacing lost teeth with removable complete or partial dentures can impact dietary intake in the long term.
The prospective design, the objective assessment of FD and the use of a validated FFQ for Thai older adults are the strengths of this study. Some limitations are also noted. First, despite the longitudinal design, we are only reporting associations not causal relationships. Second, selection bias could have arisen from two sources, sample selection and attrition. Although the response rate was high, the response at sub-district and province levels were moderate only, which could explain the differences observed with the wider older population. In addition, there was evidence that those lost to follow-up were different than those retained in the sample. These differences imply that the findings cannot be generalised beyond the study sample. Third, even when a validated semi-structured FFQ with a short recall time (previous month) was used for dietary assessment, responses relied on participants’ memory, judgements on frequency of intake and portion sizes. Responses could have also been influenced by seasonal variation as some fruits are only consumed in the Summer such as mango, durian, rambutan, longan, custard apple, mangosteen and lychee. In addition, a missing element in the semi-structured FFQ was the cooking method, which could impact on estimation of nutrients due to cooking and increased temperature.
In conclusion, this 12-month longitudinal study among Thai older adults provided little support for an association between baseline FD and changes in DP. Analyses by specific food groups showed that having a FD was positively associated with larger increases in intake of vegetables.
Acknowledgements
Acknowledgements: The authors would like to thank Phetchaburi health authorities and local healthcare professions for supporting this study. Financial support: The follow-up examination was funded by Thailand’s Government Expenditure in 2019. Conflict of interest: There are no conflicts of interest. Authorship: Conceptualisation, methodology: P.G., E.B., W.S.; data curation: P.G.; formal analysis, writing original draft preparation: P.G., E.B.; writing – review and editing, supervision: E.B., W.S. Ethics of human subject participation: This study was conducted according to the guidelines laid down in the Declaration of Helsinki, and all procedures involving research study participants were approved by the Biomedical Sciences, Dentistry, Medicine and Natural & Mathematical Sciences Research Ethics Sub-Committee (BDM RESC) of King’s College London (HR-17/18-4631) and Phetchaburi Health Authority (COA No.001/2561). Written informed consent was obtained from all participants.
Supplementary material
For supplementary material accompanying this paper visit https://doi.org/10.1017/S1368980020004279


