


Introduction: the implications of the COVID-19 pandemic for social policy
The social and economic changes precipitated by the COVID-19 pandemic ‘are some of the most unexpected and profound seen since World War II’ (Blundell et al., Reference Blundell, Cribb, McNally, Warwick and Xu2021:4). Therefore the pandemic is not only a public health crisis: ‘it is an economic and social crisis too’ (Dolan, Reference Dolan2020:1). The measures designed to mitigate the spread of the virus have led to unprecedented state intervention, with governments voluntarily shutting down sizeable sections of their economies for extended periods (Moreira and Hick, Reference Moreira and Hick2021). Together with the collective impact of individuals’ decisions to restrict their activities to reduce the risk of infection, this has led to a sizeable decline in the output of advanced countries: the median drop in annual GDP was 5%, with some countries – including Spain, the UK and Greece – experiencing even more sizeable declines (Béland et al., Reference Béland, Cantillon, Hick and Moreira2021). Indeed in the second quarter of 2020 the UK experienced a record 19.8% quarter-on-quarter decline in GDP (Nabarro, Reference Nabarro2020).
There is a pressing need to examine the implications of these interrelated social and economic changes for social policy. Here the priority is to consider the implications of the pandemic for the provision of social welfare and for social wellbeing. An important body of empirical evidence has emerged about how welfare states have responded to the pandemic. These responses can be characterised as a form of ‘emergency Keynesianism’ involving the use of deficit spending during economic crisis, including through increased spending on public services, providing support for businesses, and introducing job retention schemes and enhanced unemployment support (Béland et al., Reference Béland, Cantillon, Hick and Moreira2021; Moreira and Hick, Reference Moreira and Hick2021), which together with the impact of the sharp economic downturn have led to unprecedented peacetime increases in government borrowing. An important body of evidence has also emerged about trends in individuals’ and households’ living standards and wellbeing during the pandemic, including the impact on income, earnings, savings and spending (Bourquin et al., Reference Bourquin, Delestre, Joyce, Rasul and Waters2020; Handscomb and Judge, Reference Handscomb and Judge2020), on employment (Brewer et al., Reference Brewer, Cominetti, Henehan, McCurdy, Sehmi and Slaughter2020), and on mental health (Wang et al., Reference Wang, Kamerade, Bessa, Burchell, Gifford, Green and Rubery2022), and how these changes have been experienced according to key dimensions of inequality by gender, ethnicity and socioeconomic background (Blundell et al., Reference Blundell, Cribb, McNally, Warwick and Xu2021). However, thus far, there has been very little empirical evidence in the UK contextFootnote 1 about the impact of the pandemic on the income of charitable organisations. This is a significant gap in the existing social policy literature given the important role of charitable organisations in the ‘mixed economy of welfare’ (Lewis, Reference Lewis1993; Billis and Glennerster, Reference Billis and Glennerster1998). Indeed the existing scholarly empirical focus on individual and household outcomes alone is not sufficient: research within social policy should also examine the implications of the pandemic for charitable organisations, which provide a variety of services, resources and activities conducive to social welfare and wellbeing. Therefore, for the first time, this paper examines trends in the income of charitable organisations in England and Wales during the COVID-19 pandemic.
Substantive context: public concern about the impact of COVID-19 on the charitable sector
There is considerable public concern about the impact of the pandemic on the charitable sector. Thus Thiery et al. (Reference Thiery, Cook, Burchell, Ballantyne, Walkley and McNeill2021:2) argue that the pandemic has led to ‘the biggest financial crisis facing the [Voluntary and Community Sector] in living memory’. A number of important income streams have been directly affected. Many community fundraising events have been cancelled. Earned income has reduced through the enforced closure of charity shops and the decline in income from renting property to community groups. Income from fees in connection with charitable activities has been affected through an enforced reduction in the number of service users in accordance with social distancing guidelines (Walkley et al., Reference Walkley, Bojke, Howdon, Burchell, Thiery, Cook, Ballantyne and McNeill2021). In the longer term there is concern about a potential decline in individual giving, as the economic downturn affects individuals’ earnings, and about what the largest peacetime increase in government borrowing will mean for future levels of charities’ public funding. The charitable sector is diverse and the impact of the pandemic will be felt in different ways by different organisations. Nevertheless the challenge for the charitable sector is ‘consistent and widespread’ such that there is concern about the implications for the individuals and communities that charities serve (House of Commons DCMSC, 2020:5). Indeed the chief executive of Barnardo’s, a leading charity providing support for vulnerable children, has commented that charities have faced ‘a perfect storm’ as ‘need has never been greater’ yet charities are ‘facing substantial reductions in income’ (Astrup, Reference Astrup2021:14). In February 2021 600 charities wrote to the UK Prime Minister asking for emergency support in view of the considerable financial pressures faced by the charitable sector, warning that ‘resources are running dangerously low and [that] services are getting stretched to breaking point’ (Never More Needed, 2021).
However – despite this extent of public concern – there remains a lack of empirical information on the impact on the pandemic on the income of charitable organisations. The only existing evidence has been based on small-scale cross-sectional surveys offering indirect measures of the financial impact of the pandemic through asking charities to report their projected income during the pandemic. For example, the Institute of Fundraising, the National Council of Voluntary Organisations (NCVO) and the Charity Finance Group (2020) carried out a survey in March 2020 of around 500 charities, with these charities reporting a projected loss of a third of their total income as a result of the pandemic. Similarly Pro Bono Economics (2020) carried out a survey in June 2020 of around 260 charities, with nine in ten of these charities reporting a projected loss in income over the following six months as a result of the pandemic. Meanwhile a repeated survey carried out during the pandemic asks charities to assess their short-term expectations about their financial position (NCVO et al., 2021). These cross-sectional surveys provide a valuable snapshot but have certain limitations. First, surveys asking charities about their projected income, which were carried out in the early stages of the pandemic when the future course of the pandemic was highly uncertain, may not necessarily provide a reliable guide to the cumulative impact of the pandemic on annual income. Second, relatively small sample sizes place limits on the ability to disaggregate trends to ascertain which sizes and types and charities have been most affected by the pandemic. Third, and most significantly, without longitudinal data, it is difficult to assess the importance of the pandemic for charitable income without placing the change in annual income during COVID-19 within the context of longer-term annual trends. Therefore basic questions remain unanswered in existing empirical work: what is the average change in charities’ annual income during the pandemic? How distinctive is the annual change in income during the pandemic compared to previous annual changes? How does the impact of the pandemic on charitable income compare to the impact of the 2008-2009 Great Recession and subsequent period of public spending austerity (Clifford, Reference Clifford2017)? How have trends in income during the pandemic varied by charitable size: have small or large charities been most significantly affected? Which fields of charitable activity have seen the greatest declines in income? This paper answers these questions for the first time.
Data and Method
The analysis in this paper is based on unique administrative data from the Register of Charities (RoC), which contains key information on the activity of all registered charities in England and Wales. The RoC data, originally provided through the annual returns that charities are required to file as part of the Charity Commission’s regulatory process, includes longitudinal data on charities’ headline annual income. We use these longitudinal data to build a panel dataset that follows through time charities in England and Wales from 1999 onwards. Importantly this panel dataset provides a basis for assessing the impact of the COVID-19 pandemic by placing organisations’ recent annual income during the pandemic within the context of longer-term trends.
In our panel dataset, our analysis years are initially defined on the basis of financial years ending between April in calendar year ‘t’ and March in calendar year ‘t+1’. Therefore ‘2020’ includes data on charities with financial years ending between April 2020 and March 2021 inclusive. This helps to group together data on financial years affected by the first year of the pandemic within a single year of data. Then we consider a panel of 90,928 charities that:
-
have submitted their annual returns for a financial year affected by the pandemicFootnote 2 ;
-
have financial years ending between mid-June 2020 and March 2021 inclusive, such that at least three months of their financial year is affected by the pandemicFootnote 3 . Therefore charities with financial years ending in March 2020–early June 2020 inclusive, where a smaller part of the financial year is affected by the pandemic, are not considered in this analysis.
These 90,928 charities represent around 69% of the total population of charitiesFootnote 4 . For this panel of charities we examine annual relative growth rates between 2000 and 2020 inclusiveFootnote 5 . Table A1 in the Supplementary Material provides the number of observations in each year.
Annual relative growth y in income x for organisation i between years t – 1 and t is given by
 $${y_{i,t}} = {x_{i,\;t}}/{x_{i,\;t - 1}}$$
where t = 2000,……, 2020. Thus, if there is no change in income between t – 1 and t, y = 1; for an increase in income, y > 1; for a decrease in income, y < 1. We consider both nominal annual relative growth in income (before adjusting for inflation) and real annual relative growth (after adjusting for inflation using the Retail Price Index (RPI)Footnote 6 ). We use the median of the annual relative growth distribution to summarise income growth in a particular year. The median represents the annual relative growth in income of the ‘typical’ (middle-performing) charity. We also consider the 25th percentile of the annual relative growth rate distribution. This is because there is substantive interest in measures beyond the average: indeed, given the focus on charities that may be most vulnerable to the circumstances associated with COVID-19, there is a particular interest in charities at the lower tail of the relative growth distribution.
We begin by examining trends in annual income for the panel of charities as a whole. However we also disaggregate our results to examine trends for charities in different fields of activity, using the International Classification of Nonprofit Organisations (ICNPO). We also disaggregate our results for organisations of different size, defined by headline income in t – 1Footnote 7 , and by whether the organisation receives government funding. We also consider, for the subpopulation of charities with an income of at least £500k, trends in the annual relative growth rate of specific income streams. Finally we complement our analysis of trends in income by considering trends in annual relative growth in charities’ expenditure as an indicator of how the pandemic may have impacted the activities of charities.
Results
Figure 1 illustrates, for the panel of charities as a whole, the trend in the median annual relative growth rate in charities’ income. The results reveal the scale of the impact of the pandemic: the change in the level of income for 2020, compared to 2019, is highly distinctive in comparison to change in other years. In 2020 the median charity experienced a nominal decline in income of 12% (median relative nominal growth rate in income: 0.88); after adjusting for inflation, the median charity experienced a 13% income decline (median relative real growth rate in income: 0.87; see Table A2 in the Supplementary Material). Notably this is a much more sizeable annual decline in income than those annual declines associated with the Great Recession and subsequent period of public spending austerity. Indeed, while from 2009 to 2014 inclusive the median charity experienced a real term annual decline in income, the median relative growth rates for each year over this period reveal comparatively much smaller real term annual declines of between 1% and 4% (median relative real growth rate in income between 0.99 and 0.96; Table A2).
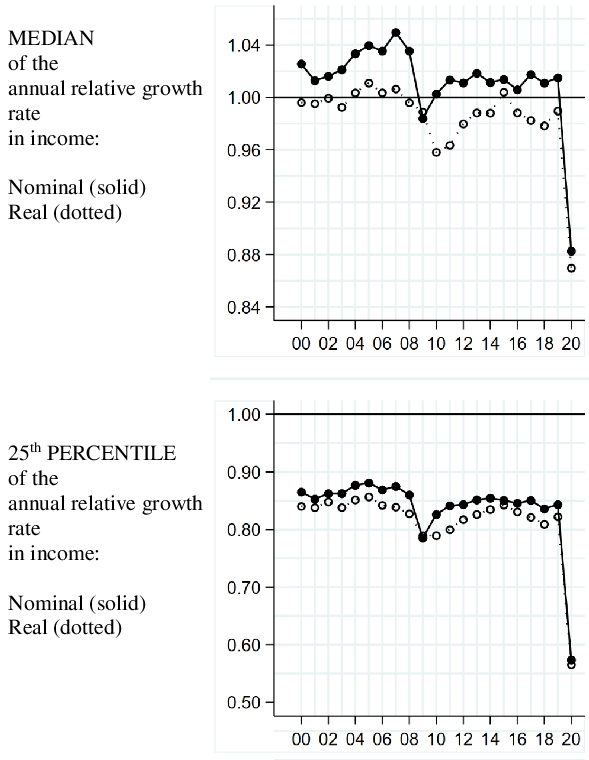
Figure 1. Trend in the annual relative growth rate in charities’ income.
Figure 1 also illustrates the trend in the 25th percentile of the annual relative growth rate distribution. As with the median, the change in the level of income for 2020, compared to 2019, is highly distinctive in comparison to change in other years. In 2020 a charity at the 25th percentile of the relative growth distribution experienced a real decline in income of 43% (25th percentile of the relative real growth rate in income: 0.57; see Table A3). This is also a much more sizeable decline than experienced during the Great Recession and subsequent period of public spending austerity: between 2009 and 2014 the 25th percentile of the relative growth distribution for each year over this period reveal much smaller real term annual declines of between 17% and 21% (25th percentile of the relative real growth rate in income between 0.83 and 0.79; Table A3).
Figure 2 presents the results disaggregated for organisations of different size, defined by headline income. The pandemic has affected both small and large charities: the distinctiveness of the decline in income for 2020, in comparison to change in other years, is evident for charities irrespective of charitable size (Figure 2). However smaller charities have seen much more sizeable relative income declines. For example, charities with an income of between £1k and 10k, and those with an income of between £10k–100k, experienced median real declines in income of 19% and 16% respectively (median relative real growth rate in income: 0.81 and 0.84; Table A2). In contrast charities with an income of between £1m-10m, and those with an income of more than £10m, experienced a median real decline in income of 6% and 5% respectively (median relative real growth rate in income: 0.94 and 0.95). There are also size differences in the scale of the 2020 decline when considering the 25th percentile of the annual relative growth rate distribution: for charities with an income of between £1k and 10k, and those with an income of between £10k–100k, the 25th percentile of the annual relative growth rate distribution shows real term declines of 56% and 45% respectively; in contrast, for charities with an income of between £1m-10m, and those with an income of more than £10m, the 25th percentile of the annual relative growth rate distribution shows real term declines of 24% and 16% respectively (Table A3).
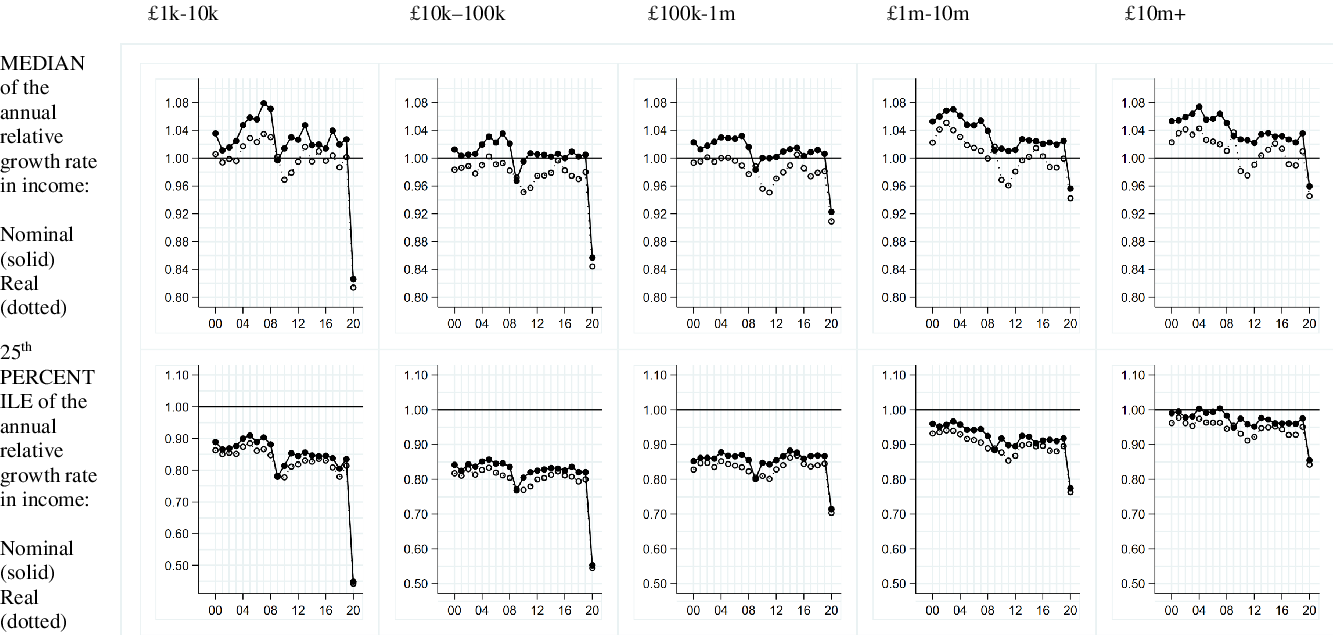
Figure 2. Trend in the annual relative growth rate in charities’ income, by size of organisation (£ annual income).
We disaggregate trends to consider annual income growth in different fields of charitable activity (Figure 3). This reveals considerable heterogeneity in the effect of the pandemic. The distinctiveness of the decline in income for 2020, in comparison to change in other years, is particularly marked for certain types of charities. For example, Parent Teacher Associations (PTAs) experienced a median real income decline of 43% (median relative real growth rate in income: 0.57; Table A2) while the 25th percentile of the annual relative growth rate distribution shows a real income decline of 61% (Table A3). Charities involved in culture and recreation experienced a median real income decline of 23% with the 25th percentile showing a real decline of 53%; charities in economic, social and community development experienced a median real income decline of 20% with the 25th percentile showing a real decline of 51%; and charities in research experienced a median real income decline of 18% with the 25th percentile showing a real decline of 49%. Charities in the fields of education (median real decline of 10%), the environment (median real decline of 9%), grantmaking (median real decline of 12%), health (median real decline of 9%), international activities (median real decline of 10%), religion (median real decline of 12%), scout groups and youth clubs (median real decline of 8%), and social services (median real decline of 9%) also experienced sizeable income declines. In contrast playgroups and nurseries (median relative real growth rate in income: 0.96), and charities involved in housing (median relative real growth rate in income: 0.99), did not experience such sizeable median declines. Village halls are distinctive in representing the only type of charity to have experienced a sizeable median real increase in income in 2020 (median relative real growth rate in income: 1.19).

Figure 3. (a). Trend in the annual relative growth rate in charities’ income, by field of charitable activity (ICNPO).

Figure 3. (b). Trend in the annual relative growth rate in charities’ income, by field of charitable activity (ICNPO).

Figure 3. (c). Trend in the annual relative growth rate in charities’ income, by field of charitable activity (ICNPO).
Note the different vertical scale for the graphs illustrating the growth rate of PTAs.

Figure 3. (d). Trend in the annual relative growth rate in charities’ income, by field of charitable activity (ICNPO).
Note the different vertical scale for the graph illustrating the median growth rate of village halls.
We also disaggregate trends to consider income growth according to whether a charity is in receipt of government fundingFootnote 8 . We begin by noting the sizeable increase in the percentage of charities receiving government funding in 2020 (Table 1). Between 2016-2019, around 13-14% of charities received government funding in a particular year. In 2020 this figure approximately doubled to 27.8%. This reflects the impact of financial support provided by government to support charities during the pandemic. In April 2020, during the early stages of the pandemic, the Chancellor Rishi Sunak announced a £750 million support package for the charitable sector. This included £360 million for charities providing key services and supporting vulnerable people, including hospices, Citizens Advice and St John Ambulance, together with £370 million to be distributed to smaller charities, including through a grant to the National Lottery Community Fund (Macmillan, Reference Macmillan2020). Given the distinctive increase in the proportion of charities receiving government funding during the pandemic, we consider trends in annual income growth for three groups of charities: those that received no government funding between 2016-2020 inclusive (which we term ‘non-publicly funded organisations’); those that received government funding at some point between 2016-2019 (‘pre-COVID 19 public funding recipients’); and those that received no government funding between 2016-2019 but which received public funding in 2020 (‘‘new’ public funding recipients’). Figure 4 presents the results. There is a distinctive decline in income for 2020, in comparison to change in other years, for ‘non publicly-funded organisations’: these charities experienced a median real income decline of 21% (median relative real income growth rate: 0.79; Table A2). There is also a distinctive, though much less sizeable, decline in income for 2020 for ‘Pre-COVID 19 public funding recipients’: these charities experienced a median real income decline of 3% (median relative real income growth rate: 0.97). In contrast the typical charity that was a ‘‘new’ public funding recipient’ in 2020 did not experience a distinctive income decline, with a median relative real income growth rate of 1.09 showing a 9% increase in income in 2020. These results highlight not only the distinctive role of government funding in 2020, underlying the robustness of income trends for ‘‘new’ public funding recipients’, but also the pervasiveness of the impact of the pandemic – with not only ‘non-publicly funded organisations’ but also ‘pre-COVID 19 public funding recipients’ showing a distinctive median annual income decline in 2020.
Table 1. Number of observations, for the overall panel and by absence or presence of government funding


Figure 4. Trend in the annual relative growth rate in charities’ income, by absence or presence of government funding.
We proceed to consider trends in the annual relative growth rate of specific income streams (donations and legacies; income from charitable activitiesFootnote 9 ; income from trading; income from investmentsFootnote 10 ). Note that this more detailed income information is only available for charities with an income of at least £500k so this stage in the analysis relates specifically to this subpopulation of the charitable population, which represents a minorityFootnote 11 of the total number of charities and excludes the smallest charities whose headline income has been most affected by the pandemic (see Figure 2). Figure 5 presents the results. The decline in trading in 2020 is most distinctive: the median annual real relative growth rate in income from trading is 0.56, representing a 44% annual decline (Table A5). There is also a distinctive decline in income from charitable activities, with a median annual real relative growth rate of 0.93 representing a 7% annual decline. Figure 5 also illustrates the sizeable decline in income from investments (with a median annual real relative growth rate of 0.81 representing a 19% annual decline), albeit less sizeable than during the Great Recession. Note that there is evidence that, for the subpopulation of charities with an income of at least £500k, the typical charity experienced a small increase in donations and legacies (with a median annual real relative growth rate of 1.04). This increase is distinctive compared to previous annual changes but nonetheless much less sizeable than the distinctive declines in other income streams, particularly the decline in trading income.
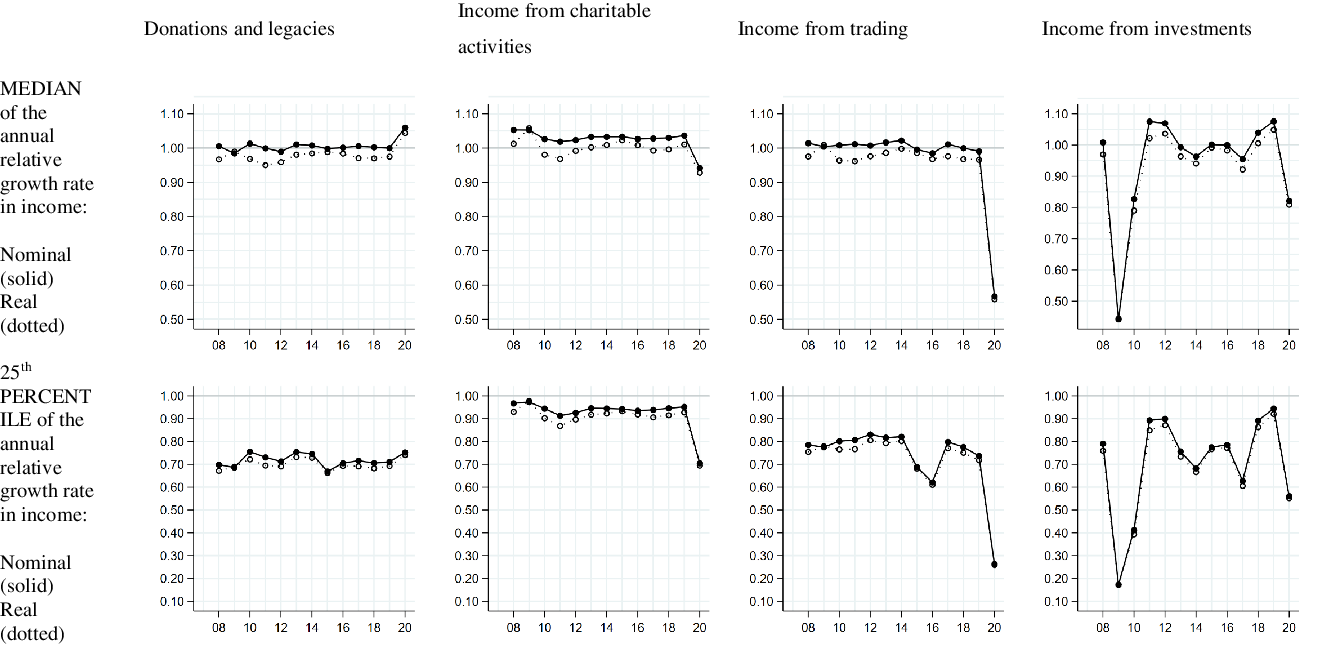
Figure 5. Trend in the annual relative growth rate in specific charitable income streams.
Note: this figure relates only to a subpopulation of charities with an annual income of at least £500k.
We complement our analysis on income trends by also considering the trend in the annual relative growth rate in charities’ expenditureFootnote 12 . Importantly the results show that – just as there have been sizeable and distinctive declines in charities’ income during COVID-19 – so there have been sizeable and distinctive declines in charities’ expenditure. Indeed the median charity experienced a 16% expenditure decline in 2020 after adjusting for inflation (median relative real growth rate in expenditure: 0.84) (Figure 6; Table A7), while a charity at the 25th percentile of the relative growth distribution experienced a real decline in expenditure of 47% (25th percentile of the relative real growth rate in expenditure: 0.53) (Figure 6; Table A8). As with income, smaller charities have seen much more sizeable relative expenditure declines (Figure 7). For example, charities with an expenditure of between £1k and 10k, and those with an expenditure of between £10k–100k, experienced median real declines in expenditure of 23% and 21% respectively (Table A7). In contrast charities with an expenditure of between £1m-10m, and those with an expenditure of more than £10m, experienced a median real decline in expenditure of 7% and 4% respectively. As with income, charities in certain ‘vertical fields’ of charitable activity have seen particularly sharp declines in expenditure (Figure 8). For example, PTAs experienced a median real expenditure decline of 35%; charities involved in culture and recreation experienced a median real expenditure decline of 28%; charities in economic, social and community development experienced a median real expenditure decline of 28%; and charities in research experienced a median real expenditure decline of 20%. Charities in the fields of education (median real decline of 10%), the environment (median real decline of 12%), grantmaking (median real decline of 11%), health (median real decline of 11%), international activities (median real decline of 12%), religion (median real decline of 14%), and social services (median real decline of 14%) also experienced sizeable expenditure declines alongside their sizeable income declines. In contrast playgroups and nurseries (median relative real growth rate in expenditure: 0.95), and charities involved in housing (median relative real growth rate in expenditure: 0.95), did not experience such sizeable expenditure declines. Scout groups and youth clubs (median real decline in expenditure of 39%) stand out as experiencing a much more sizeable median decline in expenditure than in income. Village halls, which are distinctive compared to other charities in experiencing a sizeable median real increase in income in 2020, nevertheless experienced a sizeable decline in expenditure (median real decline of 20%). Meanwhile, while ‘non-publicly funded organisations’ experienced the most sizeable decline in expenditure (median real decline of 21%), ‘pre-COVID 19 public’ funding recipients’ and ‘’new’ public funding recipients’ also experienced distinctive expenditure declines (median real declines of 9% and 13% respectively) (Figure 9).
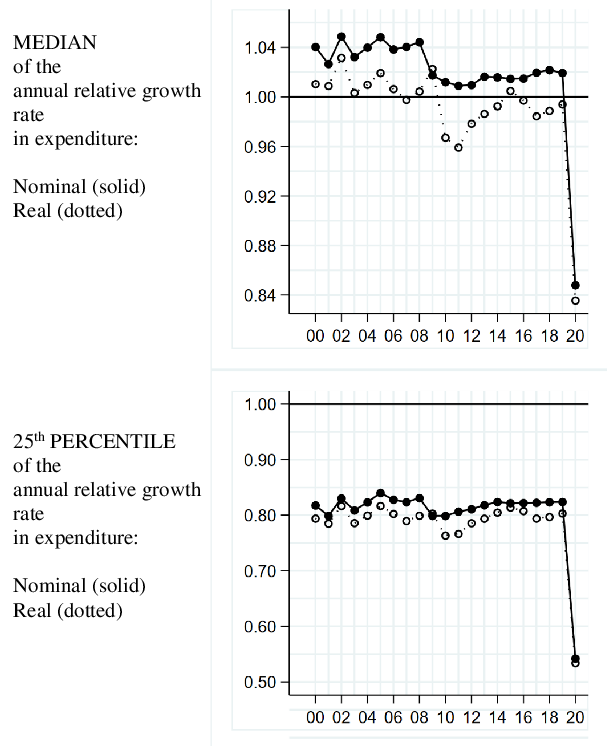
Figure 6. Trend in the annual relative growth rate in charities’ expenditure.

Figure 7. Trend in the annual relative growth rate in charities’ expenditure, by size of organisation (£ annual expenditure).

Figure 8. (a). Trend in the annual relative growth rate in charities’ expenditure, by field of charitable activity (ICNPO).

Figure 8. (b). Trend in the annual relative growth rate in charities’ expenditure, by field of charitable activity (ICNPO).

Figure 8. (c). Trend in the annual relative growth rate in charities’ expenditure, by field of charitable activity (ICNPO).
Note the different vertical scale for the graphs illustrating the growth rate of PTAs.

Figure 8. (d). Trend in the annual relative growth rate in charities’ expenditure, by field of charitable activity (ICNPO).
Note the different vertical scale for the graph illustrating the median growth rate of village halls.
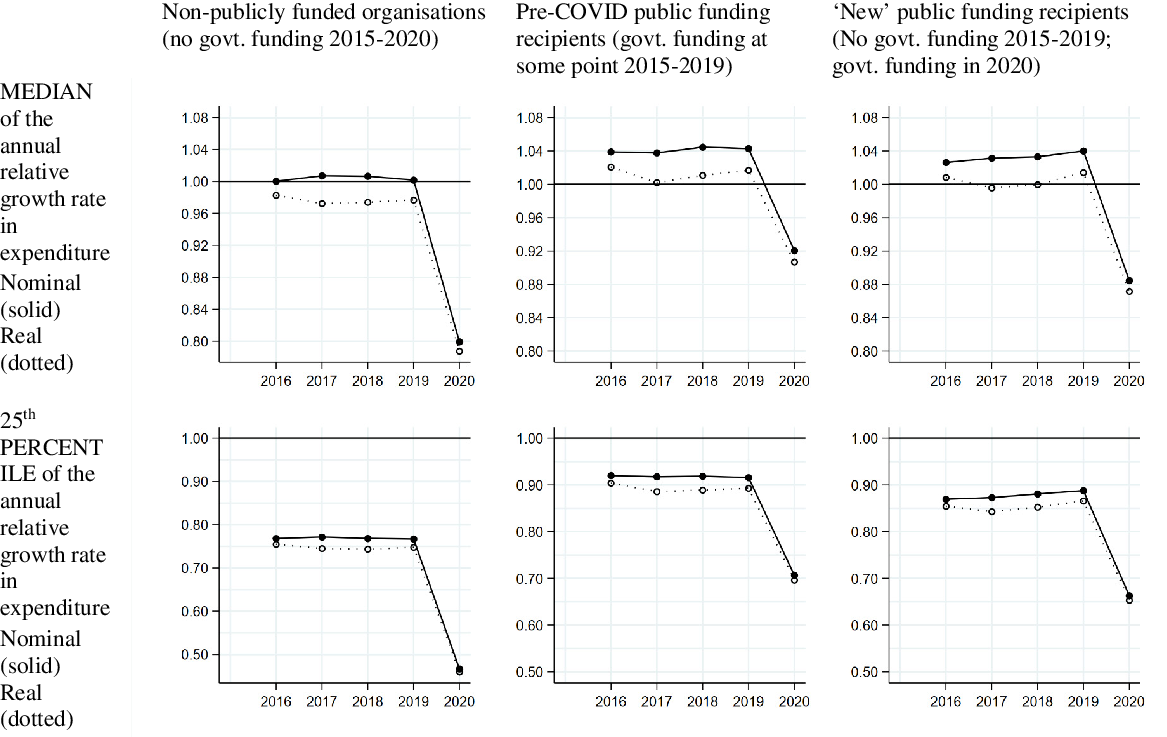
Figure 9. Trend in the annual relative growth rate in charities’ expenditure, by absence or presence of government funding.
Discussion
This paper’s analysis makes a number of important contributions. First, it illustrates the scale of the financial impact of the pandemic on the charitable sector for the first time. The size of the decline in charities’ income is remarkable and therefore worth emphasising: for financial years ending in 2020 the median charity experienced a 13% real decline in their annual income, while a charity at the 25th percentile of the annual relative growth distribution experienced a real income decline of 43%. This new empirical evidence helps to communicate the extent of the challenges faced by the charitable sector. There has rightly been considerable emphasis on the important role of voluntary action in responding to the pandemic. Charities and community organisations have partnered with local authorities and communities to respond to different types of individual and community needs during the pandemic – relating, for example, to the access to and affordability of food; to wellbeing, loneliness, social isolation and mental health; and to the provision of support to people ‘shielding’ (Thiery et al., Reference Thiery, Ballantyne, Cook, Burchell, Walkley and McNeill2020; Thiery et al., Reference Thiery, Cook, Burchell, Ballantyne, Walkley and McNeill2021; Walkley et al., Reference Walkley, Bojke, Howdon, Burchell, Thiery, Cook, Ballantyne and McNeill2021). Kruger (Reference Kruger2020) documents the emergence of local mutual aid groups to respond to community needs. Macmillan (Reference Macmillan2020) emphasises the sizeable response to the call for volunteers to support the work of the National Health Service (NHS) through the Volunteer Responders scheme. There have also been prominent charitable fundraising efforts during the pandemic, including crowdfunding for foodbanks (Taylor-Gooby et al., Reference Taylor-Gooby, Petricek and Cunliffe2021) and the ‘100th Birthday Walk for the NHS’ by Captain Sir Tom Moore. However the results of this paper show that – alongside these prominent examples of voluntary action responding to need – it is important to emphasise the considerable financial challenges that the pandemic has posed for the charitable sector.
Second, for the first time, this paper shows how the financial impact of the pandemic on the charitable sector compares to the financial impact of the Great Recession and subsequent period of public spending austerity. The Great Recession and period of austerity led to a sizeable decline in charities’ income (Clifford, Reference Clifford2017). This is consistent with both the theory of voluntary sector failure, which predicts that income from charitable donations declines during economic downturns at the very time that social need is greatest (Salamon, Reference Salamon1987; Smith and Grønbjerg, Reference Smith, Grønbjerg, Powell and Steinberg2006), and with the implications of deep cuts in public spending given that voluntary organisations now play a greater role in public service delivery than ever before and are therefore more reliant on government funding (Allard, Reference Allard2009). Nevertheless this paper’s results show that the impact of the pandemic is of a different scale and nature. In terms of scale, the median annual real decline in charities’ incomes of 13% experienced during the pandemic dwarfs any of the annual real income declines following the Great Recession, which peaked at 4% in 2010 and 2011 (Figure 1). In terms of nature, while the defining feature of the pandemic has been the sudden and significant financial shock to charities’ incomes, the distinctive feature of the Great Recession and subsequent period of austerity was rather the cumulative impact of successive years of less sizeable median annual real term income declines between 2009 and 2014. This paper’s results therefore add to a growing body of literature within social policy highlighting the distinctiveness of the implications of the pandemic. The results add empirical weight to Macmillan’s (2020:130) claim that ‘the impact of the coronavirus crisis on the third sector is not the same as the experience of austerity through the 2010s’. Instead, compared to the Great Recession and period of austerity, the impact of the pandemic has been ‘distinctive in terms of its speed and scale’ (Moreira and Hick, Reference Moreira and Hick2021: 262).
Third, the analysis shows that – while the COVID-19 pandemic has been pervasive in scope – not all charities have been equally affected. Importantly, it shows that smaller charities, particularly those with an annual income less than £100k, have been the most significantly impacted since they have seen the largest relative declines in income. The results are consistent with literature from organisational sociology which predicts that smaller organisations, since they are less able to adopt a variety of adaptive strategies to respond to changes in their environment (Mosley et al., Reference Mosley, Maronick and Katz2012), may be less resilient during periods of economic and social uncertainty. The pronounced impact on smaller charities has important implications given the distinctive role of smaller organisations in civil society (Dayson et al., Reference Dayson, Bennett, Damm, Rees, Jarvis, Patmore, Baker, Terry and Turner2022): their agile response to complex needs, facilitated by the overlapping role of their stakeholders within relatively flat hierarchies; their ability to build long-term trust-based relationships and a person-centred care ethic; and their tendency to be embedded locally within communities of place and interest. Given these distinctive characteristics, future research should examine as a priority the longer-term implications for civil society of the sizeable income decline of smaller charities during the pandemic – and, in particular, consider whether there is evidence for a subsequent increase in the rates of dissolution of smaller charities, alongside whether there is evidence for an impact on their beneficiaries.
Fourth, the analysis – through disaggregating overall trends according to the ICNPO – also provides a window into the kinds of charities most affected by the public health measures designed to mitigate the spread of the virus. For example, the sizeable decline in the income of PTAs reflects the impact of COVID-19 restrictions on the usual fundraising events, including summer fairs. Meanwhile the marked decline in the income of charities involved in culture and recreation reflects the enforced closure during lockdowns of museums, visual and performing arts venues, and recreation and social clubs. The reduction in income of charities involved in the promotion of economic, social and community development, which includes community centres, community associations and community transport groups, in part reflects their reduced income from venue hire. Notwithstanding the prominent fundraising efforts during the pandemic, much directed towards the national charity partner of the NHS (NHS Charities Together), the median charity in the health field also experienced a decline in income – reflecting a decline in fundraising events and in income from trading. In contrast the income of charities in other fields of charitable activity has been more resilient. Charities involved in housing, which include a number of almshouses which receive revenue through residents’ maintenance contributions, have not seen such sizeable income declines. The income of playgroups and nurseries, which continued to receive their early years entitlements fundingFootnote 13 from government through the pandemic, has been more resilient than in many other charitable fields of activity. Meanwhile the robustness of the income of village halls – with the median village hall experiencing a sizeable income growth for financial years ending in 2020 – is likely to reflect the impact of the availability of emergency government grantsFootnote 14 , which replaced income lost from other sources including fundraising.
Fifth – and importantly – the paper shows that the sizeable median decline in charities’ income during the pandemic has been accompanied by a commensurately sizeable median decline in charities’ expenditure. Significantly this is true not only for the population of charities as a whole (Figure 1 and Figure 6) but also at the level of specific sizes of charities (Figure 2 and Figure 7) and at the level of charities in different fields of activity (Figure 3 and Figure 8): in general, those kinds of charities that have seen the most sizeable declines in income have also been those that have seen the most sizeable declines in expenditureFootnote 15 . Overall the sizeable decline in expenditure provides insight into the extent to which the pandemic affected charitable activity – whether through a strategic decision to cut expenditure in response to a fall in income, and/or through enforced expenditure reductions because of the ways in which public health measures affected charitable operations. The sizeable decline in expenditure is also consistent with the relatively low level of reported financial reserves across the charitable sector at the start of the pandemic: of charities with at least £500k in income, 21% had under one month of expenditure in reserve; a third (33%) had under two months; 43% had under three months (Clifford and Mohan, Reference Clifford and Mohan2020). Note that Walkley et al. (Reference Walkley, Bojke, Howdon, Burchell, Thiery, Cook, Ballantyne and McNeill2021), for the voluntary sector in Yorkshire and the Humber, found that 31% of organisations reported drawing on financial reserves between March and October 2020. Similarly Newby and Branyon (Reference Newby and Branyon2021), relating to the US context, cite evidence that half of Florida’s nonprofits with reserves had drawn on them by the end of 2020. Nevertheless the sizeable decline in charities’ expenditure is consistent with the idea that the scale of the pandemic necessitated response strategies above and beyond drawing on reserves alone. Indeed Maher et al. (Reference Maher, Hoang and Hindery2020), for the US context, report that nonprofits’ response strategies have been focused on limiting expenditure – including freezing discretionary spending, freezing salaries, hiring freezes, delaying capital expenditures, and reducing public access or service hours. In the UK context the national government’s furlough scheme provided a means for charities to release their staff from work duties to reduce expenditure (Macmillan, Reference Macmillan2020), while Walkley et al. (Reference Walkley, Bojke, Howdon, Burchell, Thiery, Cook, Ballantyne and McNeill2021) report organisations reducing the number of paid hours offered to staff. A key priority for future empirical research is to assess the impact of reduced expenditure on charities’ service provision – particularly for smaller charities that have seen the largest relative declines in expenditureFootnote 16 . However initial evidence suggests that the impact is varied (Clay and Collinge, Reference Clay and Collinge2020): a significant minority of charities in fact sought to ‘broaden’ their offering to reflect increased demand or more complex needs; some sought to ‘maintain’ their services; while many have ‘narrowed and refocused’ their services to focus on their ‘core’ activities, or have had to triage the services they offer.
The analysis in this paper has limitations. In particular, through focusing on the impact on charities’ income, we provide only a partial perspective on how COVID-19 has affected the charitable sector. First, we do not consider the extent to which charities may have faced an increase in social need. Mills et al. (Reference Mills, Cairns, Firth and Dyson2020) argue that charities continuing to provide services during the pandemic, and particularly those organisations working with disadvantaged and vulnerable people, have seen an increase in demand. Walkley et al. (Reference Walkley, Bojke, Howdon, Burchell, Thiery, Cook, Ballantyne and McNeill2021) report that the increase in demand has been particularly acute for organisations working in social and community care and mental health services, and for those providing services for older people – with the increase in need reflecting both the difficulty people have faced in accessing traditional forms of support, and the emergence of new social needs arising from the pandemic and associated public health measures. Second, this paper does not consider how the pandemic has affected a fundamental non-financial resource for the charitable sector: the supply of volunteers (see Kendall et al., Reference Kendall, Mohan, Brookes and Yoon2018). While Thiery et al. (Reference Thiery, Ballantyne, Cook, Burchell, Walkley and McNeill2020) argue that a large number of new volunteers have come forward during the pandemic, many charities have been faced with a decline in the number of volunteers as individuals concerned about their exposure to the virus withdraw from their voluntary activity (Walkley et al., Reference Walkley, Bojke, Howdon, Burchell, Thiery, Cook, Ballantyne and McNeill2021). Third, we do not consider how the day-to-day operations of charities have been affected by the pandemic. Macmillan (Reference Macmillan2020) follows Pro Bono Economics (2020) in highlighting how, for a significant proportion of charities, the negative impact of social distancing on the delivery of services has impacted charities’ ability to meet their objectives.
This paper’s analysis illustrates that COVID-19 has had an unprecedented financial impact on charities. It therefore serves to underscore the importance for social policy, alongside considering trends in individuals’ and households’ living standards and wellbeing, of considering the impact of the pandemic on the voluntary sector. We anticipate that the results of this paper will be of considerable public interest – not only to academic researchers, but also to charities, policy makers, grantmaking organisations and members of the public. We note a number of policy implications of the analysis presented here. First, the comparative resilience in the income trends of publicly funded organisations during the pandemic – both of ‘pre-COVID public funding recipients’ and particularly of ‘ʼnewʼ public funding recipients’, in comparison to ‘non-publicly funded organisations’ – illustrates the importance of government funding. This is consistent with the theory of voluntary sector failure, which suggests that charities’ income from individuals may decline at the time of most pressing social need (Salamon, Reference Salamon1987; Smith and Grønbjerg, Reference Smith, Grønbjerg, Powell and Steinberg2006; Allard, Reference Allard2009), and underscores the fundamental importance of government financial support for the voluntary sector during periods of economic and social crisis. Note that the nature of funding is also important: Clay and Collinge (Reference Clay and Collinge2020) and Newby and Branyon (Reference Newby and Branyon2021) point to the importance of unrestricted funding to provide charities the necessary agility to respond to a crisis. Second, the commensurately sizeable decline in charities’ expenditure that has accompanied the sizeable decline in charities’ income is consistent with the idea that the relatively low level of charities’ reported financial reserves at the start of the pandemic (Clifford and Mohan, Reference Clifford and Mohan2020) provided limited ‘financial flexibility’ to charities when affected by a shock to their income (Tuckman and Chang, Reference Tuckman and Chang1991:450) – such that charities have not been well placed to sustain levels of spending. Evidence from the US suggests that nonprofits with reserves experienced less disruption to their mission-related programming during the pandemic (Kim and Mason, Reference Kim and Mason2020). Therefore the COVID-19 crisis should motivate charities to reengage with their reserves policy (Hyndman, Reference Hyndman2020). The analysis presented here – indicating, in particular, much more sizeable declines in income during the pandemic for smaller charities – suggests that reserves policy should be informed by organisational size and characteristics rather than simply a sector-wide benchmark: for example, it may be appropriate for smaller charities to hold more months of expenditure in reserve. Third, this paper illustrates the importance of further developing and improving the nascent voluntary sector data infrastructure. Without appropriate data infrastructure, there is a lack of a ‘guiding hand’ for donors and funders about where reduced resources might be best allocated during crisis periods. Indeed in general, quantitative data on voluntary organisations have not been readily available: as the UK Statistics Authority (2012:6) explain, the machinery of official data collection is instead orientated towards the state, the market and individuals, such that there has been a notable ‘shortage of regular and timely published statistics about the voluntary sector’. The shortage of timely statistics about the voluntary sector has provided a barrier to providing effective financial support during the pandemic: while resources have been made available by funders, including government, it has been hard to assess those organisations most in need of support or most exposed to reductions in income. Indeed it is harder for policy makers and funders to develop appropriate support without clear information about the scale of the financial challenge that the charitable sector has been facing (Clifford, Reference Clifford2017). Therefore the analysis in this paper – providing the first detailed overview of how charities’ income in England and Wales has been affected by the COVID-19 pandemic – is valuable. Note that this analysis has only been made possible because of the data collected through the annual returns that charities are required to file as part of the Charity Commission’s regulatory process – and because of the increasing detail provided in these annual returns in recent years, including information on charities’ income streams and government funding. Further developments in charity data – including the collection of more detailed data on smaller charities, and an increase in the submission of machine readable charity accounts – would be welcome. This would further enhance our ability to understand the financial challenges faced by charities, and therefore our ability to support the charitable sector, during periods of economic and social crisis.
Supplementary material
To view supplementary material for this article, please visit https://doi.org/10.1017/S0047279422001015
Data availability statement
The underlying data on which this paper’s analysis is based, the data extract from the Register of Charities, are available for download from the Charity Commission for England and Wales at https://register-of-charities.charitycommission.gov.uk/register/full-register-download
Acknowledgements
This research is funded by an award from the Economic and Social Research Council (ESRC), ‘Assessing financial vulnerability and risk in the UK’s charities during and beyond the COVID-19 crisis’ (ES/V004859/1; £234,141; Jun 20 – Mar 22). Many thanks to the Charity Commission for providing access to data from the Register of Charities.
Competing interests declaration
The authors declare none.


 Open access