


Epidemiological studies have demonstrated an inverse correlation between the amount of fish consumption and the risk of the onset of atherosclerotic CVD (ASCVD)(Reference Iso, Kobayashi and Ishihara1,Reference Zheng, Huang and Yu2) . The suppression of ASCVD by fish consumption largely depends on the cardiovascular protective anti-inflammatory effects of n-3 PUFA(Reference Mozaffarian and Wu3,Reference Rimm, Appel and Chiuve4) . Furthermore, observational studies have reported that populations with more active fish consumption habits encourage a healthier lifestyle(Reference Wennberg, Tornevi and Johansson5,Reference Tani, Imatake and Suzuki6) . This phenomenon may also curb the risk of atherosclerosis and prevent the development of ASCVD(Reference Arnett, Khera and Blumenthal7).
Several population-based studies have demonstrated that moderately elevated total serum bilirubin (TSB) concentrations attenuate the development of coronary artery disease(Reference Horsfall, Nazareth and Petersen8–Reference Hou, Li and Si10). Bilirubin has antioxidant properties and suppresses atherosclerosis(Reference Vogel, Idelman and Konaniah11,Reference Kang, Lee and Kruzliak12) . Interestingly, the prevalence of vascular complications in patients with diabetes with Gilbert syndrome, an inherited disorder characterised by mild hyperbilirubinaemia, is lower than that in patients with diabetes without Gilbert syndrome(Reference Inoguchi, Sasaki and Kobayashi13), suggesting bilirubin may have a cardioprotective effect.
However, the actual mechanism by which bilirubin exerts cardioprotective effects has yet to be established. The anti-inflammatory effects are closely related to the antioxidant activity and may significantly affect the anti-atherosclerotic effects of bilirubin(Reference Akboga, Canpolat and Sahinarslan14–Reference Yoshino, Hamasaki and Ishida16). The development of atherosclerosis is a complex process in which inflammation plays a crucial role(Reference Ross17). Therefore, high levels of inflammatory markers are associated with future ASCVD events(Reference Nissen, Tuzcu and Schoenhagen18,Reference Madjid, Awan and Willerson19) .
Bilirubin is an end product of heme degradation by heme oxygenase (HO), which exerts antioxidant effects. Thus, TSB concentrations may reflect enhanced HO activity(Reference Gáll, Balla and Balla20). Experimental studies have shown that n-3 PUFA activate HO-1, and the antioxidant properties of EPA have been attributed to the induction of HO-1. A dose-dependent increase in HO-1 mRNA and protein levels was found with an increasing dose of EPA(Reference Kusunoki, Yang and Yoshizaki21,Reference Tatsumi, Kato and Sango22) . Even in other in vitro experimental systems, several researchers have reported the n-3 PUFA-induced activity of HO-1 and the expression of HO-1 genes(Reference Lee, Kim and Yang23–Reference Adeyemi and Olayaki25). Hence, higher consumption of fish rich in n-3 PUFA may be associated with higher blood TSB concentrations in the human body.
Moreover, the combined anti-inflammatory effects of n-3 PUFA and higher TSB concentrations may be involved in reducing the risk of ASCVD. However, to our knowledge, no clinical data exist on the relationship between fish consumption, lifestyle, TSB concentrations and inflammation.
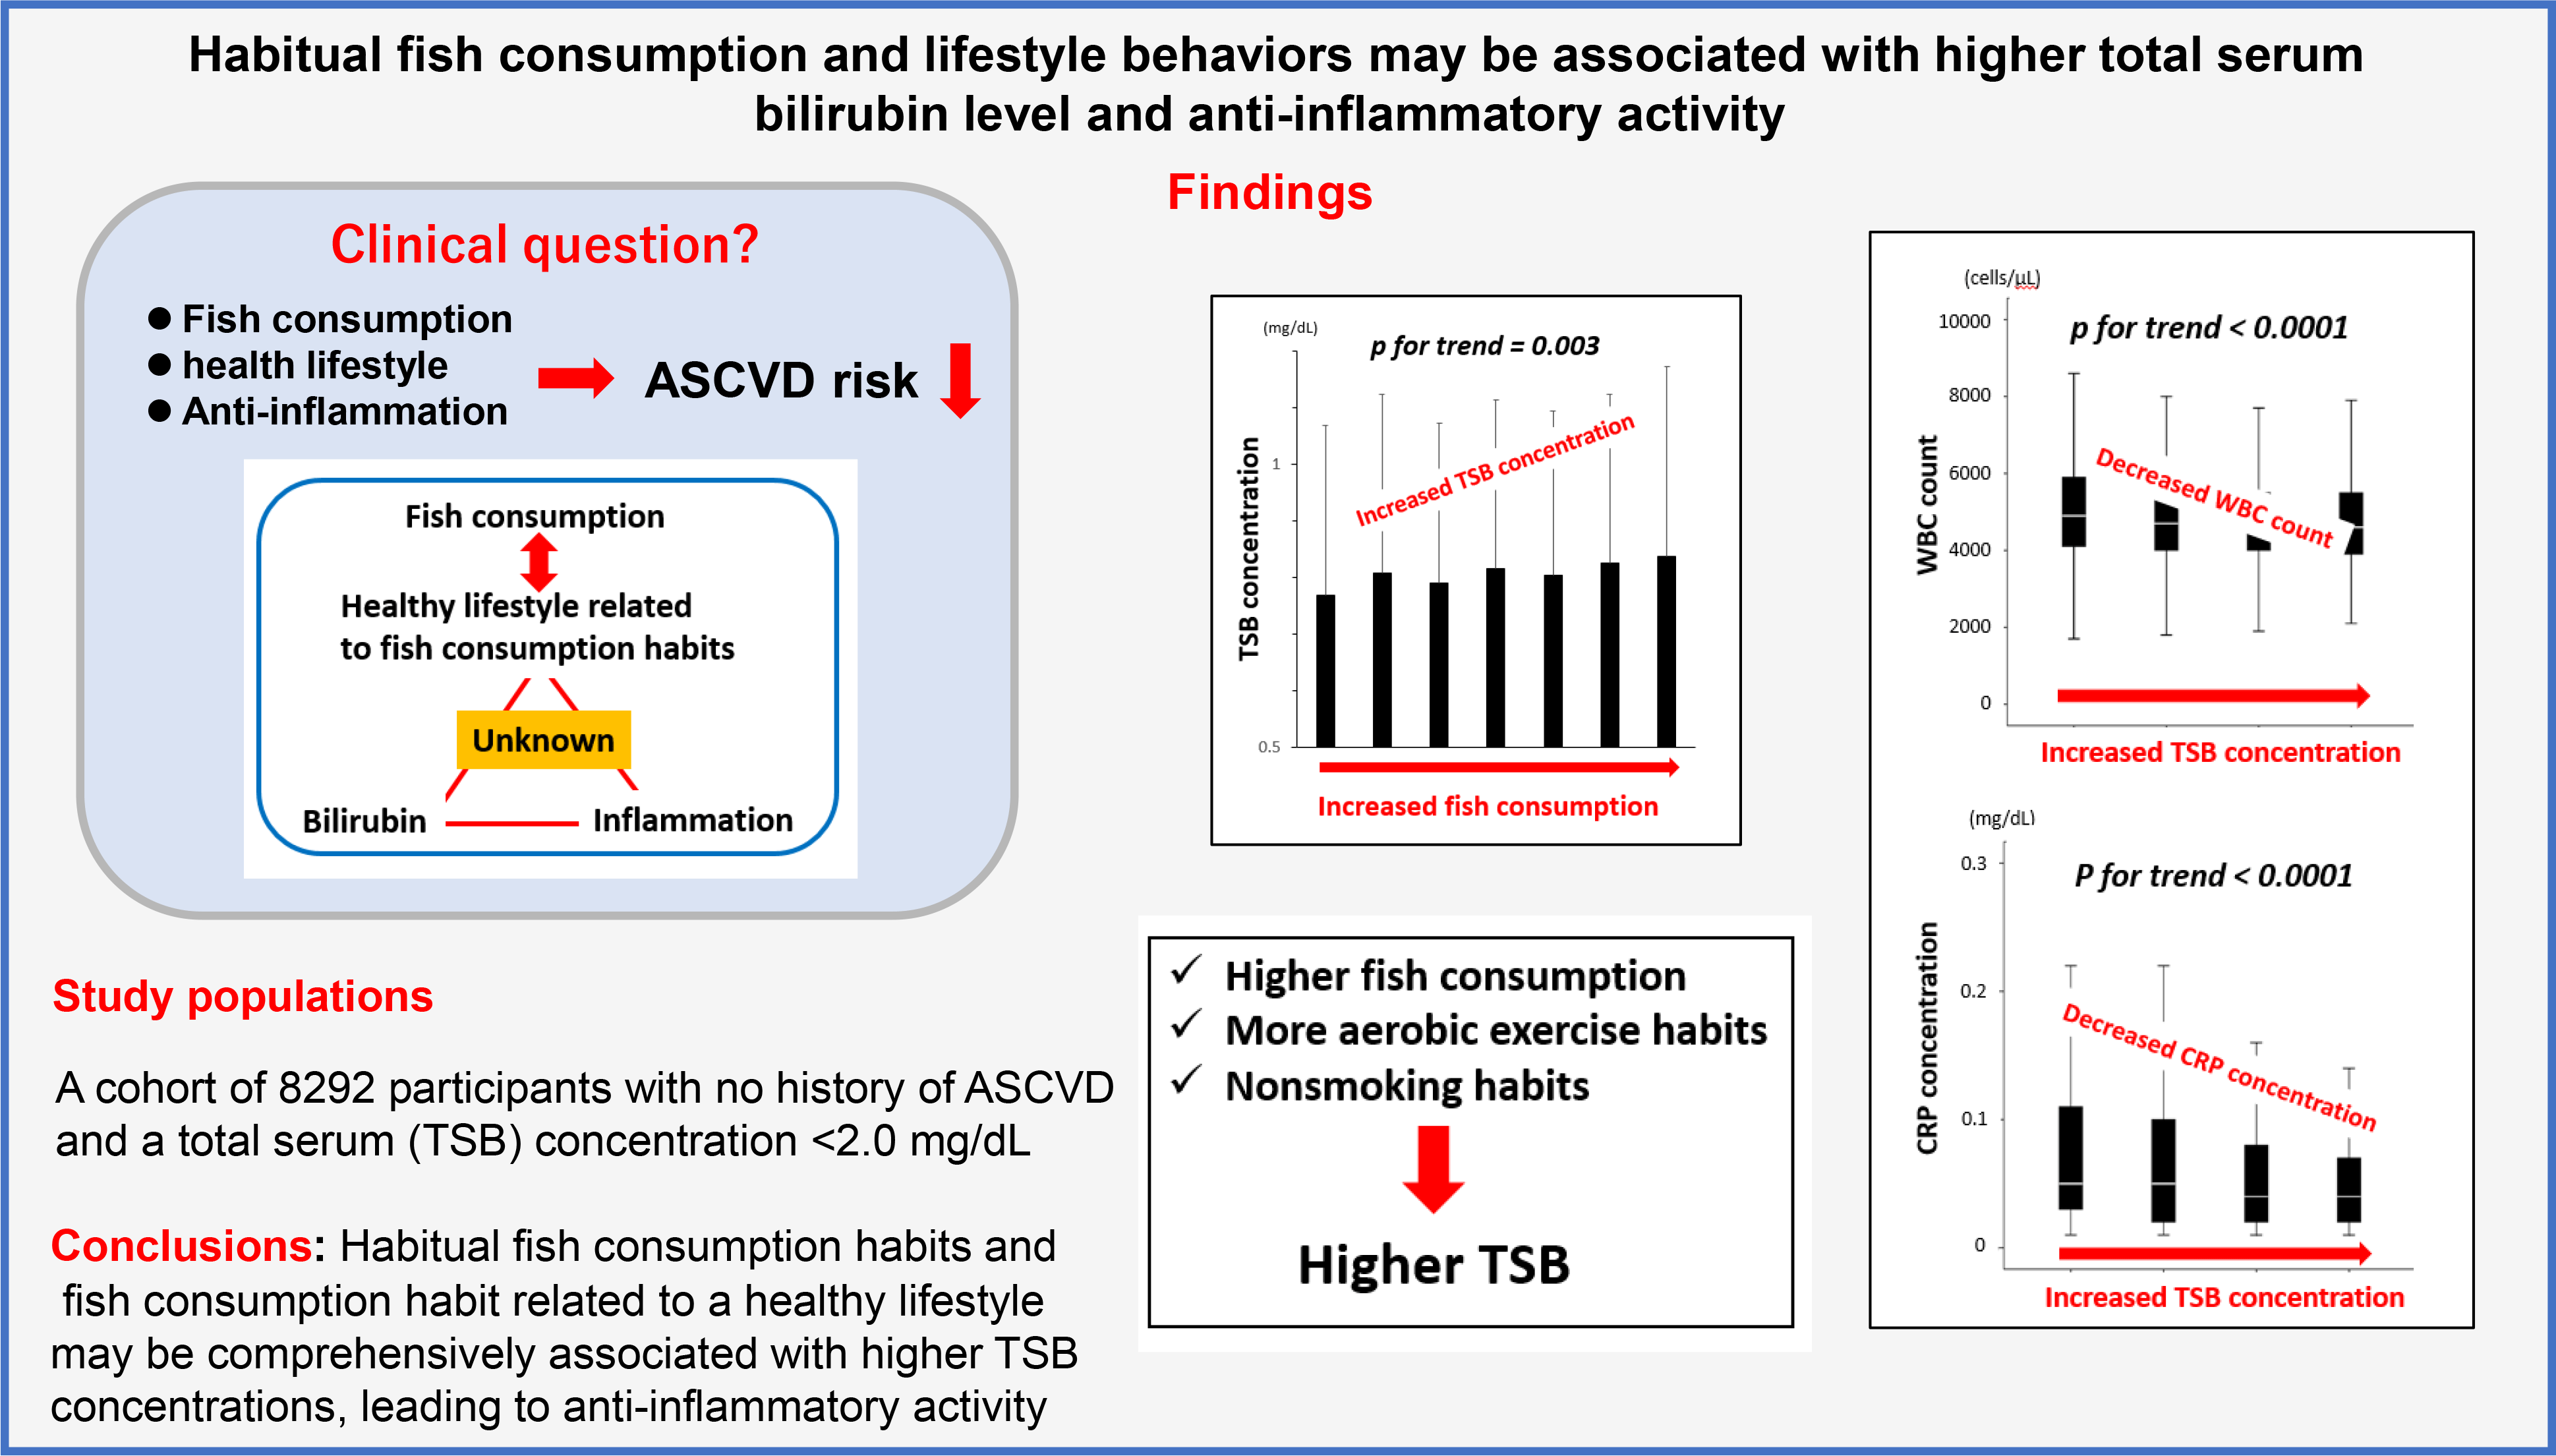
We hypothesised that a higher amount of fish consumption and healthier lifestyle behaviours might be related to higher TSB concentrations and therefore involved in anti-inflammatory activity.
In this cross-sectional study, we aimed to investigate the overall relationships between the amount of fish consumption in a daily diet with a healthy lifestyle, TSB concentrations and established inflammatory marker levels (including leukocyte counts and C-reactive protein (CRP)) in participants with no history of ASCVD.
Therefore, we set the following endpoints to carry out the objectives of this study: the primary endpoint was the relationship between the average weekly amount of fish consumption, lifestyle behaviours and TSB concentrations, and the secondary endpoint was the association of fish consumption and TSB concentrations with inflammatory markers.
Materials and methods
Study design and population
This cross-sectional study focused on the primary prevention of ASCVD, examining the relationship between fish consumption, lifestyle, TSB and inflammation. Among 11 678 Japanese individuals aged over 18 years who underwent annual health check-ups between April 2019 and March 2020 at the Health Planning Center of Nihon University Hospital, we included 8292 participants with no history of ASCVD in this study. We excluded 3381 participants from the analysis according to the following criteria: unwillingness to provide informed consent for participation; positive history of ASCVD; leukocyte counts ≥ 10 000 cells/μl; CRP concentrations ≥ 3·0 mg/dl; no record of the frequency of fish consumption; presence of hepatitis B virus surface antigen, hepatitis C antibodies, hepatic cirrhosis, hepatocellular carcinoma and metastatic liver cancer; or no measurement of leukocyte count, CRP concentration and TSB concentration. We also excluded participants with TSB concentrations ≥ 2·0 mg/dl to exclude constitutional jaundice as much as possible (i.e., the cut-off was to diagnose Gilbert syndrome in the absence of liver dysfunction)(Reference Bulmer, Verkade and Wagner26). As there are cases in which TSB concentrations are higher in fasting blood samples than in random blood samples, we set the cut-off value of TSB concentrations to be higher than the reference value(Reference Meyer, Scholtz and Schall27). The study inclusion and exclusion criteria flow chart is presented in Fig. 1. This study is a sub-analysis of our previous study(Reference Tani, Imatake and Suzuki28).

Fig. 1. Study inclusion and exclusion criteria flow chart. This flow chart presents the inclusion and exclusion criteria used to screen participants for this study. ASCVD, atherosclerotic CVD; CRP, C-reactive protein; HBs, hepatitis B surface; HCV, hepatitis C virus; TSB, total serum bilirubin.
The study complied with the principles of the Declaration of Helsinki. The study design and objectives were approved by the Institutional Review Board of Nihon University Hospital (approval number: 20200405). The study was also registered as a clinical trial with the University Hospital Medical Information Network Center (UMIN, http://www.umin.ac.jp/; Study ID: UMIN000046557). The requirement for written informed consent was waived because this was a retrospective cross-sectional study, and an opt-out recruitment procedure was followed.
Questionnaire for determining healthy behaviours
Participants who underwent health check-ups were given a lifestyle questionnaire and asked to respond appropriately. These questions were similar to those in the self-reported questionnaire described in the previous studies(Reference Tani, Matsuo and Imatake29). Briefly, trained interviewers conducted health behaviour surveys at our institute via face-to-face interviews with the participants. The surveys consisted of comprehensive questions designed to assess the participants’ demographic and socio-economic characteristics, including age, occupation, marital status, lifestyle behaviours, current medications, past medical history and family medical history. The survey questions were as follows:
-
1. Habitual aerobic exercise: Do you engage in exercise that makes you sweat slightly for 30 min a day at least twice a week for 1 year?
-
2. Intensive daily physical activity: Do you walk or engage in similar physical activity for 1 h or more per day in your daily life? (Yes/No)
-
3. Habitual cigarette smoking: Do you habitually smoke? – No/Yes/I have quit smoking/I quit smoking (_) years ago.
-
4. Habitual alcohol consumption: Please indicate the frequency at which you drink alcohol – Every day/sometimes/I used to drink previously, but have stopped drinking/I stopped drinking (_) years ago/I rarely drink/I cannot drink; how much do you drink per day when you drink? (ethanol equivalent (g/d)): < 20 g/20/< 40 g/40/< 60 g/60 g; How many days per week do you drink?
-
5. Daily sleep duration: How many hours do you sleep daily on average? () hours
-
6. Daily fish consumption: How many days in a week, on average, have you eaten fish in the past 1 month?
The ethanol content of alcoholic beverages was converted according to our previous report. Fish consumption was assessed as a weekly frequency in the questionnaire (not at all; once, twice, 3 times, 4 times, 5 times or 6 times a week; or approximately every day).
The questionnaire was a modified version of the Questionnaire on Specific Health Examination, which was used for specific health guidance during health check-ups under the Ministry of Health, Labour and Welfare in Japan(30). The above-mentioned questionnaire is an excerpt of questions relevant to this study from our institution’s questionnaire (online Supplementary Table 1).
Assessment of the estimated weekly amount of fish consumed
The National Health and Nutrition Survey of Japan estimated the average daily amount of fish consumption according to age and sex groups by evaluating the ‘net food supply per person per year of fishery products for human consumption’ based on domestic fish production, imports and exports, and changes in stocks and the population. The data were obtained from a survey conducted by the Ministry of Health, Labour and Welfare in Japan (online Supplementary Table 2)(31,32) . Thus, the National Nutrition Survey, led by the Ministry of Health, Labour and Welfare in Japan, has a standardised data collection method and established quality controls(Reference Ikeda, Nishi and Sugiyama33–35). Based on this survey record, we calculated the estimated average weekly amount of fish consumption as follows:
 \begin{align}&{\rm{The}}\;{\rm{estimated}}\;{\rm{average}}\;{\rm{weekly}}\;{\rm{amount}}\;{\rm{of}}\;{\rm{fish}}\;{\rm{intake}}\;\\
&\qquad = \;{\rm{average}}\;{\rm{daily}}\;{\rm{amount}}\;{\rm{of}}\;{\rm{fish}}\;{\rm{consumption}}\;{\rm{according}}\;{\rm{to}}\;{\rm{age}}\;\\
& \quad \qquad \times \;{\rm{average}}\;{\rm{weekly}}\;{\rm{number}}\;{\rm{of}}\;{\rm{days}}\;{\rm{of}}\;{\rm{fish}}\;{\rm{consumption}}\end{align}
\begin{align}&{\rm{The}}\;{\rm{estimated}}\;{\rm{average}}\;{\rm{weekly}}\;{\rm{amount}}\;{\rm{of}}\;{\rm{fish}}\;{\rm{intake}}\;\\
&\qquad = \;{\rm{average}}\;{\rm{daily}}\;{\rm{amount}}\;{\rm{of}}\;{\rm{fish}}\;{\rm{consumption}}\;{\rm{according}}\;{\rm{to}}\;{\rm{age}}\;\\
& \quad \qquad \times \;{\rm{average}}\;{\rm{weekly}}\;{\rm{number}}\;{\rm{of}}\;{\rm{days}}\;{\rm{of}}\;{\rm{fish}}\;{\rm{consumption}}\end{align}
Accordingly, we divided the average weekly amount of fish consumption into seven categorical variables: (i) < 50 g/week, (ii) ≥ 50 g/week but < 100 g/week, (iii) ≥ 100 g/week but < 150 g/week, (iv) ≥ 150 g/week but < 200 g/week, (v) ≥ 200 g/week but < 250 g/week, (vi) ≥ 250 g/week but < 300 g/week and (vii) ≥ 300 g/week. The validity of this formula has been proven in our previous study(Reference Tani, Imatake and Suzuki28).
Physical examination and laboratory parameters
Using standardised techniques and equipment, we measured the anthropometric variables (height and weight) with the participants in a standing position. BMI was calculated by dividing the body weight (kg) by squared height (in metres) (kg/m2). Waist circumference was measured at the umbilicus level with a non-stretchable tape measure during the late exhalation phase, with the participant in a standing position(Reference Tokunaga, Matsuzawa and Ishikawa36). Following a 5-min rest period, blood pressure was measured twice (with a 3-min interval between measurements) using a standard mercury sphygmomanometer; the average was used for our analysis. Blood samples were collected early in the morning after the subjects had fasted for 8 h. TSB concentrations were determined using an autoanalyser (Hitachi Corporation). Blood leukocyte counts were determined using a Beckman Coulter STKS (Beckman Coulter Inc.). The serum CRP concentrations were measured with a nephelometric assay (Behring Diagnostic). The estimated glomerular filtration rate was calculated using the abbreviated Modification of Diet in Renal Disease equation modified by a Japanese coefficient(Reference Matsuo, Imai and Horio37). Serum total cholesterol, TAG and HDL-cholesterol concentrations were measured using enzymatic assays. The Friedewald formula was used to calculate the LDL-cholesterol serum concentrations(Reference Niedbala, Schray and Foery38). Subsequently, the serum non-HDL-cholesterol concentrations were calculated by subtracting the serum concentrations of HDL-cholesterol from that of total cholesterol. Glycated HbA1c values were measured using the HPLC.
Statistical analysis
Data are expressed as means and standard deviations for continuous variables, percentages for discrete variables and inter-quartile ranges (50 percentile (25/75 percentile)) for variables with a significantly skewed distribution. We used a trend analysis for comparisons among multiple groups. Therefore, linear trends in participant characteristics across the TSB concentrations as five categorical variables were analysed using either the Jonckheere–Terpstra trend test or the Cochran–Armitage trend test as appropriate. Similarly, the relationship between changes in fish consumption and changes in TB also used trend analysis. We performed multiple stepwise regression analysis using the TSB concentrations as the dependent variable. The independent variables included age, sex, BMI and statistically significant factors (P< 0·05) across the TSB concentrations in the linear trend test. Habitual fish consumption is positively associated with healthy lifestyle behaviours (e.g. aerobic exercise and no smoking habit)(Reference Adeyemi and Olayaki25,Reference Bulmer, Verkade and Wagner26) . Thus, a two-way ANOVA was used to confirm the effect of the interaction between fish consumption and lifestyle behaviours on TSB concentrations.
Next, to examine the difference in the association between fish consumption and TSB concentrations with each inflammatory marker, we developed two multivariate linear analysis models with the dependent variables being the serum CRP concentration and leukocyte count and the independent variables being the fish consumption and TSB concentration. These analyses were adjusted for age, sex, BMI, presence or absence of a cigarette smoking habit and the presence or absence of treatment with antihypertensive, antidiabetic, lipid-modifying and antihyperuricemic medications. We performed all statistical analyses using the Statistical Package for the Social Sciences (SPSS), version 24.0 (SPSS Inc.).
Results
Participant characteristics
The study included 58·9 % men (n 4841) and 41·1 % women (n 3411). The average age of the 8292 participants was 46·7 (sd 13) years (men: 48·3 (sd 12·7) years (range: 18–92 years), women: 44·4 (sd 13·1) years (18–89 years)). Table 1 shows the participant characteristics across the four TB concentration categories. Figure 2 shows the distribution of weekly frequency and amount of fish consumption. The average weekly amount of fish consumption was 143·9 (sd 88·4) g (range: 0–592·2 g). The average frequency of fish consumption was 2·30 (sd 1·32) days per week.
Table 1. Comparison of participants’ characteristics according to categorical total serum bilirubin concentrations (Mean values and standard deviations; numbers and percentages)
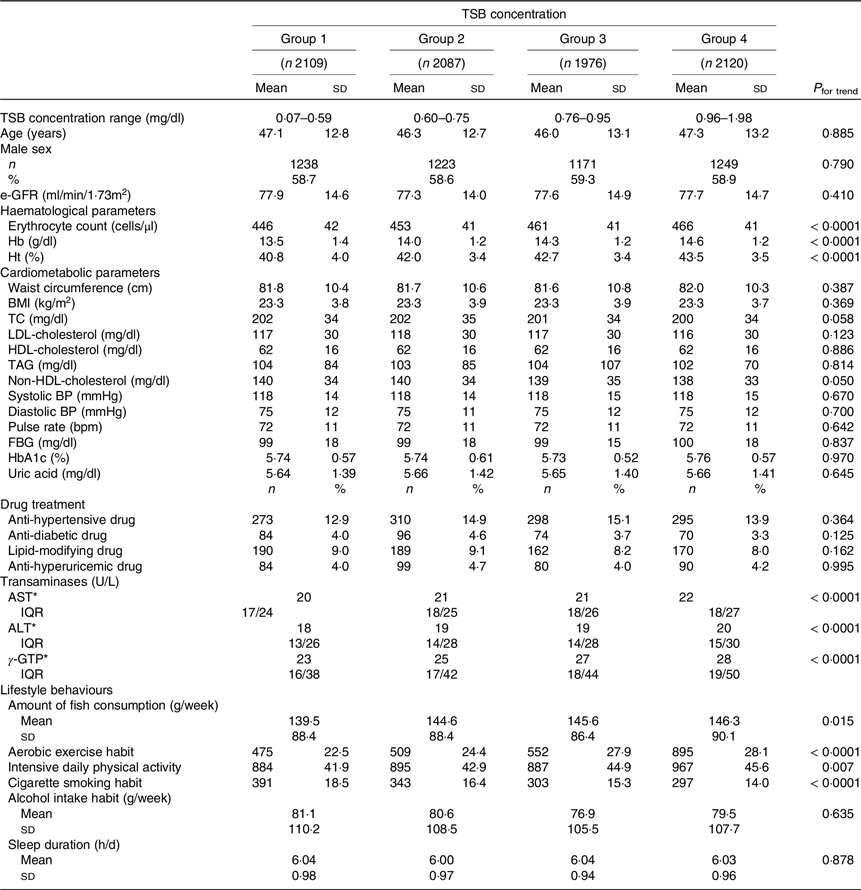
TSB, total serum bilirubin; e-GFR, estimated glomerular filtration rate; TC, total cholesterol; BP, blood pressure; FBG, fasting blood glucose; HbA1c, glycated haemoglobin; AST, aspartate aminotransferase; ALT, alanine aminotransferase; γ-GTP, γ-glutamyl transpeptidase.
* Indicates inter-quartile range.
The amount of fish consumption indicates the average amount of days of fish consumption per week. Aerobic exercise habit was defined as performing aerobic exercise for more than 30 min at least twice per week. Intensive daily physical activity was defined as walking or engaging in similar physical activity for 1 h or more per day in daily life. The average weekly alcohol consumption was calculated from the number of alcoholic drinks consumed per week and the amount of alcohol consumed per drink (ethanol equivalent (g/week)).
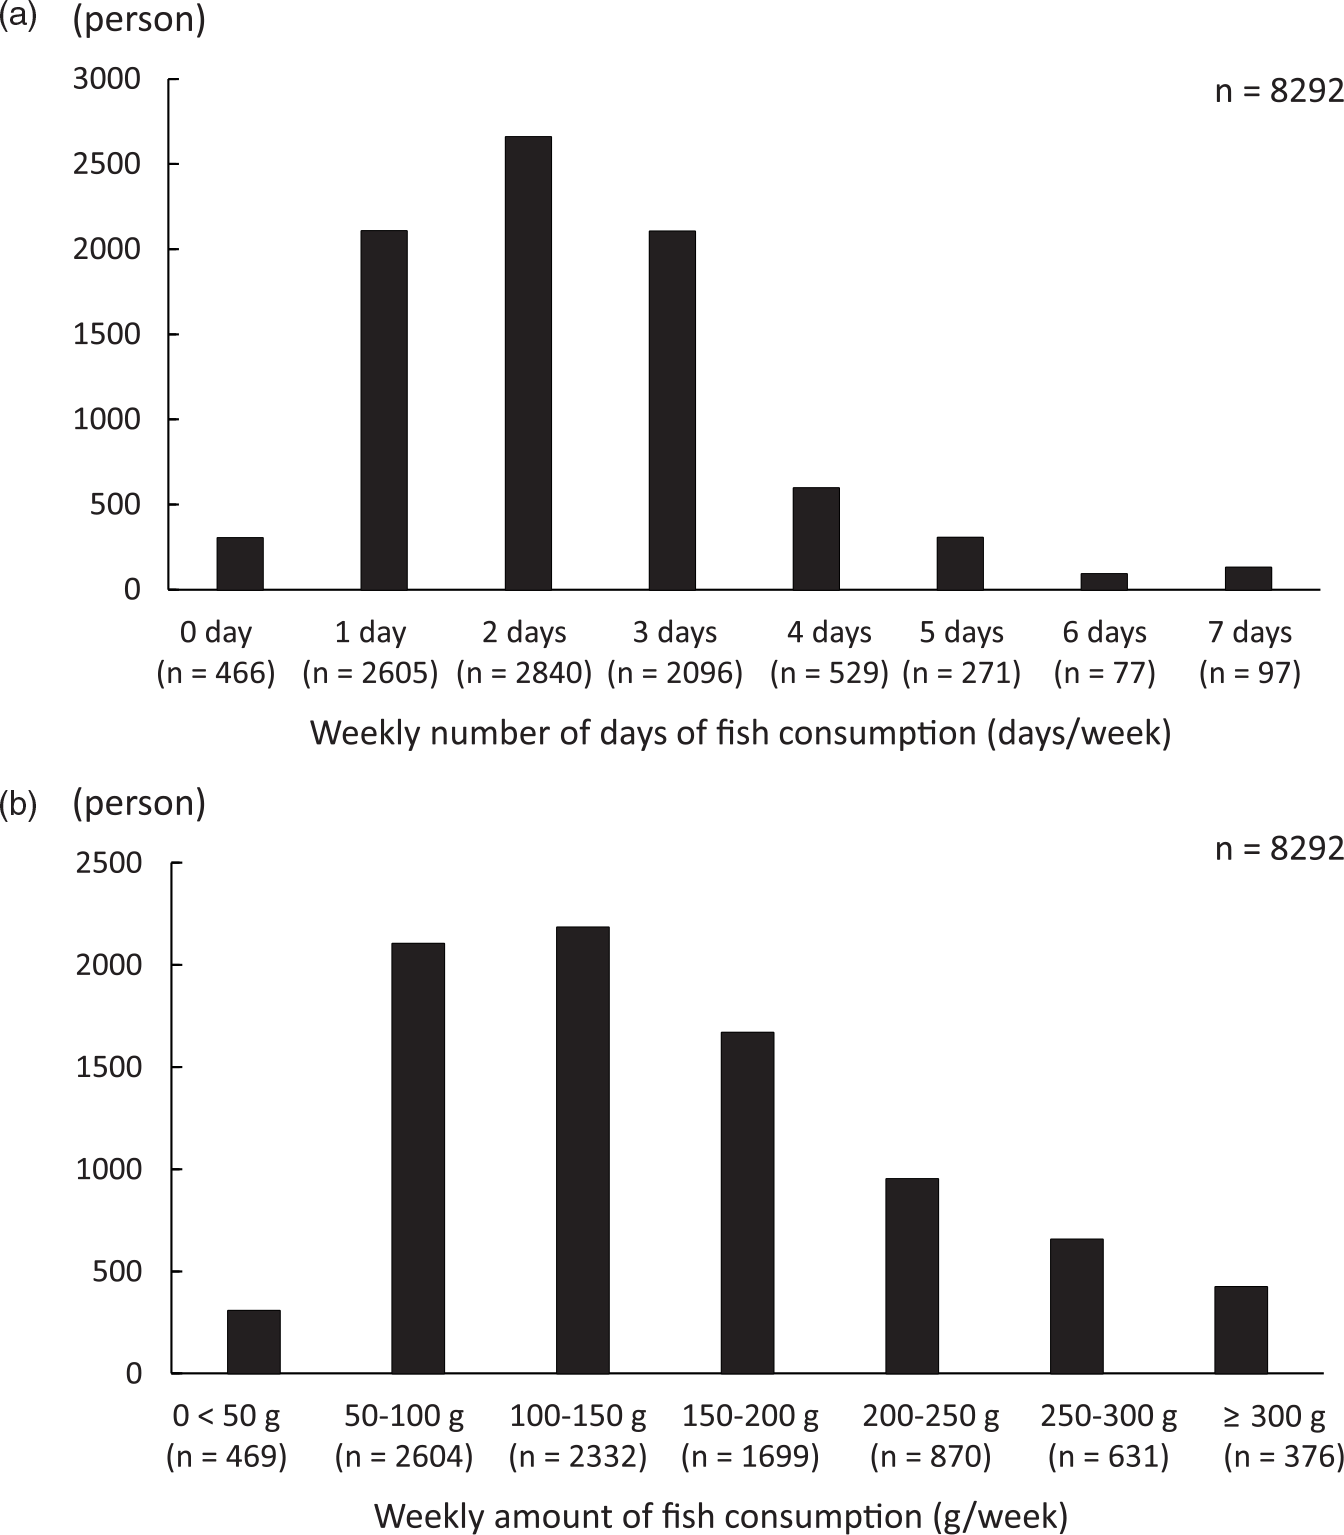
Fig. 2. Consumption of fish among participants. (a) The number of days in a week that fish was consumed. (b) The total weekly fish consumption.
Total serum bilirubin concentrations according to the amount of fish consumed
We conducted the Jonckheere–Terpstra trend test with the amount of fish consumption as the dependent variable and TSB concentration as the independent variable to examine the changes in TSB concentrations. As the fish consumption increased, TSB concentrations increased significantly (P for trend = 0·003) (Fig. 3), establishing an association between higher fish consumption and higher TSB concentrations.

Fig. 3. Total serum bilirubin concentrations according to the weekly amount of fish consumed. TSB, total serum bilirubin.
Comparison of participant characteristics according to total serum bilirubin concentrations
As the TSB concentrations increased, haematological parameters (erythrocyte count, Hb concentration and haematocrit) increased significantly (all P< 0·0001). Transaminases (aspartate aminotransferase, alanine aminotransferase and γ-glutamyl transpeptidase concentrations) also increased significantly (all P< 0·0001) with the TSB concentrations. Fish consumption increased significantly as the TSB concentrations increased (P= 0·015). As the TSB concentrations increased, the proportion of subjects engaging in habitual aerobic exercise (P< 0·0001) and those with intensive daily physical activity (P= 0·007) increased significantly, and those with cigarette smoking habits decreased significantly (P< 0·0001). No significant associations between the TSB concentrations and other variables were observed (Table 1).
Comparison of lifestyle behaviours according to the amount of fish consumed
As fish consumption increased, the proportion of participants engaging in aerobic exercise and the proportion of participants with intensive daily physical activity increased (P< 0·0001 for all). The proportion of participants with a cigarette smoking habit decreased as fish consumption increased (P< 0·0001), that is, fish consumption habits were associated with non-smoking. Thus, fish consumption was significantly associated with healthier lifestyle behaviours (Fig. 4).
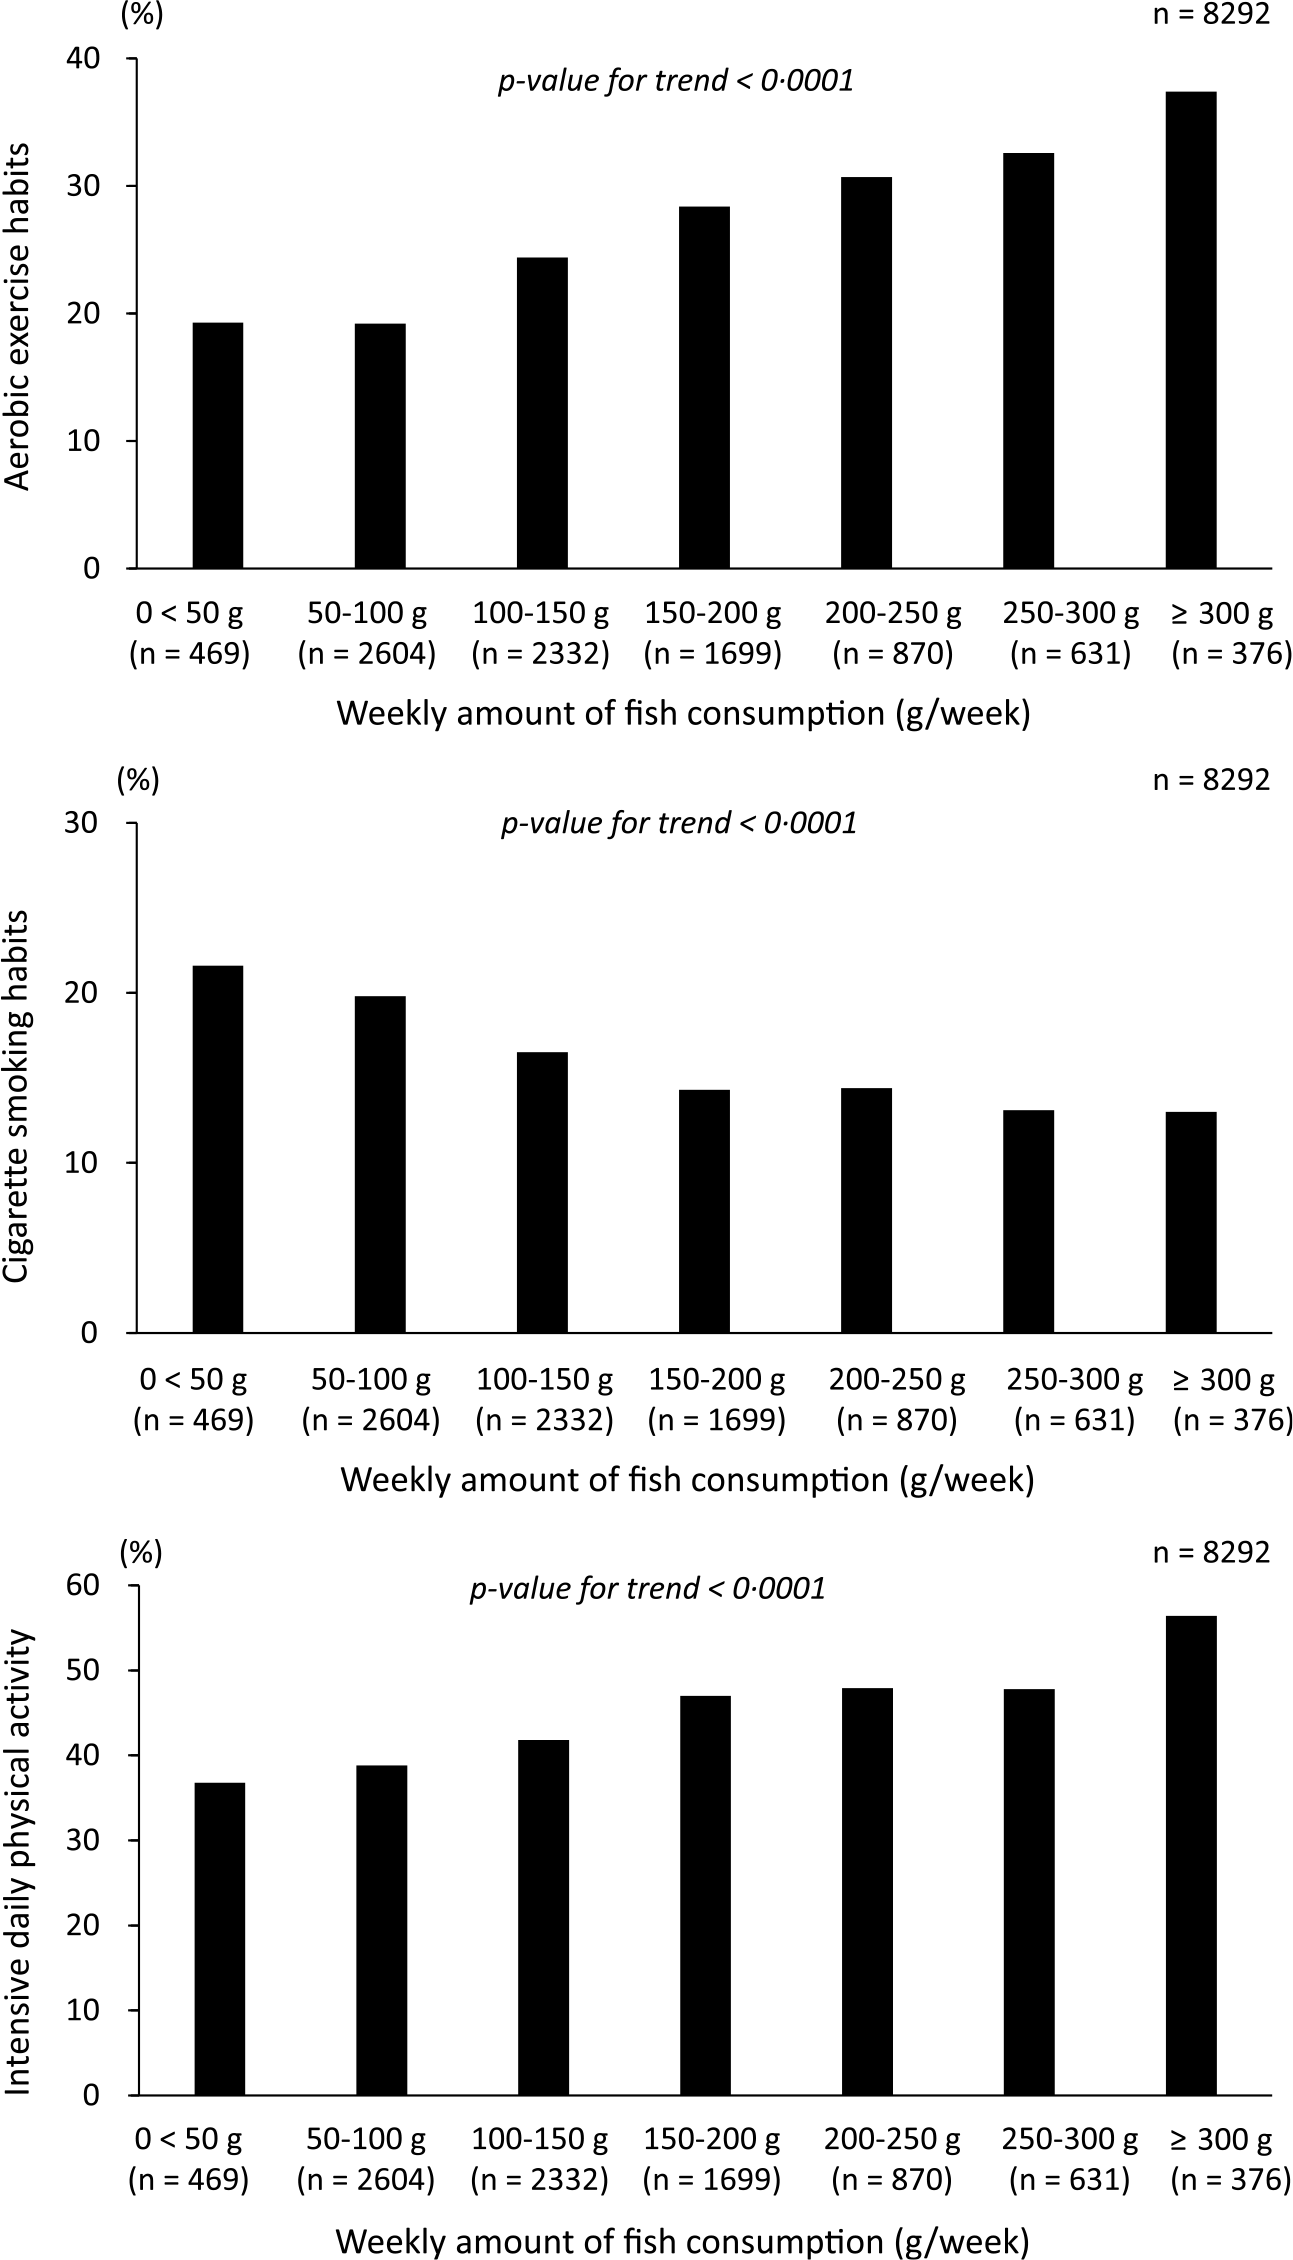
Fig. 4. Comparison of lifestyle behaviours according to the amount of fish consumption.
Multiple stepwise regression analysis to identify factors influencing total serum bilirubin concentrations
Because bilirubin is a metabolite of Hb, the standard partial regression coefficient of Hb value as an independent variable was high in this analysis (β = 0·302, P< 0·0001). However, higher fish consumption was also a weak but independent determinant of higher TSB concentrations (β = 0·024, P= 0·023). Furthermore, aerobic exercise habits were independent determinants of high TSB concentrations (β = 0·021, P= 0·048). Cigarette smoking habit was a negative independent determinant of TSB concentration (β = −0·103, P< 0·0001).
However, intensive daily physical activity was not an independent determinant of TSB (Table 2). We performed a two-way ANOVA and confirmed that there was no interaction between fish consumption and lifestyle behaviours (aerobic exercise and cigarette smoking) with respect to their relationship to TSB concentrations (P for the interaction = 0·610). Thus, lifestyle behaviours and high fish consumption were non-interactive, independent determinants of TSB concentrations.
Table 2. Multiple stepwise regression analysis to identify factors influencing total serum bilirubin concentrations (95 % confidence intervals)
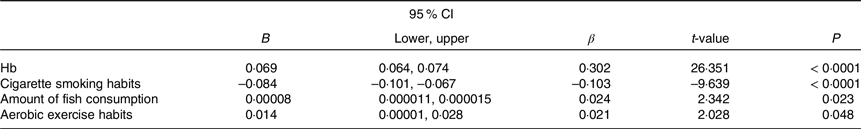
B, partial regression coefficient; β, standard partial regression coefficient, TSB, total serum bilirubin.
Multiple R = 0·305, F = 212·541, P< 0·0001.
Age, sex, BMI and factors with a P-value of < 0·05 as obtained by the linear trend test across the TSB concentrations (i.e. haematological parameters, transaminases, amount of fish consumption, aerobic exercise habit, intensive daily physical activity and cigarette smoking habit) were included as independent variables. Serum haematological parameters are highly correlated with each other. Hb was entered into the multiple stepwise regression analysis model as an independent variable. Similarly, serum transaminases were highly correlated with each other; aspartate aminotransferase was treated as an independent variable.
Inflammatory markers according to the total serum bilirubin concentration
We performed the Jonckheere–Terpstra trend test with TSB concentration as the dependent variable and inflammatory markers as the independent variable to examine the changes in leukocyte counts and CRP concentrations with increasing TSB concentrations. As the TSB concentrations increased, leukocyte counts and CRP concentrations significantly decreased (both P for trend < 0·0001) (Fig. 5).
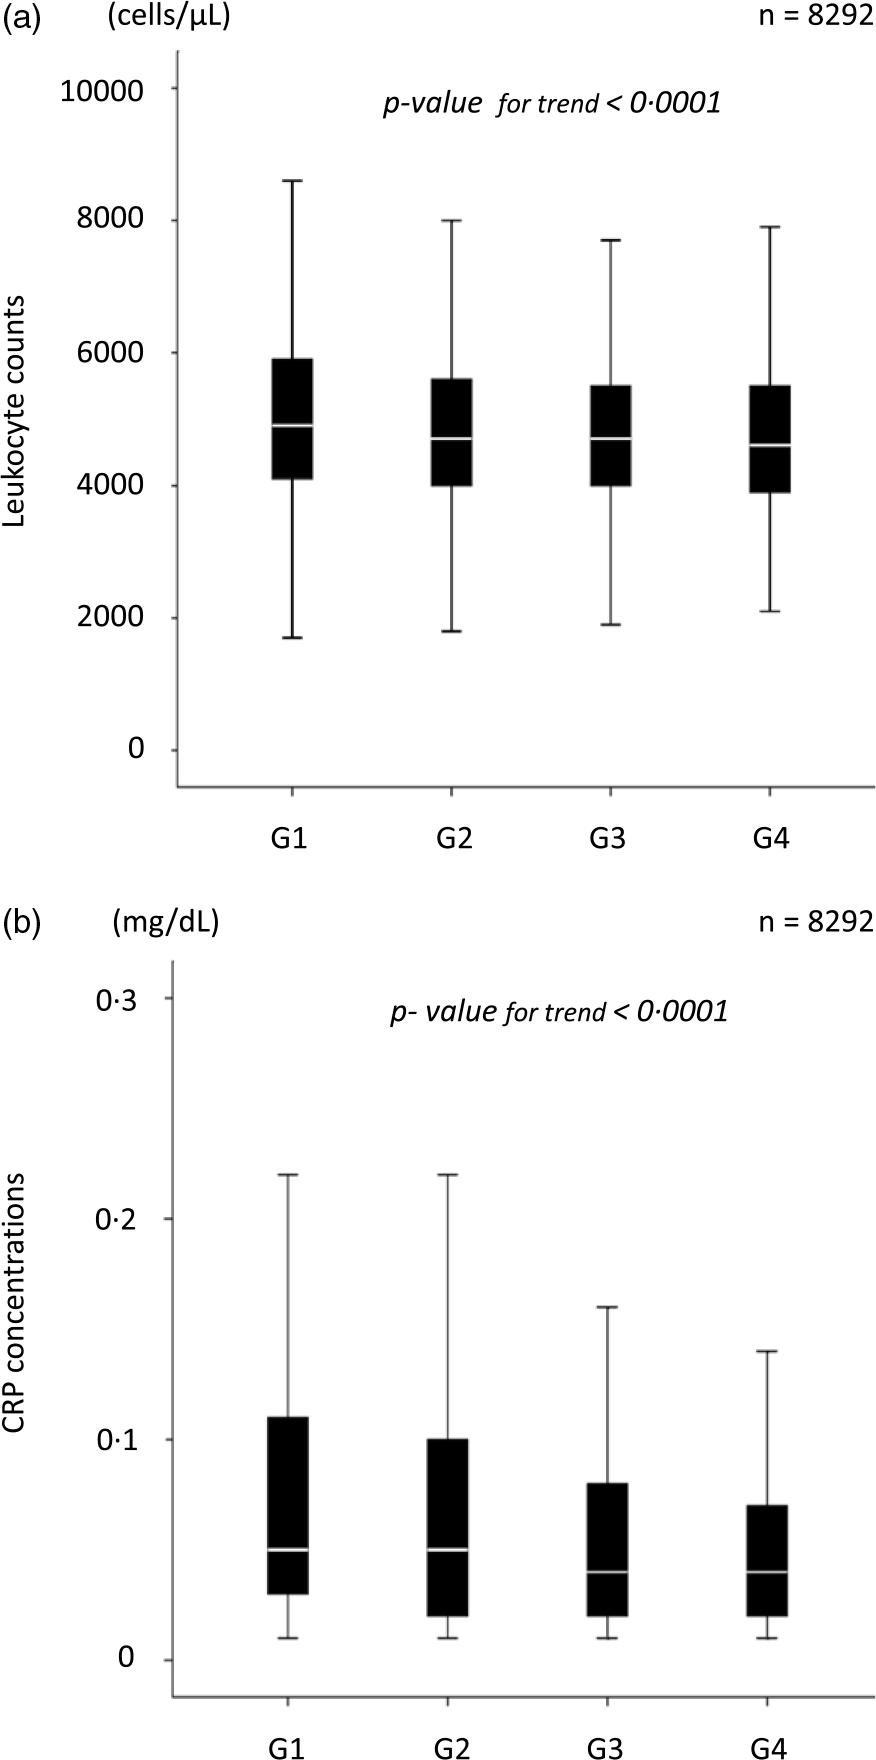
Fig. 5. Inflammatory marker levels according to the total serum bilirubin concentration. (a) Leukocyte counts according to the TSB concentrations. (b) Serum CRP concentrations according to the TSB concentrations. TSB, total serum bilirubin; CRP, C-reactive protein.
Multivariate linear regression analysis to identify determinants of inflammatory markers
We subsequently performed a multivariate linear regression analysis to confirm the differences in the association of fish consumption and TSB concentrations with inflammatory markers. Higher fish consumption and TSB concentrations were independent determinants of lower leukocyte counts. However, higher TSB concentrations, but not higher fish consumption, were independent determinants of lower serum CRP concentrations (Table 3).
Table 3. Multivariate linear regression analysis to determine the difference in the association of fish consumption and total serum bilirubin concentration with inflammatory markers
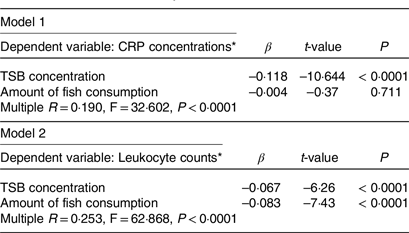
CRP, C-reactive protein; TSB, total serum bilirubin; β = standard partial regression coefficient.
* Log-transformed value was used.
These analyses were performed after adjusting for the age, sex, BMI, presence or absence of a cigarette smoking habit and presence or absence of treatment with antihypertensive, antidiabetic, lipid-modifying and antihyperuricemic medications.
Discussion
This study clarified that higher fish consumption and healthier lifestyle behaviours related to fish consumption habits were independent positive limiting factors for higher TSB concentrations. Furthermore, higher TSB concentrations were associated with lower leukocyte counts and CRP concentrations. Therefore, the results support the hypothesis that higher fish consumption and healthier lifestyle behaviour may be associated with higher TSB concentrations, leading to anti-inflammatory effects. However, the anti-inflammatory effects of fish consumption may be related to multifactorial rather than centralised associations.
Since bilirubin is a waste product produced by the breakdown of erythrocytes and the end product of heme metabolism(Reference Mozaffarian and Wu3,Reference Rimm, Appel and Chiuve4) , Hb was the most potent positive determinant of TSB in a multiple stepwise regression analysis. Not surprisingly, the contribution of higher fish consumption to TSB increases was lower than the Hb concentration. From another perspective, even when corrected for Hb concentration, a strong determinant of higher bilirubin concentration, higher fish consumption and associated favourable lifestyle habits were still associated with higher TSB concentrations.
As shown in Figure 4, higher fish consumption was associated with healthier lifestyles. Similarly, habitual fish consumption is reportedly positively associated with healthy lifestyle behaviours(Reference Wennberg, Tornevi and Johansson5,Reference Tani, Imatake and Suzuki6) . The results suggest that healthy lifestyle habits associated with active fish consumption (aerobic exercise and non-smoking habits) are also associated with higher TSB concentrations additively, that is, independently of fish consumption, using a two-way ANOVA analysis (interaction test). Populations with the dietary habit of fish consumption are often those with healthy lifestyles, which together may be responsible for the high TSB concentrations.
However, we cannot rule out the possibility that the fish consumption habit itself may influence aerobic exercise and non-smoking habits. There may be a synergistic effect between fish consumption habits and lifestyle behaviours. Accordingly, we hypothesised that not only fish consumption but also the combination of fish consumption and healthy lifestyle habits accompanying fish consumption habits were associated with higher TSB concentrations.
Several epidemiological studies have reported that moderately elevated bilirubin levels reduce the risk of developing ASCVD(Reference Horsfall, Nazareth and Petersen8–Reference Hou, Li and Si10). This mechanism is believed to primarily depend on the antioxidant activity of bilirubin; however, antioxidative and anti-inflammatory effects are inextricably linked. Symbolising this phenomenon, the TSB concentrations in this study were inversely related to the inflammatory markers predictive of ASCVD development(Reference Nakagawa, Morino and Ugi24). Amor et al. showed an inverse association among the carotid intima-media thickness, leukocyte counts and serum CRP concentrations and bilirubin concentrations in familial hypercholesterolaemia. This report partially supports our results(Reference Amor, Ortega and Perea9).
Interestingly, in this study, we showed that factors other than fish consumption were associated with higher TSB concentrations. Aerobic exercise habits seemed to be associated with higher TSB concentrations, suggesting that aerobic exercise likely activates HO, leading to higher antioxidant activity(Reference Ghio, Case and Soukup39,Reference Swift, Johannsen and Earnest40) . Conversely, smoke produced by cigarette smoking may contain many oxidants, leading to lower antioxidants in the body and consequently lower TSB concentrations(Reference Kim, Kim and Lee41,Reference Van Hoydonck, Temme and Schouten42) . All these factors may be potent in reducing or promoting the risk of ASCVD(Reference Kuwabara, Mori and Komoto43).
Higher n-3 PUFA consumption associated with higher fish consumption may activate HO to produce biliverdin from heme; biliverdin reductase produces bilirubin, the end product of heme(Reference Nissen, Tuzcu and Schoenhagen18,Reference Madjid, Awan and Willerson19) . In this process, an antioxidative action may be exerted(Reference Kishimoto, Kondo and Momiyama15). However, it remains unclear whether HO-mediated heme catabolic processes or bilirubin itself exerts an anti-atherosclerotic effect(Reference Lamina and Kronenberg44).
The anti-inflammatory effect of fish consumption is dependent on the bioactive impact of n-3 PUFA(Reference Mozaffarian and Wu3,Reference Rimm, Appel and Chiuve4) . Furthermore, the high blood EPA/arachidonic acid ratio derived from fish consumption has been established as an indicator of anti-inflammation(Reference Ohnishi and Saito45). Accordingly, we showed that the higher the fish consumption, the lower the leukocyte counts(35,Reference Tani, Kawauchi and Atsumi46) , and higher EPA/arachidonic acid ratios were independent predictors of lower leukocyte counts(Reference Tani, Takahashi and Nagao47).
As shown in Table 3, the lower leukocyte counts may be due to both the fish consumption itself and the higher TSB concentrations consequent to higher fish consumption. In contrast, the lower serum CRP concentrations may be mediated by higher TSB concentrations only through higher fish consumption. These results suggest a complex network of anti-inflammatory effects induced by fish consumption. Thus, besides the anti-inflammatory effects of the n-3 PUFA themselves, there may be some networks mediated by higher bilirubin concentrations through fish ingestion or unknown networks activated by fish ingestion. This study only examined one aspect of fish consumption-induced anti-inflammatory effects, and bilirubin may play an essential role in other signalling molecules or hormonal effects(Reference Hinds and Stec48). In other words, we propose that the anti-inflammatory effects of fish consumption may be derived from the higher fish consumption itself and higher TSB concentrations associated with higher fish consumption. Future studies are required to verify this phenomenon.
Importantly, the association between higher fish consumption and moderately elevated TSB concentrations may stem from healthy eating habits that actively incorporate fish consumption and healthier lifestyle related to fish consumption habits. We plan to conduct further studies to investigate the causal relationships between the findings in this cross-sectional study and build evidence for the mechanisms of ASCVD prevention resulting from fish consumption.
More detailed results could have been obtained by measuring serum levels of n-3 PUFA. The correlation coefficient for the association between the frequency of fish consumption and the fatty acid concentration in the erythrocyte membrane, as estimated by the FFQ, was 0·42–0·51(Reference Wennberg, Vessby and Johansson49). Therefore, we speculate that the index of the amount of fish consumption calculated from the frequency of fish intake used in this study was an approximate reflection of the fish consumption by the study participants. Furthermore, we recently reported that the frequency and amount of fish consumption were positively correlated with the n-3 PUFA consumption(Reference Adeyemi and Olayaki25). These results suggest that fish consumption is related positively to the amount of bioactive n-3 PUFA absorbed by the organs. Even in this study’s participants, the amount of fish consumption correlated highly with the amount of n-3PUFA consumption (R 2 = 0·919) determined using Japan’s National Nutrition Survey results (online Supplementary Table 3 (50) and Supplementary Fig. 1). In Japan, the world’s leading fish-consuming country(51), oily fish consumption is high and fish consumption may correspond to the n-3 PUFA consumption.
This study has some limitations. First, the major limitation of this study is that the type of fish consumed needed to be more strictly identified. This is because different types of fish contain different amounts of n-3 PUFA. Furthermore, we did not examine the consumption of vegetable oils rich in α-linolenic acids, such as rapeseed, linseed and soyabean oils, as sources of n-3 PUFA. There was no information on animal meat, which contains SFA-rich animal fats as a source of protein, and other foods such as polyphenols, which have antioxidant and anti-inflammatory effects. Alternatively, we did not have information on the intake of dietary fibre, which inhibits cholesterol absorption and prevents atherosclerosis, and processed foods that cause various health problems. Second, the amount of fish consumed in this study was recalculated by the National Institute of Health and Nutrition based on data obtained from a national nutrition survey conducted under the initiative of the Ministry of Health, Labour and Welfare in Japan on a randomly selected population. This provided reliable data but may not have accurately reflected the actual fish consumption of the participants. Our results could have been more detailed if we had used an internationally standardised questionnaire in this study(Reference Ishihara, Inoue and Kobayashi52). Third, because this study was a cross-sectional trial, causal relationships between results could not be determined. Finally, (i) we did not measure indirect bilirubin in this study; (ii) the indirect bilirubin value as a diagnostic criterion for Gilbert syndrome has not been determined and (iii) TSB concentrations may increase in fasting blood test results. Therefore, we could not definitively exclude participants with Gilbert syndrome from our study.
Conclusively, the results support the hypothesis that higher fish consumption and healthier lifestyle behaviours related to aggressive fish consumption habits may be additively or synergistically associated with higher TSB concentrations, leading to a systemic anti-inflammatory effect. Moreover, higher fish consumption was linked to lower serum inflammatory marker levels, but the association could not be explained unitarily. This association may partly explain the preventive effects of higher fish consumption on ASCVD. However, further studies are required to clarify the causal relationships in these results.
Acknowledgements
The authors specifically thank Yasuko Masuda, Kumiko Kumai and Tomoko Nakajima for their essential contributions during data generation. The authors also thank the International Medical Information Center (www.imic.or.jp/services/translation.html) for the English language review.
This research received no specific grant from any funding agency, commercial or not-for-profit sectors.
S. T., K. I, Y. S., T. Y., W. A. and A. T. conducted the clinical aspects of the research and data collection; S. T. performed the statistical analysis of the data and S. T. designed and supervised the research. S. T. wrote the paper with the support of N. M. and Y. O. and has the primary responsibility for the final content.
There are no conflicts of interest.
Supplementary material
For supplementary materials referred to in this article, please visit https://doi.org/10.1017/S0007114523001149


