


1 Introduction
Intelligence is related to reasoning performance, memory and response time as well as to life expectancy and earnings (Reference Bruine de, Parker and FischhoffBruine de Bruin, Parker & Fischhoff, 2007; Reference Chiesi, Primi and MorsanyiChiesi, Primi &, Morsanyi, 2011; Reference FrederickFrederick, 2005; Reference Toplak, West and StanovichToplak, West & Stanovich, 2011). Similarly, studies have linked cognitive ability to economic behavior found that people with high cognitive abilities are less risk averse and more patient than low cognitive abilities people. However, West, Meserve and Stanovich (2012) noted that intelligence is not always related to cognitive biases. Some biases were found to be independent of intelligence. Frederick (2005) developed a tool that tests the tendency of individuals to fall into unreflective cognitive biases. The Cognition Reflection Test (CRT) poses three simple questions that trigger individuals to answer immediately and incorrectly. Toplak et al. (2011) found that, although CRT has a strong relationship with intelligence, it accounts for some of the variation in cognitive biases when other variables are controlled. Some studies that documented the connection between CRT and behavioral biases are Reference Cokely and FeltzCokely and Feltz (2009), Reference Oechssler, Roider and SchmitzOechssler, Roider and Schmitz (2009), Toplak, et al. (2011), and West et al. (2012).
This study is aimed at using CRT questions to test whether the behavioral biases are related to cognitive abilities among Malaysians. Frederick (2005) in introducing the three items CRT to measure cognitive ability found that they are predictive of the type of choices individuals make. In addition, Frederick assessed time preference and found that individuals with high cognitive ability are more patient than the individuals with low cognitive ability.
The present study directly investigates gender, race and age differences in Malaysia. The Malaysian population is a mixture of Malay, Chinese and Indians and this population has a mixture of four major religious affiliations. In addition, several behavioral biases are investigated: the conjunction fallacy, conservatism and risk and time preferences. In investigating the relationship between cognitive abilities and behavioral biases, Oechssler et al. (2009) found that CRT is related to the conjunction fallacy, conservatism, and time and risk preferences. Although an anchoring effect was found among the respondents, it was not related to CRT. The conjunction fallacy, or what is now known as “Linda problem”, is the bias where the probability of the conjunction of two or more events or their conjunction is thought to surpass the probability of one of the events. Reference Tversky and KahnemanTversky and Kahneman (1983) found that 85% of the participants committed the conjunction fallacy. Similarly Oechssler et al. (2009) found a significant difference between different groups in the conjunction fallacy. Conservatism refers to fact that individual tend to underestimate high probabilities and overestimate low ones (Reference HilbertHilbert 2012). Oechssler et al. (2009) found that respondents with low cognitive abilities significantly underestimated the correct probability more than respondents with high cognitive abilities. In addition, Oechessler et al. (2009), in testing risk preference, found that high CRT individual tend to choose options that are risk-neutral. Time preference concerns whether an individual prefers payment now or in the future if faced with two alternatives. Oechssler et al.(2009) found low CRT group to be less patient than high CRT group.
The rationale of this study is derived from Albaity and Rahman (2012a,b), who study several behavioral traits of the Malaysian population. They found differences between races, religions and genders. Therefore this paper aims at investigating whether behavioral biases are related to cognitive abilities. We examine gender as well as ethnic group differences.
2 Data and methodology
We distributed a questionnaire containing with the three CRT question plus questions targeting the behavioral biases of interest. The sample consists of undergraduate as well as postgraduate students from two public universities in Malaysia. Note that some of the students were continuing their education after being away from it for several years. The total number of questionnaire distributed was 1000; 898 questionnaires were returned, and 880 were usable for the analysis. (The rest had missing responses.) The question measuring the CRT and the four biases can be found in Appendix 1. We used English throughout, since the medium of instruction of the two public universities we used for this study are English. Besides, our respondents said that they were comfortable answering questionnaires in English. The CRT questions were adapted from Frederick (2005) and Oechssler et al. (2009). The questions were not foreign in nature to the respondents, in the sense that the correct answers were easily understood by the respondents when explained.
3 Results and discussions
Table 1 reports the demographic profile of the respondents. Most of respondents were female (58.3%), Malay (61.7%), Malaysian (71%) and aged between 21 and 30 years old (73.4%).
Table 1: Demographic profile.
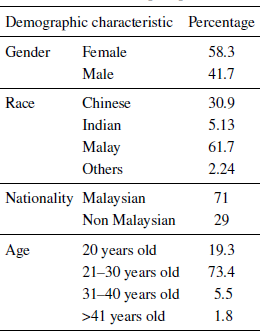
Table 2 shows the percentages of answers for each of the three CRT questions, their mean scores and standard deviations. The majority of respondents were not able to get the correct answers. The sum of total mean correct answer was 0.88, which far lower than Frederick (2005) and Oechssler et al. (2009) found in their studies.
Table 2: Mean scores, standard deviation for CRT questions.
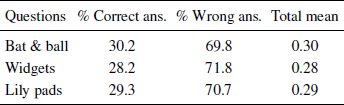
Table 3 reports the results on the effects for four demographic characteristics. T-tests, one way ANOVA (for Race) and correlations (for Age) were used to analyze the effects. Males scored higher than females across all questions. This result is in line with Oechssler et al. (2009) and Reference West and StanovichWest and Stanovich (2003). Chinese scored higher than Malay students. The mean scores indicate that young adults score higher than senior adults. However, this is true only for the first question (and overall because of this). Lastly, since the sample consists of locals and foreigners, we tested whether they differed in getting the right answers. Foreigners scored higher than locals in the lily-pads questions. When all the three questions are combined, the results do not differ a lot from the individual questions. There are still difference in mean between male and female, races and nationality, and age.
Table 3: Mean scores and effects for each question, by gender, race, age, and nationality.
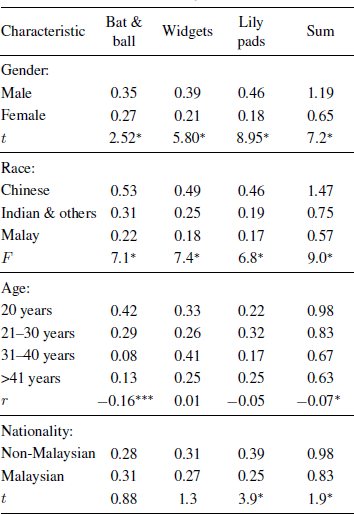
*** p<.01
** p<.05
* p<.10.
Table 4 reports the correlation between CRT groups and four behavioral biases. The CRT responses were divided based on how many correct answers are given by the respondents. Two groups were created, group one consists of respondents who answered 0 or 1 questions correct, this group is classified as low CRT score group. On the other hand, group two includes respondents who got 2 or 3 questions correct, this group is classified as high CRT score group. (The results were substantively identical when we used the number correct, without dichotomizing.)
Table 4: CRT score groups correlation with behavioral biases
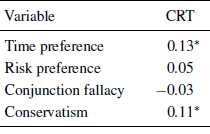
* p<.01.
Four questions measuring for behavioral biases were included measuring time and risk preferences, conjunction fallacy and conservatism. The correlation result shows that groups with low level of CRT score lower in time preference, Risk preference and conservatism but not in conjunction fallacy. The results indicate that respondents with low CRT score are significantly less patient than their counterparty. In other words, majority of the low CRT score group respondents opted for the immediate promised winnings than high CRT score group respondents. Similarly, the risk preference correlation high CRT score group seems to pick the lottery choice more than the low CRT score group however the correlation is not statistically significant. The conjunction fallacy shows the opposite results where low CRT scorers are negatively related to conjunction fallacy, however the result is not close to significant. Lastly, conservatism exhibits similar results as risk and time preference which indicate that respondents with low CRT significantly underestimated the correct probability more than respondents with high CRT. This is in line with Oechssler et al. (2009) who found similar results.
4 Conclusion
This paper explored the effect of cognitive ability on behavioral biases. In addition, it looked at demographic differences in cognitive abilities. We found that lower CRT scores are indeed correlated with overestimation of probability in a conservatism task and impatience in a time-preference judgment. The results also indicate that Chinese and males score higher than others in the three CRT questions. The results also confirm the results by Oechssler et al. (2009) and Frederick (2005).
Appendix: Test items
CRT items
A bat and a ball together cost 110 cents. The bat costs 100 cents more than the ball. How much does the ball cost? _______cents (bat & ball)
If it takes 5 machines 5 minutes to make 5 widgets, how long would it take 100 machines to make 100 widgets? _________minutes. (Widgets)
In a lake, there is a patch of roses. Every day, the patch doubles in size. If it takes 48 days for the patch to cover the entire lake, how long would it take for the patch to cover half of the lake? ________days (lily pad)
In addition, the following questions were included to measure time preference, risk preference, conjunction fallacy and conservatism. The questions were as follows.
Time preference
If you are one of the winners who receive a prize of RM100 for this questionnaire, you can pick between two alternatives.
Alternative 1: we will transfer winnings immediately after the end of the experiment.
Alternative 2: we will transfer your winnings one month after the end of the experiment with 10% premium.
Risk preference
You have a choice between two alternatives
Alternative 1: you receive RM100
Alternative 2: you receive a lottery ticket that yields a 75% chance of winning RM200, with 25% probability it is worthless.
Conjunction fallacy
Consider the following description. “Linda is 31 years old, single, outspoken, and very bright. She majored in philosophy. As a student, she was deeply concerned with issues of discrimination and social justice, and also participated in anti-nuclear demonstrations”. Which of the following two statements is more likely to be true?
Statement 1: “Linda is a bank teller”.
Statement 2: “Linda is a bank teller and is active in the feminist movement”.
Conservatism
Imagine there are two urns—urn A and urn B. Urn A contains 3 blue balls and 7 red balls. Urn B contains 7 blue balls and 3 red balls. Balls are now randomly drawn from one of these urns where the drawn ball is always placed back into the same urn. Twelve such random draws yielded 8 red balls and 4 blue balls. What do you estimate the probability that the balls were drawn from urn A?


 Open access