


Introduction
Glaciology is a small profession. Yet it is now in the process of handing the key to the riddle of climatic change, a major scientific concern, to the much larger profession of atmospheric sciences. This key provides the dynamic mechanism, a glaciological mechanism, which links Milankovitch variations in regional insolation to the global climatic cycles manifested by the waxing and waning of continental ice sheets. Glaciology also holds the key to the central scientific riddle in the earth sciences. That riddle is the mechanism whereby circulation of crystalline rock in the Earth’s mantle moves the great crustal plates on the Earth’s surface. The key is thermal convection in the much more accessible and chemically simple mantles of ice which cover Antarctica and Greenland. Yet, we do not realize that we hold this key. We look but do not see.
A Red Herring
At the third International Symposium on Antarctic Glaciology in 1981, I stated that I see convection in the Antarctic ice sheet whenever I look at remote-sensing data from radio echo-sounding. In the second edition of The physics of glaciers, Reference PatersonPaterson (1981, p. 170-71) discusses the possibility of thermal convection in the Antarctic ice sheet. He concludes his discussion with the statement, “The most convincing evidence against convection comes from radio echo-sounding records; these show layers within the ice that are continuous over distances of several hundred kilometres.” In search for alternatives that would eliminate the need for convection, Paterson has blinded himself to the most exciting glaciological prospect of our time for a major scientific break-through. But Paterson is not alone. His position is the stance of our profession.
Modeling studies of ice-sheet flow along the Byrd Station strain network (Reference WhillansWhillans, 1976) and pH lows in acidic ice layers deposited after volcanic eruptions (Reference HammerHammer, 1980) have confirmed the view of Reference Robin, Robin, Evans and BaileyRobin and others (1969) that internal radio-echo reflection horizons identify stratigraphic layers in ice sheets (although they ascribed these reflections to stratigraphic variations in density). The contention by Reference PatersonPaterson (1981), presumably, is that circulatory flow caused by thermal convection would obliterate the internal reflections by scrambling the stratigraphy.
In response to this, I would point out that thermal convection transports heat vertically because a buoyancy stress causes vertical transport of mass. The buoyancy stress is unable to drive steady-state convection unless cold ice overlies warm ice and produces a superadiabatic temperature gradient in the vertical direction, as required by the classical theory of thermal convection (Reference StruttStrutt, 1916). These conditions are never attained in the regions of the Antarctic ice sheet or the Greenland ice sheet where undisturbed radio-echo layers exist. In fact, advection of cold ice from higher elevations to lower elevations causes temperature to decrease with depth in the upper part of an ice sheet (Reference RobinRobin, 1955). The thermal buoyancy stress needed to drive convective flow cannot possibly exist in this upper layer, which is typically 1000 m thick, as measured directly down the Byrd Station core hole, for example, where the minimum temperature (Reference Ueda and GarfieldUeda and Garfield, 1970) corresponds precisely with the maximum density (Reference GowGow, 1970) at a depth of 1000 m. Consequently, radio-echo layers in the upper 1000 m of ice have no bearing whatever on whether or not thermal convection exists at greater depths. It is in this upper 1000 km where radio-echo layers extending for hundreds of kilometers are found. For Paterson to cite these layers as a reason to reject convection at deeper levels is a red herring, albeit unintentional.
Radio-echo layers can extend as deep as 3 km below the ice surface, but an echo-free zone typically occupies the lower 20 to 30% of ice over 2.5 km thick.(Reference Robin and MillarRobin and Millar, 1982). As Reference Robin and MillarRobin and Millar (1982) point out, the radar pulse is strong enough to detect internal stratigraphic horizons in many regions at depths where the echo-free zone is observed. The conclusion is that the stratigraphy has been destroyed; they say by bed roughness on a local scale, I say by convective scrambling. I do not think that bed roughness of the dimensions of the echo-free zone, 200 m to 1000 m thick, can completely obliterate the stratigraphy. Stratigraphy is preserved in ice flowing over bedrock hills having these dimensions (see figure 1 of Reference Robin and MillarRobin and Millar, 1982), and should also be preserved in ice flowing around the hills.
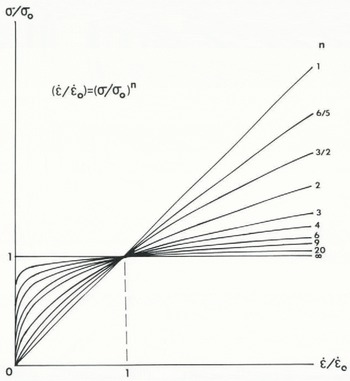
Fig. 1. The viscoplastic creep spectrum. Viscoplastic exponent n controls the relative viscous (n = 1) and plastic (n = ∞) behavior of effective strain-rate
After studying the echo-free zone at many locations and along intersecting radio-echo flight lines, Reference Robin and MillarRobin and Millar (1982) concluded: “While two-dimensional analyses involve a gradual transition of ice velocity from flowing parallel to the bed to flowing approximately parallel to the surface, the field evidence (Figure.1) presented above suggests, when considered as a whole, that the transition between shear controlled by bedrock surfaces and shear controlled internally due to mean surface slope, takes place within ice sheets at a relatively sharp boundary around the upper limit of the radio-echo non-reflecting zone”. I contend that a better explanation for the “relatively sharp boundary” is that it represents the top of convecting ice that occupies the echo-free zone. A transition zone from 100 m to 200 m thick separates the echo-free basal zone from the overlying zone of continuous radio-echo layers. The transition zone consists of “broken-up layering with very short horizontal continuity, and near-vertical cusps and fingers” that bear no relationship to bedrock topography (see figure 4 and accompanying text of Reference Robin and MillarRobin and Millar, 1982). This transition zone is what would be expected to separate upper ice, flowing by advection only, from lower ice, flowing by both advection and convection.
Had Reference PatersonPaterson (1981) contemplated the lack of radio echo stratigraphy below the density inversion, where thermal convection may be possible, instead of contemplating the abundance of radio-echo stratigraphy above the density inversion, where thermal convection definitely is impossible, he might not have dragged his red herring across the glaciological trail. If thermal convection is responsible for the echo-free zone, a criterion for thermal convection in polar ice sheets must be satisfied in the zone. I shall now attempt to develop this criterion.
A Criterion for Ice-Sheet Convection
I believe that the classical Rayleigh criterion for initiating convection in viscous fluids (Reference StruttStrutt, 1916) does not have to be satisfied for initiating convection in polar ice sheets. In viscous fluids heated from below, convection begins when the classical Rayleigh number (Ra) exceeds a critical value. By definition:
where ρ is the fluid density, g is gravity acceleration, d is the thickness of the fluid layer, α is the volume coefficient of thermal expansion in the fluid, ΔT is the temperature difference between the top and bottom surfaces of the fluid, κ is the thermometric diffusivity of the fluid, and η is the fluid viscosity.
For ice, η is the effective viscosity because it depends on the effective stress. Effective stress σ and effective strain-rate


where indices i, j represent rectilinear axes, x, y, z in the usual tensor notation, σij is a given component of the deviator stress tensor, and
Newton defined fluid viscosity as component σij of the deviator stress tensor divided by the gradient
where, by definition:
Effective viscosity is the derivative of σij with respect to
The reason for this is shown in Figure 1, which is a plot of the normalized creep equation
where
For thermal convection to occur in a polar ice sheet, effective stress σ must include a thermal buoyancy stress in addition to the stresses associated with advective flow in the ice sheet. Thermal convection begins as primary creep, for which
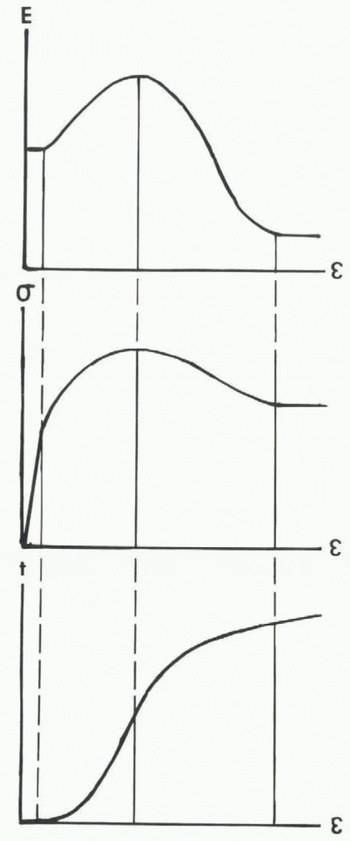
Fig. 2. Strain in polycrystalline ice having an initially random grain fabric. Effective strain ε must surmount an activation barrier in lattice distortion energy E as effective stress α increases at constant effective strain-rate or as time t increases at constant effective stress.
The first step in understanding thermal convection in polar ice sheets is examining its relationship to creep strain in polycrystalline ice. Figure 2 illustrates my conception of effective strain ε in relation to lattice strain energy E, effective stress σ, and time t since σ was applied, provided that the initial grain fabric is not compatible with the stress field and recrystal1izes to produce one that is compatible. In terms of ice-sheet convection, ε would be convection strain produced in time t by thermal buoyancy stress σ and causing lattice strain energy E.
In Figure 2, small reversible displacements of atoms from their lattice sites are represented by elastic strain εe, primary strain ε1 begins when dis-locations allow chains of atoms to break free from their lattice sites and move as line imperfections having large irreversible displacements, and secondary strain ε2 exists when dislocations are generated and annihilated at the same rate. Secondary strain has stable and unstable states of equilibrium. Unstable equilibrium maximizes strain energy, and exists when the principal axes of the stress and strain tensors do not coincide, in violation of Neumann's Principle (Reference NyeNye, 1957, p. 20-24, 104). Stable equilibrium minimizes strain energy, and exists after recrystallization to a new grain fabric which secures alignment of the principal axes, thereby satisfying Neumann’s Principle. Being intermediate between these extremes of strain energy, elastic strain can be understood as a state of metastable equilibrium (Reference CottrellCottrell, 1957, p. 105-07).
As strain increases, strain energy increases during primary creep, causing strain hardening, reaches a maximum during unstable secondary creep, followed by recrystallization and strain softening that lead to a minimum strain energy and stable secondary creep. In laboratory creep experiments at one atmosphere pressure, microcracks formed during recrystallization can cause fracture before stable secondary creep is attained. In this case, the creep curve during re-crystallization is called tertiary creep, during which strain-rate accelerates to fracture. The creep curve shows how strain varies with time at constant stress, with slow unstable secondary creep at the end of strain hardening and fast stable secondary creep at the end of strain softening both satisfying the requirement that d
The flow curve shows how strain varies with stress when strain-rate is kept constant as strain energy proceeds from metastable, to unstable, to stable equilibrium. A balance between strain hardening and and strain softening for the “hard-glide” grain fabric before recrystallization and for the “easy-glide” grain fabric after recrystallization produces upper and lower yield stresses, respectively, for which dσ/dε = 0. The upper yield stress records maximum strain hardening and the lower yield stress records maximum strain softening. These yield stresses differ from the upper and lower yield stresses which precede strain hardening in certain metals and alloys, notably low-carbon steel, and which are caused by dislocations being pinned and then released by an “atmosphere” of solute atoms (Reference DieterDieter, 1961, p. 132-34).
Laboratory creep experiments generally show that recrystallization in polycrystalline ice with an initially random or hard-glide grain fabric does not occur until ε ≈ 0.5. This greatly exceeds the infinite simal strain for which the Rayleigh criterion applies. Therefore, based on Figure 2, a useful expression for relating effective strain to the Rayleigh number for thermal convection in polar ice sheets might be:

where
Laboratory creep experiments favor two ways for incorporating effective stress σ into Equation (7):
or
where Ae is an elastic coefficient, A1 is a softness coefficient for primary creep, A2 is a softness coefficient for secondary creep, and n is the visco-plastic exponent in Equation (6), Time derivatives of Equations (8) give the following effective strain-rates:
or
Creep experiments (Reference GlenGlen, 1955; Reference Butkovich and LandauerButkovich and Landauer, 1960; Reference DuvalDuval, 1976) and theory (Reference MottMott, 1953; Reference WeertmanWeertman, 1983) support values m = (1/3) and n = 3 for which Equations (9) reduce to
or
Reference GlenGlen (1955) and Reference DuvalDuval (1976) found that
Reference DuvalDuval (1960) performed laboratory creep experiments on hollow cylindrical specimens of ice near 0° C over the stress range from 1.0 bar to 3.7 bars in uniaxial compression, torsion, or both, so that strain-rates
Equation (11) expresses the same creep behavior in terms of individual strain-rate and deviator stress components
Differentiating Equation (11) as follows

gives for effective viscosity

Incorporating η from Equation (13) into Equation (1) gives the Rayleigh number for thermal convection in polar ice sheets as
where σij is the thermal buoyancy stress, effective stress σ includes the thermal buoyancy stress and other deviator stresses associated with advective flow in ice sheets, t is time since convective flow began, d is ice thickness below the density inversion, especially where dT/dz is nearly constant, and softness coefficients B1 and B2 are evaluated for this ice layer.
Primary convective creep begins anew whenever the vertical deviator stress σzz changes, where σzz has a relatively constant buoyancy component due to the ever-present density inversion and a relatively variable advective component due to the every-varying basal traction on a local scale. Since σzz = − (σxx + σyy) and basal advective creep experiences continuous changes in σxx and σyy that compare to the buoyancy stress, and these changes occur on a local scale within a time-span of days, this is the time-span of a transient convection episode of primary creep. It is advective creep that continually resets to zero time the clock for convective creep, and this is why there can be thousands of transient thermal convection episodes at any given site in a polar ice sheet where a density inversion persists.
Bed roughness and basal sliding variations on a local scale cause the variations in σxx and σyy for advective flow that make possible the recurring episodes of convective flow controlled by primary creep. Figure 3 shows the response of the Rayleigh number to the creep curve. As time since initiation of (Figure.3) thermal convection increases, (Ra) drops from infinity during primary creep, reaches a minimum in the inflection region of slow unstable secondary creep, increases during recrystallization and tertiary creep, and attains a constant value when fast stable secondary creep is established. Any change in σzz at any point along the time axis in Figure 3 resets the curves of εzz and (Ra) to t = 0, provided that the change is comparable to the buoyancy stress. As shown in Figure 4, a sudden increase in σzz causes a sudden increase in

Fig. 3. The path to stable thermal convection in an ice sheet. Time (t) variations of the Rayleigh number (Ra) and vertical strain (εzz) at constant vertical deviator stress ( σzz ) progress from primary creep (1), through slow unstable secondary creep (2) and recrystallization during tertiary creep (3), to fast stable secondary creep (2). In laboratory creep tests at one atmosphere, microcracking during tertiary creep may suppress fast stable secondary creep, but this will not be the case near the base of an ice sheet where hydrostatic pressures are high.

Fig. 4. The effects of changing vertical deviator stresses on thermal convection in an ice sheet. Top: A sudden drop in σzz reduces εzz for advective creep, but stops convective creep because
Initiating and Sustaining Ice-Sheet Convection
Polar ice sheets are, of course, heated from below. Critical Rayleigh numbers for thermal convection in a Newtonian fluid heated from below depend on boundary conditions at the top and bottom surfaces of the fluid layer (Reference KnopoffKnopoff, 1964). This number is 657.5 when both surfaces are free, 1100.7 when one is free and the other is rigid, and 1707 .8 when both are rigid. In polar ice sheets, boundary conditions at the top and bottom of an ice layer below the density inversion are probably intermediate between free and rigid, provided that the bed is thawed. Ice above this layer is deformable and basal sliding occurs; therefore surface traction at the top and bottom of this layer is greater than zero but less than surface traction at a rigid boundary. If the bed is frozen, however, a rigid basal boundary condition would exist. A reasonable assumption would be that the critical Rayleigh number for thermal convection in polar ice sheets is of the order of 103.
Thermal convection in a polar ice sheet must begin at the onset of primary creep. This condition is satisfied at t = 0 in Equations (13) and (14), giving η = 0 and (Ra) = ∞. Provided that a thermal buoyancy stress is present, therefore, it seems to me that thermal convection must at least be initiated for the simple reason that (Ra) initially exceeds any reasonable critical value. This requirement is totally absent from initiation of thermal convection in Newtonian fluids. It forces me to completely re-think the meaning of thermal convection, since Newtonian creep is merely an end-member of the viscoplastic creep spectrum shown in Figure 1. The classical Rayleigh criterion for thermal convection in Newtonian fluids is therefore a limiting case of a more general Rayleigh criterion.
I believe the general Rayleigh criterion for thermal convection in elastic-viscoplastic materials heated from below ranges from the classical Rayleigh criterion at the viscous extreme to a criterion at the plastic extreme such that convection is absent when the thermal buoyancy stress lies below the plastic yield stress and is rampant at the yield stress (Reference OrowanOrowan, 1965). Between these extremes, convection is initiated by any thermal buoyancy stress, but is sustained only if the thermal buoyancy stress persists over the time-span needed for primary creep to be replaced by secondary creep. Equation (14) expresses this generalized Rayleigh criterion.
Rates of primary and secondary creep are equal at time t0 obtained by equating the summed terms in Equations (10b) and (11):
In laboratory creep experiments, t0 is several days when T ≈ −10° C and σ ≈ 1 bar. Although thermal convection is easily initiated, if it cannot be sustained it will be extremely transient, and capable of producing only a few per cent of strain at best.
The real meaning of Equation (14) is that it specifies conditions for sustaining, rather than initiating, thermal convection. As t increases from zero to infinity, (Ra) decreases from infinity at the onset of primary creep to a constant value for secondary creep. If (Ra) falls below its critical value at any time during this transition from primary to secondary creep, convection stops at that time. If not, convection is sustained.
To a first approximation, the thermal buoyancy stress driving convection creep is (Reference WeertmanWeertman, 1967 )

where d is the distance from the base of the ice sheet to the density inversion, a distance through which temperature decrease ΔT produces density increase Δρ. The most important deviator stress in a polar ice sheet drives advection creep, and to a first approximation it is (Reference BuddBudd, 1970):
where h is the ice-sheet thickness and θ is its surface slope in the horizontal direction x of advective creep.
A first approximation for σ is obtained from Equations (2a), (16), and (17) as

Performing the differentiation with respect to σzz

where dσxz/dσzz = 0 in my opinion. substituting Equations (16), (18), and (19) into Equation (14), for which σij = σzz, gives a first approximation for (Ra) in polar ice sheets. A second approximation would include additional stresses in computing σ, particularly longitudinal stress σxx, and more precise formulations of σxz and σzz.
An estimate of the minimum thickness d of basal ice than can sustain convection can be made from Equation (14), based on the temperature profile down the core hole to bedrock at Byrd Station in Antarctica. Reference Ueda and GarfieldUeda and Garfield (1970) found that ΔT/d ≈ 3 × 10⁻³ deg/m in ice below the density inversion, a region through which the temperature gradient is nearly constant. For ice, ρ = 0.92 Mg/m3, α = 1.53 × l0−4/deg, and κ = 10−6 m2/s. Let (Ra) = 103 for boundary conditions intermediate between free and rigid at the top and bottom of a basal ice layer having thickness d below the density inversion. Set t = ∞ so that secondary creep predominates. Values of d contained in σij, σ, and dσ/dσij from Equations (16), (18), and (19) can be disregarded because σxz ≫ σzz. The major problem in solving Equation (14) for d is choosing appropriate values of B2 and σ.
The mean temperature below the density inversion at Byrd Station is about −10° C, for which a variety of data for slow, unstable secondary creep point to A2 ≈ l0−9 bar−3 s−1 at σ ≈ 1 bar (Reference Budd, Budd, Jenssen and RadokBudd and others, 1971, table 3.1; Reference PatersonPaterson, 1981, table 3.3). Reference PatersonPaterson (1981, p. 38), however, expresses caution: “Values of A obtained in most of the other laboratory experiments are greater than those quoted here. In some cases they differ by a factor of ten (e.g. Reference Butkovich and LandauerButkovich and Landauer, 1958).” More to the point, A2for fast, stable secondary creep may be most appropriate for solving Equation (14) for d as t → ∞. A strong, single-maximum grain fabric exists for most of the ice thickness below the density inversion at Byrd Station (Reference GowGow, 1970; Reference Gow and WilliamsonGow and Williamson, 1976). This fabric approaches easy glide in single crystals, which results in strain-rates about 500 times faster than occur in randomly oriented polycrystalline ice or in hard-glide orientations in ice single crystals (Reference Weertmanweertman, 1983). The easy-glide orientation is produced by deviator stress σxz and advective flow dominated by simple shear. However, thermal convection presumably causes upwarping for ascending flow and downwarping for descending flow, which also allows easy glide by bending creep in the single-maximum ice fabric (Reference Higashi, Higashi, Koinuma and MaeHigashi and others, 1965). In this case, the ice softness coefficient for fast, stable secondary creep is appropriate, and could be as high as A2 ≃ 5 × l0−7 bar−3 s−1 at −10° C and σ ≃ 1 bar, where σxz = 1 bar is the only important deviator stress component for a smooth bed.
For d = 1164 m, the ice thickness below the density inversion at Byrd Station, Equation (14) gives A2 ≃ 4 – l0−9 bar−3 s−1 in order to sustain thermal convection. The single-maximum ice fabric vanishes in the lowest 400 m of the Byrd Station core hole, and large intergrown grains having a more random orientation were observed (Reference GowGow, 1970; Reference Gow and WilliamsonGow and Williamson, 1976). An abrupt change in ultrasonic P-wave velocities coincided with this fabric change, indicating that the fabric change is an in situ condition and not produced by subsequent recrystallization in the extracted core (Reference Gow and KohnenGow and Kohnen, 1979). An in situ fabric change implies a complex stress field imposed by rugged bed topography on a scale of 400 m around Byrd Station. I can then imagine that σxx ≈ σyy≈ 10 bars and σxy ≈ σyz ≈ σzx ≈ σzz ≈ 1 bar, giving σ ≈ 10 bars and A2 ≈ 4 – 10−11 bar−3 s−1 in order to sustain convection for d = 1164 m.
The above considerations convince me that reasonable combinations of A2 and σ exist below the density inversion at Byrd Station for sustained thermal convection (the cushion between possible values of A2 and values needed to sustain convection may reach 104). If convective flow exists, however, it is very weak compared to advective flow because the observed temperature profile down the Byrd Station core hole is close to one computed for heat transported by thermal conduction and advective creep (Reference Budd, Budd, Jenssen and YoungBudd and others, 1973). In the derivation of the critical Rayleigh number, heat transported by convection is only a small perturbation on heat transported by conduction. If sustained convection occurs in the lower 1000 m of ice at Byrd Station, it is probably too weak to give a clear signature to the temperature profile. In any case, any convection signature is mixed with other signatures related to changes in precipitation rates, ice elevation, and mean annual air temperatures, all of which have probably changed significantly during late Quaternary glaciation cycles, and are capable of influencing the whole temperature profile at Byrd Station (Reference RobinRobin, 1970; Reference WhillansWhillans, 1978, Reference Whillans1981).
To See or not to See
If thermal convection below the density inversion is marginally sustainable at Byrd Station, convection up-stream from Byrd Station to the ice divide should be more than marginal because ice thickness increases from 2164 m at the core hole to 2500 m only 10 km upstream, to 3200 m at the ice divide (Reference WhillansWhillans, 1976), and decreased ice advection rates would move the density inversion upward toward the firn-ice transition zone, which is 56 m below the surface at Byrd Station (Reference GowGow, 1970). Increased densification that reduces the size of entrapped air bubbles, however, will keep the density maximum well below the firn-ice transition.
Surface undulations having a wavelength that is about triple the ice thickness are widespread on the Antarctic ice sheet (Reference BuddBudd, 1970; Reference Budd, Budd, Jenssen and RadokBudd and Carter, 1971), and Reference Whillans and JohnsenWhillans and Johnsen (1983) have made a detailed analysis of these undulations along the Byrd Station Strain Network (BSSN), which lies close to the surface flow line along the 162 km from the ice divide to Byrd Station. Bed topography and internal radio-echo horizons have been mapped in detail by longitudinal and transverse radar sounding along the flow line. With ice velocity, temperature, fabric, texture, chemistry, and purity all measured down the Byrd Station core hole (velocity only to a depth of 1490 m), flow along the BSSN can be modeled with an unusual degree of precision.
Reference Whillans and JohnsenWhillans and Johnsen (1983) made a two-dimensional analysis of the flow pattern that, when superimposed on the average flow, produced the observed surface undulations. The analysis was limited by employing a constant Newtonian viscosity computed from strain-rates along the BSSN and by disregarding transverse surface strain-rates on the grounds that they were only about half the magnitude of longitudinal strain-rates. Surface and bed topography were entered as input to the model, and the ice flow trajectories needed to produce the surface undulations were computed as flow variations from the average flow. Not surprisingly, these trajectories consisted of vectors that ascended beneath undulation crests and descended beneath undulation troughs, and formed a circular flow pattern very much like thermal convection cells. Basal boundary conditions compatible with this circulation lay between two extremes, one in which the bed was flat but ice had sinusoidally varying basal sliding rates and one in which the bed had sinusoidal undulations but ice had a constant basal sliding rate. With the flat bed, the down-stream gradient of the total sliding velocity attained a negative maximum beneath ascending columns of flow variations and a positive maximum beneath descending columns of flow variations. With the undulating bed, the maximum uphill bed slope lay beneath ascending columns of flow variations and the maximum downhill bed slope lay beneath descending columns of flow variations, with bed slopes measured in the direction of average flow. Internal radio-echo horizons tended to lie parallel to the surface or the bed, whichever boundary was closest.
Although Reference Whillans and JohnsenWhillans and Johnsen (1983) made no attempt to provide a physical mechanism for the circulatory variation in average flow along the BSSN, beyond relating it to sinusoidal variations in basal sliding or bedrock slope, I think that thermal convective flow superimposed on the average advective flow may be the physical mechanism. In fluid convection driven by basal heating, the ratio of horizontal “wavelength” between columns of ascending flow at the centers of polygonal platform cells to the cell height is 2.83 for free upper and lower boundary conditions, 2.34 for one rigid and one free boundary, and 2.02 for both rigid boundaries (Reference KnopoffKnopoff, 1964). Surface undulations with amplitudes of about 2 m along the BSSN have wavelengths between 7 km and 50 km, with 10 km being representative, and ice thickness ranges from 2200 m to 3200 m. At Byrd Station, density decreases by 3.6 × 10⁻³ Mg/m3 in the 1164 m of ice below the density inversion. Equation (16) gives σzz = 0.03 bar and ΔT = 28 deg for these values, Reference Whillans and JohnsenWhillans and Johnsen (1983) computed variations in basal shear stress ranging from zero up to 0.8 bar as a result of the sinusoidal variations in basal sliding velocities or bedrock topography. What nucleates these stress variations when the bed is flat and no sliding variations exist? Could driving stresses for the convection-like circulatory flow that departs from average advective flow along the BSSN be nucleated by the thermal buoyancy stress for sustained convective flow, and grow as convection flow develops?
When the convective and advective flow fields are combined, with advective flow being dominant, the resulting flow field undulates gently upward and downward, as revealed by an undulating surface and undulating radio-echo layers. This is the situation that Reference Whillans and JohnsenWhillans and Johnsen (1983) observed along the BSSN, where undulations in radio-echo stratigraphy occurred even when the bed was essentially flat. Downward undulations associated with descending convection flow will lower slightly colder ice downward toward the bed, and upward undulations associated with ascending convection flow will lift slightly warmer ice upward from the bed. If the bed is uniformly at the pressure-melting point of ice, therefore, a tendency for basal freezing can be associated with downward undulations and basal melting with upward undulations. Regelation ice would then form below downward undulations, slide along the bed, and melt below upward undulations. Strong basal radar reflections exist below downward undulations. Reference Whillans and JohnsenWhillans and Johnsen (1983) attribute these reflections to ponded basal melt water, even when the bed is flat. This is consistent with convective flow, because basal melt water must flow from ascending to descending limbs of convection circulation. Moreover, the strong basal reflections may be caused partly by the basal layer of regelation ice, with entrained debris, as was found in the bottom 4 m to 5 m of the Byrd Station core hole (Reference GowGow, 1970).
It should be emphasized that the 4 m elevation change from crest to trough of surface undulations on the 10 km scale are due to alternating basal compressive and extending flow caused by weak convective flow superimposed on strong advective flow, not by differential thermal expansion between ascending the descending limbs of convective flow. A thermal buoyancy stress of 0.03 bars produces an elevation difference due to thermal expansion of only 0.1 m, as is seen by solving Equation (16) with 3 Δd/d ΔT substituted for α, since the volume coefficient of thermal expansion is triple the linear coefficient. The temperature difference between ascending and descending limbs computed from Equation (16) for this stress is 1 deg for 2500 m of ice below the density inversion.
Advective flow moves the density inversion to greater depths with increasing distance from the jce divide (Reference RobinRobin, 1955). Given the strong dependence of Rayleigh number (Ra) on depth d below the density inversion, convection that is marginally sustained near ice divides would probably be only transient toward ice margins. Transient convection would, at most, produce only a few per cent of strain; but it could occur virtually spontaneously because (Ra) would initially exceed any critical value. As long as a density inversion exists, transient convection should exist, and density inversions are widespread in the Greenland and Antarctic ice sheets.
I think the echo-free zone that commonly exists away from ice divides and in the lower 200 m to 1000 m of ice over 2000 m thick is a consequence of transient thermal convection below the density inversion. The pulse length for radar sounding is typically from 60 ns to 250 ns, which translates as 10 m to 40 m of ice, and therefore encompasses single annual precipitation layers or groups of these layers that may have high acidity from a single volcanic eruption or from a group of years marked by unusually frequent eruptions (Reference MillarMillar, 1982). These are the events recorded as radio-echo horizons. A vertical transient strain of only five per cent, for example, would displace these layers by 10 m to 50 m in ice 200 m to 1000 m thick, thereby completely obliterating the radio-echo stratigraphy. This is particularly likely in view of the fact that transient convective strain can occur time and again, so long as the density inversion exists. With each transient pulse lasting perhaps only a few days, there could be literally thousands of these events in the very old ice at depths below 2000 m in the Greenland and Antarctic ice sheets. These events would presumably be rather random, although they may cluster above deep troughs in bed topography because ice thickness below the density inversion would tend to be greater at these sites. I cannot imagine radio-echo stratigraphy surviving relentless repetitions of transient thermal convection.
Reference Robin and MillarRobin and Millar (1982) described conditions under which the echo-free zone is observed, and offered an explanation based on ice flowing around subglacial mountains as well as over the mountains. After noting that the energy of radar pulses was sufficient to detect reflecting horizons in deep ice where none existed, they stated that the echo-free zone typically began about 50 km from ice divides, and they linked the zone to increased velocity gradients of advective flow with distance from ice divides. In the lower 5 to 25% of ice thickness, three-dimensional flow of warm ice over and around sub-glacial hills and mountains causes continuous recrystallization in the continuously changing stress field imposed by rugged basal topography. Above this topography, two-dimensional flow in cold ice is con-trolled by the surface slope and ice accumulation, and causes predominantly easy glide in simple shear in the middle 30 to 50% of the ice thickness and predominantly extending flow in perhaps the top 30% of ice. These stress fields tend to produce a random ice fabric in the upper zone, a single-maximum ice fabric in the middle zone, and a multiple-maximum or circle fabric in the lower zone.
I agree that rugged bed topography can cause ice to flow around hills and mountains as well as over them. Although ice flowing over these features exhibits radio-echo stratigraphy that is warped to conform with the topography, this stratigraphy is retained. The radio-echo stratigraphy in ice flowing around these hills and mountains should therefore also be warped, but retained. It could even be argued that these warps would straighten out as ice moved into the lee of hills and mountains. How could the stratigraphy be completely obliterated to create an echo-free zone?
The “near-vertical cusps or fingers” in the transition between the echo-free zone and the unwarped radio-echo layers along an ice flow line near Vostok Station in East Antarctica, shown in figure 4 of Reference Robin and MillarRobin and Millar (1982), bear no relationship to bed topography. The gently rolling bed topographic features have an amplitude of up to 500 m and a wavelength of up to 10 km that is fairly regular, whereas the cusps and fingers are on a much finer scale, are highly irregular, and lie in a horizontal band that parallels the flat radio-echo layers above, not the rolling subglacial landscape below. An echo-free zone scrambled by endless events of transient convective creep responds to a density inversion, not bed topography, the density inversion in polar ice sheets is more a function of depth below the surface than of height above the bed, and ice along this density inversion would show a transition between complete obliteration of radio-echo stratigraphy below and complete preservation of the stratigraphy above. All this squares better with observation than does the explanation offered by Reference Robin and MillarRobin and Millar (1982).
Figure 5 of Reference Robin and MillarRobin and Millar (1982) shows a 90 km section of the East Antarctic ice sheet lying transverse to the flow direction and about half-way between Dome Circe and the Terre Adélie coast. Ice averages 3500 m in thickness, except over three summits of a subglacial massif that rises 1500 m above a relatively smooth plain. The echo-free zone occupies the lower 1000 m of ice over the plain and the lower 500 m of ice over the massif. Radio-echo stratigraphy above the echo-free zone is severely buckled almost to the ice surface. These buckles consist of broad upward bows 3 km to 10 km in width separated by sharp downward cusps, for an overall vertical relief of some 500 m in the deepest radio-echo layers. Only one upward bow exists over the three summits of the massif, however, even though these summits appear as three ridges about 3 km wide at their base and about 500 m high. The radio-echo stratigraphy to the right of the massif consists of a series of vertically stacked arches having these dimensions, but the bed is a nearly featureless plain.
Reference Robin and MillarRobin and Millar (1982) interpreted the stacked arches as resulting from two-dimensional deformation of radio-echo stratigraphy caused by ice riding up and over high rugged bedrock topography 50 km to 80 km up-stream from the plain, and they interpreted the echo-free zone below the arches as resulting from three-dimensional deformation of radio-echo stratigraphy in ice that moved both over and around the summits of the rugged subglacial landscape up-stream from the plain. While granting that radio-echo reflections produce parabolic signatures bowing upward over rugged bed topography, I would point out that glacially eroded mountains produce parabolic valleys not parabolic peaks. I am therefore suspicious of parabolic warping of radio-echo stratigraphy that Is ascribed to flow conforming with a landscape in which the parabolic glacial erosion is in precisely the opposite sense. To me, a more reasonable explanation for the regular and repeated series of arches in radio-echo stratigraphy above the echo-free zone is that arching conforms, not to a rugged up-stream topography, but to convection rolls in the echo-free zone. The pattern of thermal convection transforms from polygonal cells to elongated rolls for fluid convection in a sloping layer (Reference Low and BruntLow and Brunt, 1925; Reference DeardorffDeardorff, 1965; Reference Gallagher and MercerGallagher and Mercer, 1965; Reference Davies-JonesDavies-Jones, 1971). The slope superimposes advective flow that, if sufficiently strong, aligns columns of ascending and descending convective flow. The result is convection rolls whose axes point in the down-stream direction of advective flow, with combined advection and convection producing flow trajectories that spiral in the down-stream direction like the stretched coils of a spring. When viewed along the axes of these rolls, advective flow above the density inversion would be deformed in precisely the way shown by the radio-echo stratigraphy in figure 5 of Reference Robin and MillarRobin and Millar (1982), I believe that sustained convection rolls form in the lee of the rugged highlands up-stream from the plain because the three-dimensional deformation that exists there boosts the effective stress and therefore the Rayleigh number.
Two important papers by Reference BentleyBentley (1971[a], Reference Bentley and Crary[b]) bear on the possibility of thermal convection in the West Antarctic ice sheet, a region in which deep ice is often so warm that absorption losses obscure radio-echo stratigraphy. Reference BentleyBentley (1971[a]) reported widespread predominance of single-maximum grain fabrics, a tendency for the optic axes of grains to change progressively from a near-vertical orientation near ice divides to a near-horizontal orientation in the down-slope direction near ice margins, a rather abrupt transition at depths between 130 m and 390 m from seismically isotropic ice near the surface to seismically anisotropic ice at depth, anisotropic ice extending to the bed except in rare cases when the cluster of optic axes is not pointing in the down-slope direction, isotropy near the surface and occasionally near the base varies from a maximum of 50% in the interior at Byrd Station to a minimum of under 10% near the northern coast, anisotropy seems to be variable near the surface and relatively constant at depth, and the progressive tilt of the optic axes toward the horizontal in the down-slope direction seems to correlate with increasing longitudinal strain-rates deduced by preserving mass balance along flow lines. Reference BentleyBentley (1971[a]) noted that his observations could be better explained if thermal convection occurred in addition to normal advective ice flow.
Reference Bentley and CraryBentley (1971[b]) reported that a low-amplitude seismic reflecting layer, commonly extending from 100 m to 600 m above the bed, was widespread in West Antarctica. He suggested that this distinctive seismic signature would be produced if the layer had a unique grain fabric, was temperate, or contained morainal material, and he favored the morainal explanation because weak reflections were occasionally produced within the layer and such a thick layer of temperate ice was difficult to explain in terms of advective flow. It is interesting that all three conditions could be produced by convective flow that was as strong as advective flow, or stronger. Thermal convection would certainly produce a distinctive grain fabric. Strong thermal convection would tend to create a basal ice layer that was isothermal in the vertical, and close to temperate in ascending columns. Basal regelation ice charged with morainal debris would become distributed throughout the converting layer, and concentrations of debris would produce seismic reflections within the layer.
That is the Question
A number of questions comes to mind if thermal convection provides an important component of ice-sheet flow at depth. An anonymous referee stated, “I am not familiar enough with the echo-sounding data to have any grasp of the systematics of where echo-free zones are and how thick they are.” He noted that this information is needed to properly assess the prospects for thermal convection, I also am not properly informed in this regard, and I invite those who are to address the referee's question.
In considering the possibility of an initially infinite Rayleigh number, the referee concluded that the initially infinite rate of transient creep may include “bound viscoelastic straining that is recovered on unloading” and if this is the case, “we would expect to see thermal convection in elastic bodies.” In response, I would say that if thermal convection is defined as heat transport by mass transport in a circulatory motion, then thermal conduction can be regarded as a limiting case of thermal convection in which heat and mass transport are restricted to atoms vibrating (circulating) about their lattice sites and bumping into each other. When some atoms break free from their lattice sites and move as dislocations through the lattice, then the more general conditions for thermal convection become possible. During secondary steady-state creep, thermal convection exists as a limiting case in which atoms circulate within the confines of large cells through which a buoyancy stress exists. Between the extremes of microscopic and instantaneous “elastic convection” and macroscopic and steady-state “Rayleigh convection” lies “transient convection” in an intermediate spatial and temporal spectrum of primary creep that links the two end members.
Another interesting question concerns the mobility of surface undulations studied by Reference Whillans and JohnsenWhillans and Johnsen (1983). Surface undulations linked to bedrock undulations or ponded melt water should be immobile, but undulations may migrate with advective flow if they are linked to a superimposed component of convective flow, provided the surface undulations lie transverse to advective flow (that is, the convective component does not spiral down-slope in aligned convection rolls). Down-slope migration of transverse undulations could be an important indirect indication of weak but sustained thermal convection at depth. This migration must be distinguished from dune-migration of surface undulations exposed to katabatic winds and from down-slope migration of kinematic waves.
An important question is the relationship between the basal echo-free zone and buckled radio-echo stratigraphy above the echo-free zone on the one hand, and the density inversion and bedrock topography on the other hand. If the correlation is primarily with the height of the density inversion, thermal convection becomes an attractive possibility. However, if the correlation is primarily with bedrock topography, advective flow probably provides an adequate explanation. The same test should apply, I think, to the evidence for seismic anisotropy and the basal layer revealed by low-amplitude seismic reflections that Reference BentleyBentley (1971[a], Reference Bentley and Crary[b]) reported to be widespread in West Antarctica. In applying this test, it is important to realize that neither transient nor steady-state convective flow is sharply bounded by the density inversion. Transient primary convection is probably too weak to influence advective flow at the height of the density inversion. Steady-state secondary convection may influence advective flow above the density inversion because this represents a situation intermediate between free and rigid boundary conditions.
I am particularly intrigued by the possibility that lateral shear zones alongside ice streams may be related to the ascending limb of thermal convection rolls aligned with stream flow. Simple shear from longitudinal advective flow and vertical convective flow combine in these zones to produce the same easy-glide grain fabric and to create a warm vertical wall of ice. The ice stream lies at a lower elevation than its flanking shear zones, as if it constituted the descending limb of convective flow between ascending limbs in the shear zones. Longitudinal horst and graben structures on ice streams imply transverse tension, as if a lateral component of flow toward the shear zones was present. A link between thermal convection and ice streams is also implied by the observation that many ice streams move across a subglacial landscape that has no clear relationship to the development of stream-flow. Thermal convection may play an important role in ice-stream dynamics and, through ice-stream surges, in the stability of the West Antarctic ice sheet.
Evidence for thermal convection in basal ice of former ice sheets may exist in certain glacial land-forms deposited on a wet bed. Basal melting should occur beneath ascending columns at the centers of convection cells, leaving drumlin-like accumulations of eroded material entrained in basal regelation ice. This association between drumlin fields and steady-state convection cells in former ice sheets has been suggested by Reference DardisDardis (1981). Basal melting beneath ascending walls in convection rolls should leave esker-like accumulations of eroded material entrained in basal regelation ice. Convection rolls should radiate from domes of former ice sheets, and long eskers radiate from the Keewatin and New Quebec (Labrador-Ungava) spreading centers of the late Wisconsin Laurentide ice sheet. Convective flow should be considered when advective flow affords no clear explanation for striation directions on bedrock pavements covered by former ice sheets.
My earlier work on ice-sheet convection was largely uninformed and I prefer not to reference it. For example, I should have realized that ice effective viscosities are far too high to allow the dike-sill convection I once proposed. Moreover, sills of warm ice injected between weakly-coupled strati-graphic layers of cold ice would preserve stratigraphy and could not produce an echo-free zone. I was also unaware of what I now think is the decisive role of transient creep in producing the echo-free zone. For all that, I still would ask, by closing our minds to the possibility of ice-sheet convection, have we glaciologists fallen heir to the judgement of the apostle Paul: “You may listen carefully yet you will never understand; you may look intently yet you will never see". (Acts XXV III 26)? That is the question.


