


1. Introduction
Natural resource damage assessment (NRDA) is a process where natural resource trustees (Trustees)Footnote 1 – including federal and state agencies, as well as Indian tribes – act on behalf of the public to assess injuries to public natural resources affected by oil spills, releases of other hazardous substances, or other incidents (e.g., ship groundings).Footnote 2 Trustees identify the extent of injuries to natural resources and the services these resources support (e.g., ecological services and recreational uses), as well as the type and amount of restoration required to offset these losses.
Damage claims brought against potentially responsible parties (PRPs) are estimated in several ways for NRDA, such as the cost of restoration needed to replace affected resources or services, or the value (i.e., consumer surplus) provided to the public by them (English et al., Reference English, Peterson and Voss2009).Footnote 3 To account for differences in the timing of injuries (and restoration gains, if applicable), NRDA practitioners use discounting to convert losses (and gains) to a present value equivalent (Unsworth & Petersen, Reference Unsworth and Petersen1995; NOAA, 1999). In this paper, we reconsider the conceptual basis and empirical approaches for selecting a discount rate in the context of NRDA. We review the available evidence and provide practical guidance for NRDA practitioners to consider in selecting a rate.
NRDA presents one of the more complex applications of discounting and compounding found in economics, combining the need to address losses that may have begun multiple decades prior – a need not generally encountered in public policy analysis – with potentially long time periods of ongoing and future losses and restoration gains. With the future component, there is an analog to the field of climate change economics, such as setting the appropriate social cost of carbon, and benefit-cost analysis (BCA) more generally (Tol, Reference Tol2010; NASEM, 2017; Li & Pizer, Reference Li and Pizer2019). Discounting in NRDA tends to be most influential for hazardous waste cases where injuries began multiple decades in the past and so damages must be brought forward via discounting. This differs from oil spill cases, which tend to involve shorter time periods of injury where the outcome is less sensitive to discounting. Given the heterogeneous nature of NRDA cases, it may be that the appropriate discount rate is context-dependent. A theoretical first best method to estimate such rates would be stated preference surveys. Survey methods could be used to directly estimate a discount rate of an affected population for a specific NRDA or set of NRDAs, but such studies would likely increase assessment costs significantly, prolong resolution of claims, or both. Cost effectiveness, an important consideration in damage assessment, encourages Trustees to consider a broader, more easily accessible proxy for the discount rate.
For the past two decades, Trustees have used a real discount rate of 3 % to resolve hundreds of NRDA cases. This rate implies that resource or service losses (and restoration gains) 1 year in the future are worth approximately 3 % less than today. In 2 years, they are worth an additional 3 % less, and so on. The opposite is true of past losses, which are worth more than losses today (when converted to present value). The 3 % discount rate has historically been conceptualized as a proxy for the social rate of time preference (SRTP), which measures people’s willingness to substitute consumption of natural resources across time while holding welfare constant (NOAA, 1999; Dunford et al., Reference Dunford, Ginn and Desvousges2004; Groom et al., Reference Groom, Koundouri, Panopoulou and Pantelidis2007; Karp & Traeger, Reference Karp, Traeger and Shogren2013; Arrow et al., Reference Arrow, Cropper, Gollier, Groom, Heal, Newell, Nordhaus, Pindyck, Pizer, Portney, Sterner, Tol and Weitzman2014; Boardman et al., Reference Boardman, Greenberg, Vining and Weimer2018; Desvousges et al., Reference Desvousges, Gard, Michael and Chance2018). It reflects the fact that people (i.e., the public in NRDA cases) weight present consumption more heavily than future consumption and must be fairly compensated for deferring consumption in the past to today or sometime in the future (NOAA, 1999).
Literature on the SRTP extends back to Ramsey (Reference Ramsey1928), who sought to answer the question of how much income a nation should save. Ramsey’s basic equation describing the discount rate, which has been debated and generalized over time (Mankiw, Reference Mankiw1981; Gollier, Reference Gollier2002; Karp & Traeger, Reference Karp, Traeger and Shogren2013; Gollier and Hammitt, Reference Gollier and Hammitt2014; Groth, Reference Groth2016), has two broad components. The first is pure time preference, which reflects the fact that, all else equal, people prefer immediate benefits over delayed benefits (English et al., Reference English, Peterson and Voss2009). The second component relates to growth in income and wealth. As people acquire greater wealth over time, the value of each increment in wealth declines.
Economists wanting to evaluate the efficiency of public policies have primarily used the Ramsey equation in one of two ways to estimate the SRTP (e.g., Nordhaus, Reference Nordhaus2007; Stern, Reference Stern2007; Moore et al., Reference Moore, Boardman and Vining2013). Specifically, Arrow et al. (Reference Arrow, Cropper, Gollier, Groom, Heal, Newell, Nordhaus, Pindyck, Pizer, Portney, Sterner, Tol and Weitzman2014) discuss normative and positive methods for parameterizing Ramsey’s model. Normative methods may yield different estimates due to subjective beliefs, and such parameterizations are often used for analyses of intergenerational issues and do not necessarily fit the context of NRDA. For example, Weitzman (Reference Weitzman2001) surveyed more than 2100 leading economists to estimate the appropriate discount rate for valuing long-term environmental projects and found that the mean response was 4 %, the mode was 2 %, and the median was 3 %. More recently, Drupp et al. (Reference Drupp, Freeman, Groom and Nesje2018) surveyed economists about the risk-free social discount rate for long-term government projects and reported mean and median values of 2.3 and 2 %, respectively.
Alternatively, data can be used to positively parameterize the Ramsey equation. That is, one can use existing data to empirically estimate or parameterize the discount rate (Arrow et al., Reference Arrow, Cropper, Gollier, Groom, Heal, Newell, Nordhaus, Pindyck, Pizer, Portney, Sterner, Tol and Weitzman2014). Such descriptive approaches generally agree that parameters be chosen such that the SRTP is equal to market interest rates (Nordhaus, Reference Nordhaus1994, Reference Nordhaus2007; Arrow et al., Reference Arrow, Cline, Maler, Munasinghe, Squitieri, Stiglitz, Bruce, Lee and Haites1996; Arrow et al., Reference Arrow, Cropper, Gollier, Groom, Heal, Newell, Nordhaus, Pindyck, Pizer, Portney, Sterner, Tol and Weitzman2014). In fact, the real risk-free interest rate on investment (e.g., the real rate of return on 3-month Treasury Bills (T-Bills)) is often considered to be a surrogate for the SRTP in NRDA cases (NOAA, 1999; Dunford, Reference Dunford2018), whereas the 10-year Treasury rate is often used in BCA (OMB, 2003; CEA, 2017).Footnote 4 However, these surrogates may be problematic when the real rate of return is negative. For example, the real rate of return on 3-month treasuries has been negative in 15 of the past 20 years and on average for over 25 years. The real rate of return on the 10-year treasury has been negative in a few years during the past decade. Notwithstanding these negative rates of return, as a practical matter, the SRTP should be strictly positive for NRDA cases because the public will not pay to delay compensation for natural resource injuries. In addition, while theoretically possible, a negative SRTP is inconsistent with intuition and empirical evidence (Matousek et al., Reference Matousek, Havranek and Irsova2022).
While the application of the SRTP for discounting in NRDA arises from the economics and public policy literature, an alternative conceptual paradigm exists in tort cases. In these cases, compensation provides a sum of money that restores the injured party to the position they would have been in if the harm had not occurred (Patell et al., Reference Patell, Weil and Wolfson1982).Footnote 5 The damages should compensate the plaintiffs not only for the harm itself, but also the passage of time between when they were harmed and the date damages are awarded. This approach reflects time preference, inflation risk, and default risk. The SRTP accounts for the first two components, but not the third.Footnote 6
Several methods have been employed to generate a discount rate for tort cases – effectively an interest rate on past damages – including the use of risk-free interest rates, interest paid on demand deposits, market interest rates on corporate debt (i.e., prime rates or commercial paper), the plaintiff’s or defendant’s own borrowing costs, and the plaintiff’s past market returns on stocks (Patell et al., Reference Patell, Weil and Wolfson1982; Escher & Krueger, Reference Escher and Krueger2003; Rankin & Tepperman, Reference Rankin and Tepperman2013; Maniatis et al., Reference Maniatis, Dorobantu and Nunez2018). The prevailing view in the law and economics literature has been that the plaintiff in tort cases should receive interest at the defendant’s cost of unsecured borrowing (Escher & Krueger, Reference Escher and Krueger2003; Knoll & Colon, Reference Knoll and Colon2005; Maniatis et al., Reference Maniatis, Dorobantu and Nunez2018). This is based on the coerced loan theory, which states that the plaintiff has invested, albeit unwillingly, in the defendant and should be paid the same return that would be paid to a voluntary creditor of the defendant (i.e., the defendant’s cost of capital). This reflects the idea that, if the defendant were to declare bankruptcy, the plaintiff’s claim would be treated on par with unsecured debt. In this paper, we present the SRTP and coerced loan theory as alternative conceptual paradigms for framing the choice of discount rate in NRDA cases.
Recent work by NRDA practitioners (Desvousges et al., Reference Desvousges, Gard, Michael and Chance2018; Dunford, Reference Dunford2018) has argued for using a lower discount rate for NRDA (e.g., 2 rather than 3 %) due to declining interest rates on risk-free debt. However, the alternative coerced loan theory paradigm suggests rates higher than 3 % may be appropriate, given the weighted average cost of capital (WACC) for PRPs typically exceeds 3 %. Application of the WACC for discounting is defensible because NRDA is a legal process, distinct from public policymaking using BCA that considers the SRTP as the appropriate discount rate. In addition, using a WACC for a PRP would incorporate default risk into the discount rate – an adjustment supported by existing NRDA regulations (discussed in the next section), but not reflected in the SRTP. Quantifying NRDA damages using such higher rates would result in larger injuries relative to current practice. This higher cost of “borrowing” may incentivize PRPs to resolve NRDA claims more quickly.
In this paper, we review theory and empirical evidence to guide NRDA practitioners in their selection of a discount rate. We also evaluate arguments for moving away from the 3 % discount rate currently used in NRDA cases. We begin in the next section with a discussion of the historic regulatory basis for the current 3 % consensus. In Section 3, we then describe the two alternative conceptual paradigms – SRTP and coerced loan theory – that provide different starting points for empirical analysis. This is followed in Section 4 by a review of interest rate evidence and an illustrative example of discounting using different plausible rates. The final section provides discussion and a practical recommendation that the current 3 % discount rate be maintained by NRDA practitioners in most cases.
2. History of discounting in NRDA
In NRDA practice, natural resource injuries are separated into two categories: (a) losses to ecological resources or services and (b) human-use service losses. Ecological services include the physical and biological functions provided by air, land, water, and wildlife resources. Human uses include active and passive uses of resources, such as fishing, hunting, boating, wildlife viewing, beach use, and other recreational activities, as well as cultural and subsistence uses.
Ecological damages are typically measured in terms of the cost of restoration actions needed to provide ecological resource or service gains sufficient to offset the losses. Commonly used cost of restoration methods include HEA, REA, and related methods (English et al., Reference English, Peterson and Voss2009; Baker et al., Reference Baker, Domanski, Hollweg, Murray, Lane, Skrabis, Taylor, Moore and DiPinto2020). These methods balance annual resource or service losses against annual restoration gains to determine the appropriate amount of restoration needed in present value terms, using a 3 % real discount rate to normalize losses and gains in different years.
Human-use damages assessed by federal and state Trustees are typically measured in terms of lost value (i.e., consumer surplus) using revealed or stated preference methods (see, e.g., English & McConnell, Reference English and McConnell2015; Tourangeau et al., Reference Tourangeau, English, McConnell, Chapman, Cervantes, Horsch, Meade, Domanski and Welsh2017; Horsch et al., Reference Horsch, Leggett and Curry2018, for recent examples).Footnote 7 Damages based on the quantified lost value become the budget for human-use restoration projects. While the cost of restoration actions needed to offset the loss in value could be estimated (known as value-to-value scaling), it is uncommon in practice (see, e.g., Texas General Land Office et al., 2001, for one of the limited examples). As with ecological damages, a 3 % discount rate is used to normalize annual human-use service losses over time.
Regulations promulgated by DOI and NOAA for NRDA, as well as a supplementary NOAA technical paper (NOAA, 1999), provide guidelines to Trustees on discounting and suggest appropriate rates. As we note below, the recommended discount rates from these sources differ. We first summarize the guidelines from DOI, then from NOAA, and conclude with a summary, including how the 3 % rate came to be common practice.
The DOI promulgated regulations for NRDA in 1986 (43 CFR §11), which state that the discount rate specified in Office of Management and Budget (OMB) Circular A-94 Revised (dated 27 March 1972) should be used to calculate damages (43 CFR §11.84(e)(2)). A discount rate of 10 % was prescribed in that circular, based on “the average rate of return on private investment, before taxes and inflation” (OMB, 1972, p. 4). Circular A-94 was last updated in 1992, with the recommendation to “…use a real discount rate of 7 percent…, [which] approximates the marginal pretax rate of return on an average investment in the private sector” (OMB, 1992, p. 9).Footnote 8 NOAA promulgated its regulations for oil spill NRDAs in 1996 (15 CFR §990), which state:
“…trustees should use risk-adjusted measures of losses due to injury and of gains from the restoration action, in conjunction with a riskless discount rate representing the consumer rate of time preference. If the streams of losses and gains cannot be adequately adjusted for risks, then trustees may use a discount rate that incorporates a suitable risk adjustment to the riskless rate” (15 CFR § 990.53(d)(4)).Footnote 9
Similar, but more extensive language was used in the preamble to the final rule:
“…the trustees should use risk-adjusted measures of losses and gains, in conjunction with a riskless rate of discount reflecting the social rate of time preference for natural resources (i.e., the rate society is willing to substitute between present and future consumption of natural resources with certainty)…for goods (such as natural resources) that are not generally sold in a market, a real rate of three percent (3%) is recommended as a riskless rate, unless justification is presented for a rate more appropriate for the specific context. Alternatively, if the streams of losses and gains cannot be adequately adjusted for risks, then NOAA recommends use of a discount rate that incorporates a suitable risk adjustment to the riskless rate. Existing economic literature suggests that three percent (3%) is a reasonable choice for the social rate of time preference, given that it is the middle of the range of values for the subjective rate of time preference implied by long-run growth models of the U.S. economy” (61 Federal Register, January 5, 1996, p. 453–454).
Thus, NOAA’s NRDA regulations and preamble to the final rule suggested that risk should be incorporated into the discount rate (i.e., starting with a riskless rate of 3 % and then incorporating a risk adjustment). NOAA (1999), a technical paper issued a few years later, provided further support for using a 3 % real riskless discount rate to reflect the SRTP (p. 3).Footnote 10 That paper also stated that the risk-adjusted rate was “approximately 7 %” based on historical stock returns (NOAA, 1999, p. 10), in line with the DOI regulations (based on Circular A-94). However, NOAA (1999) recommended against incorporating risk into the discount rate, saying it was less preferred to an approach whereby “…the trustees and responsible parties agree to a contract that defines requirements for restoration and incorporates the uncertainties of restoration” (p. 10). Completing their argument, the paper went on to state, “NOAA suggests use of a riskless proxy of the SRTP for discounting interim service losses and gains. This proxy is currently approximately 3 %” (NOAA, 1999, p. 22).
In summary, DOI and NOAA regulations and guidance recommend different discount rates for NRDA. DOI recommends using the marginal pretax rate of return on an average investment in the private sector, which was 7 % in OMB (1992). While NOAA’s 1996 regulations for NRDA recommended using a risk-adjusted discount rate, NOAA (1999) recommended using a 3 % real riskless discount rate, meant to reflect the SRTP.Footnote 11 The range and basis of the proposed discount rates from DOI and NOAA (3–7 %) is consistent with Circular A-4, last updated in 2003 to provide discount rate guidance for BCA of Federal policies and projects. As a matter of practice, a real discount rate of 3 % has become the standard for NRDA cases for the past two decades.
Now that we have summarized how the 3 % discount rate came to be common practice, the following sections describe two paradigms for selecting a discount rate for NRDA and provide a range of rates for consideration.
3. The conceptual basis for discounting: two paradigms
The applied discounting problem requires the selection of a discount rate that converts the value of past or future losses (and restoration gains, if applicable) into a common current period metric. In this section, we review the conceptual basis for selecting the appropriate discount rate for NRDA. We explore two separate paradigms that have intellectual roots in different areas. We first consider the SRTP, which is the rate at which society is willing to forgo a unit of consumption this year in exchange for consumption in some future year. We explore its derivation via the classic Ramsey (Reference Ramsey1928) logic and the empirical tasks implied by the theory. We then turn to a line of legal and financial reasoning related to discounting in tort cases and explore the consequences of this literature for selecting a discount rate in NRDA cases.
3.1. Social rate of time preference
Use of the SRTP for converting past and future payments to their present value is the dominant approach in NRDA, to the point that “discount rate” and “SRTP” are often used synonymously, though with imprecise equivalency. Selection of the SRTP for the discount rate implies that the objective of conversion is to hold fixed the level of utility as payments move through time. To see this, consider a stream of consumption levels z 1, z 2, z 3,… where the subscripts denote units of time and consumption could be for an individual or a society aggregate. These consumption levels provide a stream of utility given by U(z 1), U(z 2), U(z 3),… based on a well-behaved utility function U(∙). The aggregate welfare level for an arbitrary stream of consumption and utility is
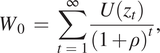 $$ {W}_0\hskip2pt =\hskip2pt \sum \limits_{t\hskip2pt =\hskip2pt 1}^{\infty}\frac{U\left({z}_t\right)}{{\left(1+\rho \right)}^t}, $$
where ρ is the utility discount rate (pure rate of time preference). Define φt as the rate at which consumption can be moved between adjacent periods while maintaining the aggregate welfare level W 0. The consumption swaps Δzt and Δz t+1 that maintain the level of aggregate welfare are therefore given by
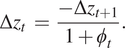 $$ \Delta {z}_t\hskip2pt =\hskip2pt \frac{-\Delta {z}_{t+1}}{1+{\phi}_t}. $$
By definition, φt is the SRTP at period t. Furthermore, define μ(zt) as the rate of consumption change between the two periods so that
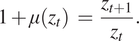 $$ 1+\mu \left({z}_t\right)\hskip2pt =\hskip2pt \frac{z_{t+1}}{z_t}. $$
Note that μ(zt) is the consumption growth rate in period t, which can in principle be positive or negative. Dasgupta (Reference Dasgupta2008) shows that if the utility function has the convenient form
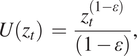 $$ U\left({z}_t\right)\hskip2pt =\hskip2pt \frac{z_t^{\left(1-\varepsilon \right)}}{\left(1-\varepsilon \right)}, $$
where ε is the elasticity of the marginal utility of consumption, then
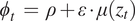 $$ {\phi}_t\hskip2pt =\hskip2pt \rho +\varepsilon \cdot \mu \left({z}_t\right) $$
holds for any generic (not necessarily optimized) consumption stream in Equation (1). We refer to this as the generic Ramsey equation and stress that it does not depend on specific assumptions about the structure of the economy or an equilibrium condition. Adding several additional assumptions related to savings, the return on capital, and an equilibrium condition,Footnote 12 the generic Ramsey equation can be expressed as
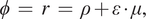 $$ \phi \hskip2pt =\hskip2pt r\hskip2pt =\hskip2pt \rho +\varepsilon \cdot \mu, $$
where r is the return on capital and μ is the steady-state consumption growth rate. We refer to Equation (6) as the equilibrium Ramsey equation.
Equations (5) and (6) are useful in different ways for the selection of a discount rate under the SRTP paradigm. The right-hand side of the generic Ramsey equation (Equation (5)) identifies the structural determinants of the SRTP without resorting to the strong assumptions needed to derive Equation (6). This allows analysts to use a prescriptive approach to selecting a discount rate whereby estimates or assumptions about the drivers of φt (in particular, the consumption growth rate and the marginal utility of consumption) are used to arrive at the discount rate. In addition, the structure in Equation (5) implies that the SRTP arises endogenously and can vary over time. This observation suggests another approach whereby φt is directly estimated by comparing consumption swaps that individuals are willing to make over time. If this direct estimation approach is feasible, the specific assumptions needed to derive and parameterize the right-hand side of Equation (6) are unnecessary for empirically determining the SRTP.
The left-hand side of the equilibrium Ramsey equation allows analysts to use a descriptive approach to selecting a discount rate, based on market interest rates. In this case, the empirical task is to study real-world interest rates to identify a suitable SRTP proxy. This interpretation has motivated empirical work to understand trends in several categories of U.S. interest rates (CEA, 2017).
A subsequent generation of economists has extended the Ramsey framework to include additional features such as uncertainty, risk, and heterogeneous consumption goods (see Karp & Traeger, Reference Karp, Traeger and Shogren2013, for a summary). This research has sought to generalize the equilibrium Ramsey equation in Equation (6) to reflect the additional elements. For example, if the intertemporal consumption path is uncertain, then Equation (6) becomes
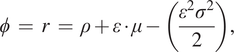 $$ \phi \hskip2pt =\hskip2pt r\hskip2pt =\hskip2pt \rho +\varepsilon \cdot \mu -\left(\frac{\varepsilon^2{\sigma}^2}{2}\right), $$
where σ 2 is the variance of consumption growth. Furthermore, extending the model to account for intrinsic risk aversion – the extent to which people prefer certain outcomes relative to uncertain outcomes – leads to an additional term so that
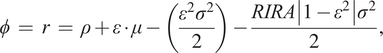 $$ \phi \hskip2pt =\hskip2pt r\hskip2pt =\hskip2pt \rho +\varepsilon \cdot \mu -\left(\frac{\varepsilon^2{\sigma}^2}{2}\right)-\frac{RIRA\left|1-{\varepsilon}^2\right.\left|{\sigma}^2\right.}{2}, $$
where RIRA measures the relative intertemporal risk aversion.
For our discussion below, it is important to note that these generalizations merely introduce additional factors into the positive description of how the equilibrium SRTP is determined. While the structure implies that higher uncertainty or greater risk aversion lowers the equilibrium interest rate all else equal, it is not correct to compare Equations (6) and (8) and conclude that the SRTP is lower in a comparative static sense, contrary to the argument in Dunford (Reference Dunford2018).Footnote 13 Said differently, Equation (8) provides additional nuance for understanding the formation of interest rates in any period, rather than evidence of a new uncertainty or risk aversion shock that is changing the interest rate in any specific period.Footnote 14
The generalizations in (7) and (8) do not fundamentally change the two possibilities for using the Ramsey equations to select a discount rate under the SRTP paradigm. Starting with Equation (6), (7), or (8), the applied task relies on the models’ equilibrium assumptions, leading to equality between the SRTP and the interest rate, and therefore an empirical understanding of market interest rates. Similarly, the generic Ramsey equation in (6) is the starting point for the subsequent equilibrium-based derivations, and so Equations (7) and (8) do not supersede the usefulness of Equation (6) for understanding the SRTP from a prescriptive perspective.
These observations are important for exploring arguments for reducing the discount rate used in NRDA (e.g., Dunford, Reference Dunford2018), which center in part on the idea that accounting for uncertainty and risk aversion lowers the SRTP, and hence provide support for a downward adjustment. As noted, the generalization in Equation (8) does imply that the equilibrium interest rate is lower when uncertainty and risk aversion are greater. However, unless there is empirical evidence that consumption growth uncertainty or risk aversion have increased recently, the generalizations in Equation (8) do not make the equilibrium Ramsey equation in (6) any more or less useful for discussing potential changes to baseline assumptions about the SRTP. Furthermore, if real interest rates on risk-free debt are to be used to create a proxy for the SRTP, it implies that the SRTP has turned negative in recent years. While theoretically possible, this seems unlikely for the NRDA cases: the public will not pay to delay compensation for injuries to natural resources.
3.2. Discounting in tort law
Use of the SRTP for NRDA relies on the implicit objective to restore the injured party (i.e., the public) to its pre-injury utility level. Discounting damages forward to the point of payment using the correct SRTP would ensure that the payment – consisting of damages suffered at the time of insult and interest on the damages – leaves the injured party (the public) indifferent in a well-being sense between accepting payment and not having suffered the injury. An alternative perspective on making the plaintiff whole is described in the law and economics literature related to tort cases. In this paradigm, the objective is to assure that the injured party is left financially unchanged from the damages as natural resources are akin to any market or nonmarket good with financial value. With this as the objective, Patell et al. (Reference Patell, Weil and Wolfson1982) describe a financial injury as being equivalent to an involuntary, unsecured loan made by the injured party to the defendant. This perspective gave rise to a “coerced loan” theory in which legal research has sought to determine the correct discount rate to convert damages at the time of injury to an equivalent time of payment amount.
The literature has described several conceptual approaches for guiding the choice of the discount rate in tort cases. Colon and Knoll (Reference Colon, Knoll, Weil, Frank, Hughes and Wagner2017) summarize this literature and argue that the defendant’s cost of unsecured borrowing is the appropriate rate. This is based on the premise that the debt held by the plaintiff is an asset that has a risk and reward structure based on the defendant’s characteristics. The relevant risk is based on the possibility that the court will reward the plaintiff with an amount equal to damages plus interest, but that the defendant will become bankrupt and default on payment. Colon and Knoll (Reference Colon, Knoll, Weil, Frank, Hughes and Wagner2017), p. 4) write:
“…if courts fail to compensate plaintiffs for the risk that defendants default, they will undercompensate plaintiffs and enrich defendants. Therefore, to put plaintiffs and defendants back into their positions before the injury occurred, plaintiffs must receive compensation for the risk that defendants will default… Accordingly, the [discount rate] should reflect the risk that the defendant defaults.”
To the extent that the damages suffered are a coerced loan, the authors argue that plaintiffs should be awarded “interest based on the rate that the defendant would pay a voluntary creditor for an identical loan.”
Other writers have proposed alternative motivations for selecting a discount rate in tort cases, with recommendations including the plaintiff’s return on capital, cost of capital, and cost of borrowing and the return on an equity market index (see, e.g., Keir & Keir, Reference Keir and Keir1983; Escher & Krueger, Reference Escher and Krueger2003). The rationales for these suggestions are based on the opportunity cost the plaintiff suffers from not being able to invest the asset in a vehicle of choice. While different arguments support the specifics, the basic principle of making the defendant financially whole motivates the analysis.
The coerced loan theory and related literature is relevant for the choice of discount rate in NRDA cases if we assume that the objective is to make the damaged party financially indifferent between compensation and the no-damage counterfactual. This is a departure from viewing the NRDA context through the lens of BCA for public investments, for which the SRTP is clearly the appropriate paradigm. Viewing NRDA from the perspective of a coerced loan suggests that the empirical choice of a discount rate should be based on assessing the defendant’s cost of borrowing so as to compensate the plaintiff for the risk of default. This logic also applies when discounting is used to compute the present value of future damages, which account for future losses and restoration gains. In that case, payment is made in the current period for a future liability. A higher risk of future default from the defendant implies that the plaintiff will accept a smaller payment in the current period due to the possibility of no payment in the future. A discount rate based on the defendant’s cost of borrowing reflects the plaintiff’s tradeoff between a certain current payment and uncertain future payment.
4. A range of empirical estimates for the NRDA discount rate
In this section, we construct a range of empirical estimates of the discount rate for NRDA based on the two paradigms discussed in the previous section. After constructing these estimates, we present the implications of using these alternative rates in a representative NRDA scenario. We use historical real rates of return on U.S. Treasury securities to construct proxies for the SRTP; these rates are often considered a reasonable surrogate (Freeman, Reference Freeman1993; OMB, 2003; CEA, 2017), although we note limitations with their application elsewhere in this paper. This leads to estimates lower than the 3 % rate currently used for NRDA. We use sector-level WACC data for representative PRP industries to construct an average estimate that would arise from the coerced loan theory paradigm. This approach leads to rates higher than the conventional 3 % rate.
4.1. Social rate of time preference – real rates of return on U.S. Treasury securities
To create a proxy for the SRTP using common convention, we calculated historical real rates of return on both 3-month and 10-year U.S. Treasury securities starting in 1981. Natural resource damages are typically assessed from the time of release or starting in 1981 – the year after the passage of CERCLA in December 1980 – whichever is later. The 3-month term is consistent with NOAA (1999), while Circular A-4 considered long-term government debt (CEA, 2017), such as the 10-year term. We compiled monthly treasury returns and inflation data from the St. Louis Federal Reserve Economic Data (FRED) service (Federal Reserve Bank of St. Louis, 2021). Specifically, we gathered nominal 3-month treasury bill yields (secondary market rates), nominal 10-year treasury constant maturity rate yields, and consumer price index (CPI) data for all urban consumers. The CPI was chosen because it is commonly applied in NRDAs (e.g., Horsch et al., Reference Horsch, Leggett and Curry2018) and the most widely used measure of inflation (BLS, 2021). The CPI is also used as an economic indicator, to deflate economic series, and to adjust government payments for programs such as Social Security (BLS, 2021).
We averaged the monthly values for these metrics to obtain annual estimates of nominal Treasury yields and inflation. Annual real rates of return on 3-month T-Bill and 10-year Treasury Notes (T-Notes) were calculated using the Fisher equation:
 $$ r\hskip2pt =\hskip2pt \frac{\left(1+i\right)}{\left(1+\pi \right)}-1, $$
where r is the real rate of return, i is the nominal interest rate, and π is the inflation rate. Table A.1 presents the annual nominal and real rates of return on Treasury securities, as well as the inflation rate. From 1981 to 2021, the average real rate of return on 3-month treasuries was 0.93 %, whereas that of 10-year treasuries was 2.68 %.
We note that the real rate of return on 3-month treasuries has been negative in 15 of the past 20 years. The average over these 20 years is also negative (−0.8 %). The real rate of return on the 10-year treasury has been negative in a few years during the past decade. This is a limitation of using real Treasury returns as a direct proxy for the SRTP. While the real interest rate can be negative in a given year or across a longer time period, the SRTP for NRDA should not be negative, in that it implies that the public would prefer to delay consumption of natural resources, all else equal. This is inconsistent with intuition and anecdotal observation that the public prefers environmental services sooner rather than later. Given this, we find that the arguments to reduce the discount rate for NRDA based on recent and often negative real rates of return on Treasury securities (e.g., Dunford, Reference Dunford2018) to be unconvincing.
4.2. Coerced loan theory – real WACC for PRP sectors
Next, we constructed a real average WACC based on data from representative PRP sectors to illustrate a potential discount rate arising from the coerced loan theory paradigm. First, we assembled median nominal WACC data for four representative PRP industries: mining and construction, oil and gas extraction, paper and allied products, and agricultural chemicals.Footnote 15 We obtained these data for 1995–2013 from Ibbotson Cost of Capital yearbooks (Ibbotson Associates, 1995–2006; Morningstar, Incorporated, 2007–2013). These yearbooks report median WACCs by sector – based on Standard Industrial Classification (SIC) codes – for Q1 of each year.Footnote 16 For subsequent years, we gathered data from Duff & Phelps’s Cost of Capital Navigator, which publishes median WACCs for Q1–Q4 of each year (Duff & Phelps, 2021).Footnote 17 Duff & Phelps reports WACCs by SIC code through Q2 2020 and switch to reporting WACCs by Global Industry Classification Standard (GICS) codes thereafter.Footnote 18 Table A.2 presents the median nominal WACCs for these four industries.
Next, we calculated the average annual WACC across the four sectors from 1995 to 2021. Because sector-level WACC data are not available prior to 1995, we estimated pre-1995 WACCs using the average spread between our calculated average WACC and the prime rate from 1995 to 2021 and applied it to the prime rate for years between 1981 and 1994. This approach provides a reasonable approximation for the purpose of our analysis given that the average WACC generally moves in tandem with the prime rate from 1995 to 2021 (Table A.2).
We gathered monthly prime rate data from the FRED service (Federal Reserve Bank of St. Louis, 2021) and calculated the average quarterly prime rate using these monthly observations. We then calculated the average spread between the WACC and prime rate using available quarterly observations across the two datasets (Q1 from 1995 to 2013 and for all quarters from 2014 to 2021), which was 4.66 %. We added this spread to the quarterly prime rates from 1981 to 1994 to estimate the average quarterly WACC across the representative PRP sectors in these quarters. We then calculated the annual WACC by averaging the results across quarters. Finally, we calculated the annual real WACC by netting out inflation using the Fisher equation. From 1981 to 2021, the average real WACC was 8.5 %.
4.3. Scenario analysis
To illustrate the impact of using alternative discount rates for NRDA, we construct a simple, but representative scenario for a hazardous waste site, in which an injury occurs over multiple past decades and future restoration to compensate for the injury spans future decades. Specifically, we assume a scenario where 1 acre of habitat is injured (i.e., 100 % degraded in its ability to provide resource services relative to baseline) in 1981 and is not returned to baseline until the end of 2021, and a restoration project that yields one credit per acre from 2021 to 2061. While the details of the scenario could be altered, our simple design is representative of the timing of injuries and restoration for a hazardous waste site and demonstrates the empirical takeaway that follows. Using the widely applied HEA approach for NRDA, we calculate the size of the restoration project needed to produce a stream of benefits (i.e., credit in discounted service acre-years (DSAYs)) that offsets the injury (i.e., debit in DSAYs). In an NRDA, the size of the restoration project would be scaled by a price per acre estimate to determine damages. Since price is invariant in this example, the required size of the restoration project can be compared across a range of candidate discount rates.
We apply five discount rates to this scenario: 1, 2, 3, 7, and 9 %. The 1 % rate is used because it is the approximate real rate of return on 3-month T-Bills between 1981 and 2021. We use 3 % because it is the approximate real return on 10-year T-Notes over the same time period, it is the standard discount rate applied in NRDA, and it is the lower bound rate applied in federal regulatory analysis (OMB, 2003). We use 2 % as a midpoint between 1 and 3 % because it was proposed for consideration by Dunford (Reference Dunford2018) and CEA (2017). Finally, we use 7 % because it is the upper bound rate applied in federal regulatory analysis (OMB, 2003) and 9 % because it is a rounded estimate of the average real WACC for representative PRP sectors listed in Table A.2.
Table 1 shows how each discount rate impacts the required scale of restoration to offset the injury. The first row shows the discounted debits for injury (in DSAYs) from 1981 to 2021, whereas the second row presents the discounted credits for restoring an acre (in DSAYs) during 2021–2061, at which time the restoration project is assumed to become nonfunctional. As the discount rate increases, the present value of the past debit increases, whereas the present value of the future credit decreases. The third row calculates the required size of the restoration project, computed as the debit divided by the credit. The final row shows how the scale of restoration depends on the discount rate decision, relative to the current 3 % standard for NRDA. While a discount rate of 1 % would more than halve damages relative to the 3 % case, applying a 9 % rate would increase damages by nearly an order of magnitude.
Table 1. Scenario analysis – impact of discount rate on scale of restoration for injuries.
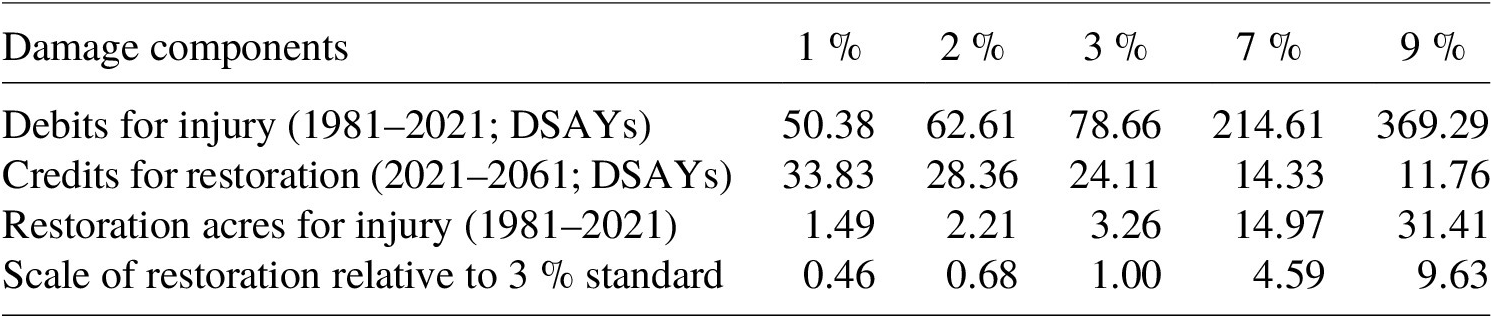
Note: The example assumes that 1 acre of habitat is injured in 1981 (i.e., 100 % degraded in its ability to provide resource services relative to baseline) and is not returned to baseline until the end of 2021. In addition, the assumed restoration project yields one credit per acre from 2021 to 2061. Debits and credits are calculated as discounted service acre-years (DSAYs).
Abbreviation: DSAY, discounted service acre-year.
5. Discussion
For the past two decades, NRDA Trustees have used a real discount rate of 3 % to resolve hundreds of cases. This paper revisits the conceptual motivation and empirical evidence for this discount rate and presents an updated range of rates arising from two alternative paradigms: the SRTP and coerced loan theory. The former implies the use of lower discount rates than the latter. For legacy hazardous waste sites in particular, where injuries may have begun multiple decades in the past, the choice of discount rate can affect damages by an order of magnitude (see Table 1).
Regulations for NRDA and related guidance for BCA suggest a range of candidate discount rates between 3 % (NOAA, 1999) and 7 % (43 CFR §11; OMB, 1992, 2003). The lower bound of this range was informed by the SRTP paradigm, whereas the upper bound was based on the marginal pretax rate of return on an average investment in the private sector. We note that the SRTP paradigm does not incorporate default risk into the discount rate, although including this risk would be consistent with existing NRDA regulations and the legal nature of NRDA. This paper extends the discussion of potentially relevant rates by considering the discount rates in tort cases and related legal precedents. This gives rise to consideration of the coerced loan theory and the notion that the plaintiff has invested, albeit unwillingly, in the defendant and should be paid the same return that would be paid to a voluntary creditor of the defendant (i.e., the defendant’s cost of capital).
Recent papers rooted in the SRTP paradigm suggest that real risk-free discount rates of 1–2 % could be used for NRDA (CEA, 2017; Desvousges et al., Reference Desvousges, Gard, Michael and Chance2018; Dunford, Reference Dunford2018; Table A.1), whereas literature rooted in the coerced loan theory paradigm and our supporting analysis (Table A.2) suggest that real risk-adjusted rates in excess of 8 % are reasonable. So which rate is correct or best? We propose two approaches to answer this question. The first is empirical, although it involves a judgment about which paradigm is most applicable. We provide data and supporting rationale for either decision. The second approach is practical and rooted in NRDA experience.
While looking to market rates as an empirical proxy for the SRTP is a tractable method (Table A.1), it is a second-best approach, given the strong assumptions necessary to link observed risk-free interest rates to the SRTP. This limitation is especially apparent in times when the real risk-free interest rate is negative, which has been the case in 15 of the past 20 years using the 3-month treasuries. The average real rate of return has been negative for more than 25 years. While the real risk-free rate can be negative, intuition suggests that the SRTP is strictly positive in NRDA cases, because the public will not pay to delay compensation for natural resource injuries. This casts serious doubt on the reliability of any technique deriving an SRTP from recent treasury yields. There remains a first-best technique for the SRTP approach. Using surveys or experiments, researchers could directly measure the actual tradeoffs members of the public are being asked to make in a particular NRDA: foregoing consumption now in exchange for a change in natural resource services in the future such that total utility is held constant over time. These studies could also be designed to elicit a risk-adjusted rate accounting for the default risk of a PRP. While some researchers have used stated preference surveys to estimate social discount rates (Kovacs & Larson, Reference Kovacs and Larson2008; Viscusi et al., Reference Viscusi, Huber and Bell2008; Meyer, Reference Meyer2013; Lloyd-Smith et al., Reference Lloyd-Smith, Adamowicz, Entem, Fenichel and Rad2021), the cost of implementing such a survey for an NRDA (or set of cases once a decade for example) could increase assessment costs significantly, prolong resolution of claims, or both. As a result, we are not aware of any stated preference studies that have estimated the discount rate in an NRDA context.
For practitioners subscribing to the coerced loan theory paradigm, the first-best empirical strategy is to construct an average WACC over the time period of analysis for the specific PRP(s) in question. A WACC is constructed by calculating a company’s cost of capital components (i.e., debt and equity capital), calculating the proportion that debt and equity capital contribute to the business, and weighting the components. Specific guidance can be found in numerous other sources (e.g., Giddy, Reference Giddy2006, Reference Giddyn.d.; Brealey et al., Reference Brealey, Myers and Marcus2020). A second-best approach under the coerced loan theory is to use the sector-level averages we have provided in Table A.2. It bears emphasis that defensible WACC estimates are available, while the application of the real risk-free rate under the SRTP is a dubious endeavor (as described in the previous paragraph). Furthermore, application of the WACC for NRDA seems most appropriate given that NRDA is a legal process, not a public policymaking context where the SRTP would be the appropriate discount rate.
In the absence of agreed-upon methods and original research for measuring the SRTP using Equation (5), or general adoption of the coerced loan theory (the latter of which we find most reasonable), selection of a discount rate for NRDA cases will continue to rely on proxies and compromise. Given this, we suggest that practitioners continue using 3 % or some rate mutually agreed upon between Trustees and PRP(s) for a given case. Hundreds of NRDAs have settled based on the 3 % rate, and it is near the middle of the range implied by the two competing paradigms – a compromise position that may be suitable for continuing to resolve NRDA claims.
To close, it seems unlikely in the foreseeable future that research will determine the “best” discount rate to use for NRDA. Therefore, this paper has provided an objective summary and assessment of the practical alternatives with the goal of offering paths forward for NRDA practitioners to consider.
Acknowledgments
This research was funded by the National Oceanic and Atmospheric Administration under Contract No. GS-10F-0061N. The views and opinions expressed in this article are those of the authors and do not necessarily reflect the official policy or position of any agency of the U.S. government. An early version of this work was presented at the 2019 Southern Economic Association annual meeting in Ft. Lauderdale, Florida. Competing interests: The authors declare none. The authors thank C. Crowley, S. Miller, G. Howard, J. Byl, X. Bi, R. Unsworth, M. Baker, C. Kelly, B. Hinrichsen, L. Lee, and C. Trabucchi for helpful comments. Any errors are our own.
Appendix
Table A.1 Social rate of time preference proxies – real returns on 3-month and 10-year treasuries.
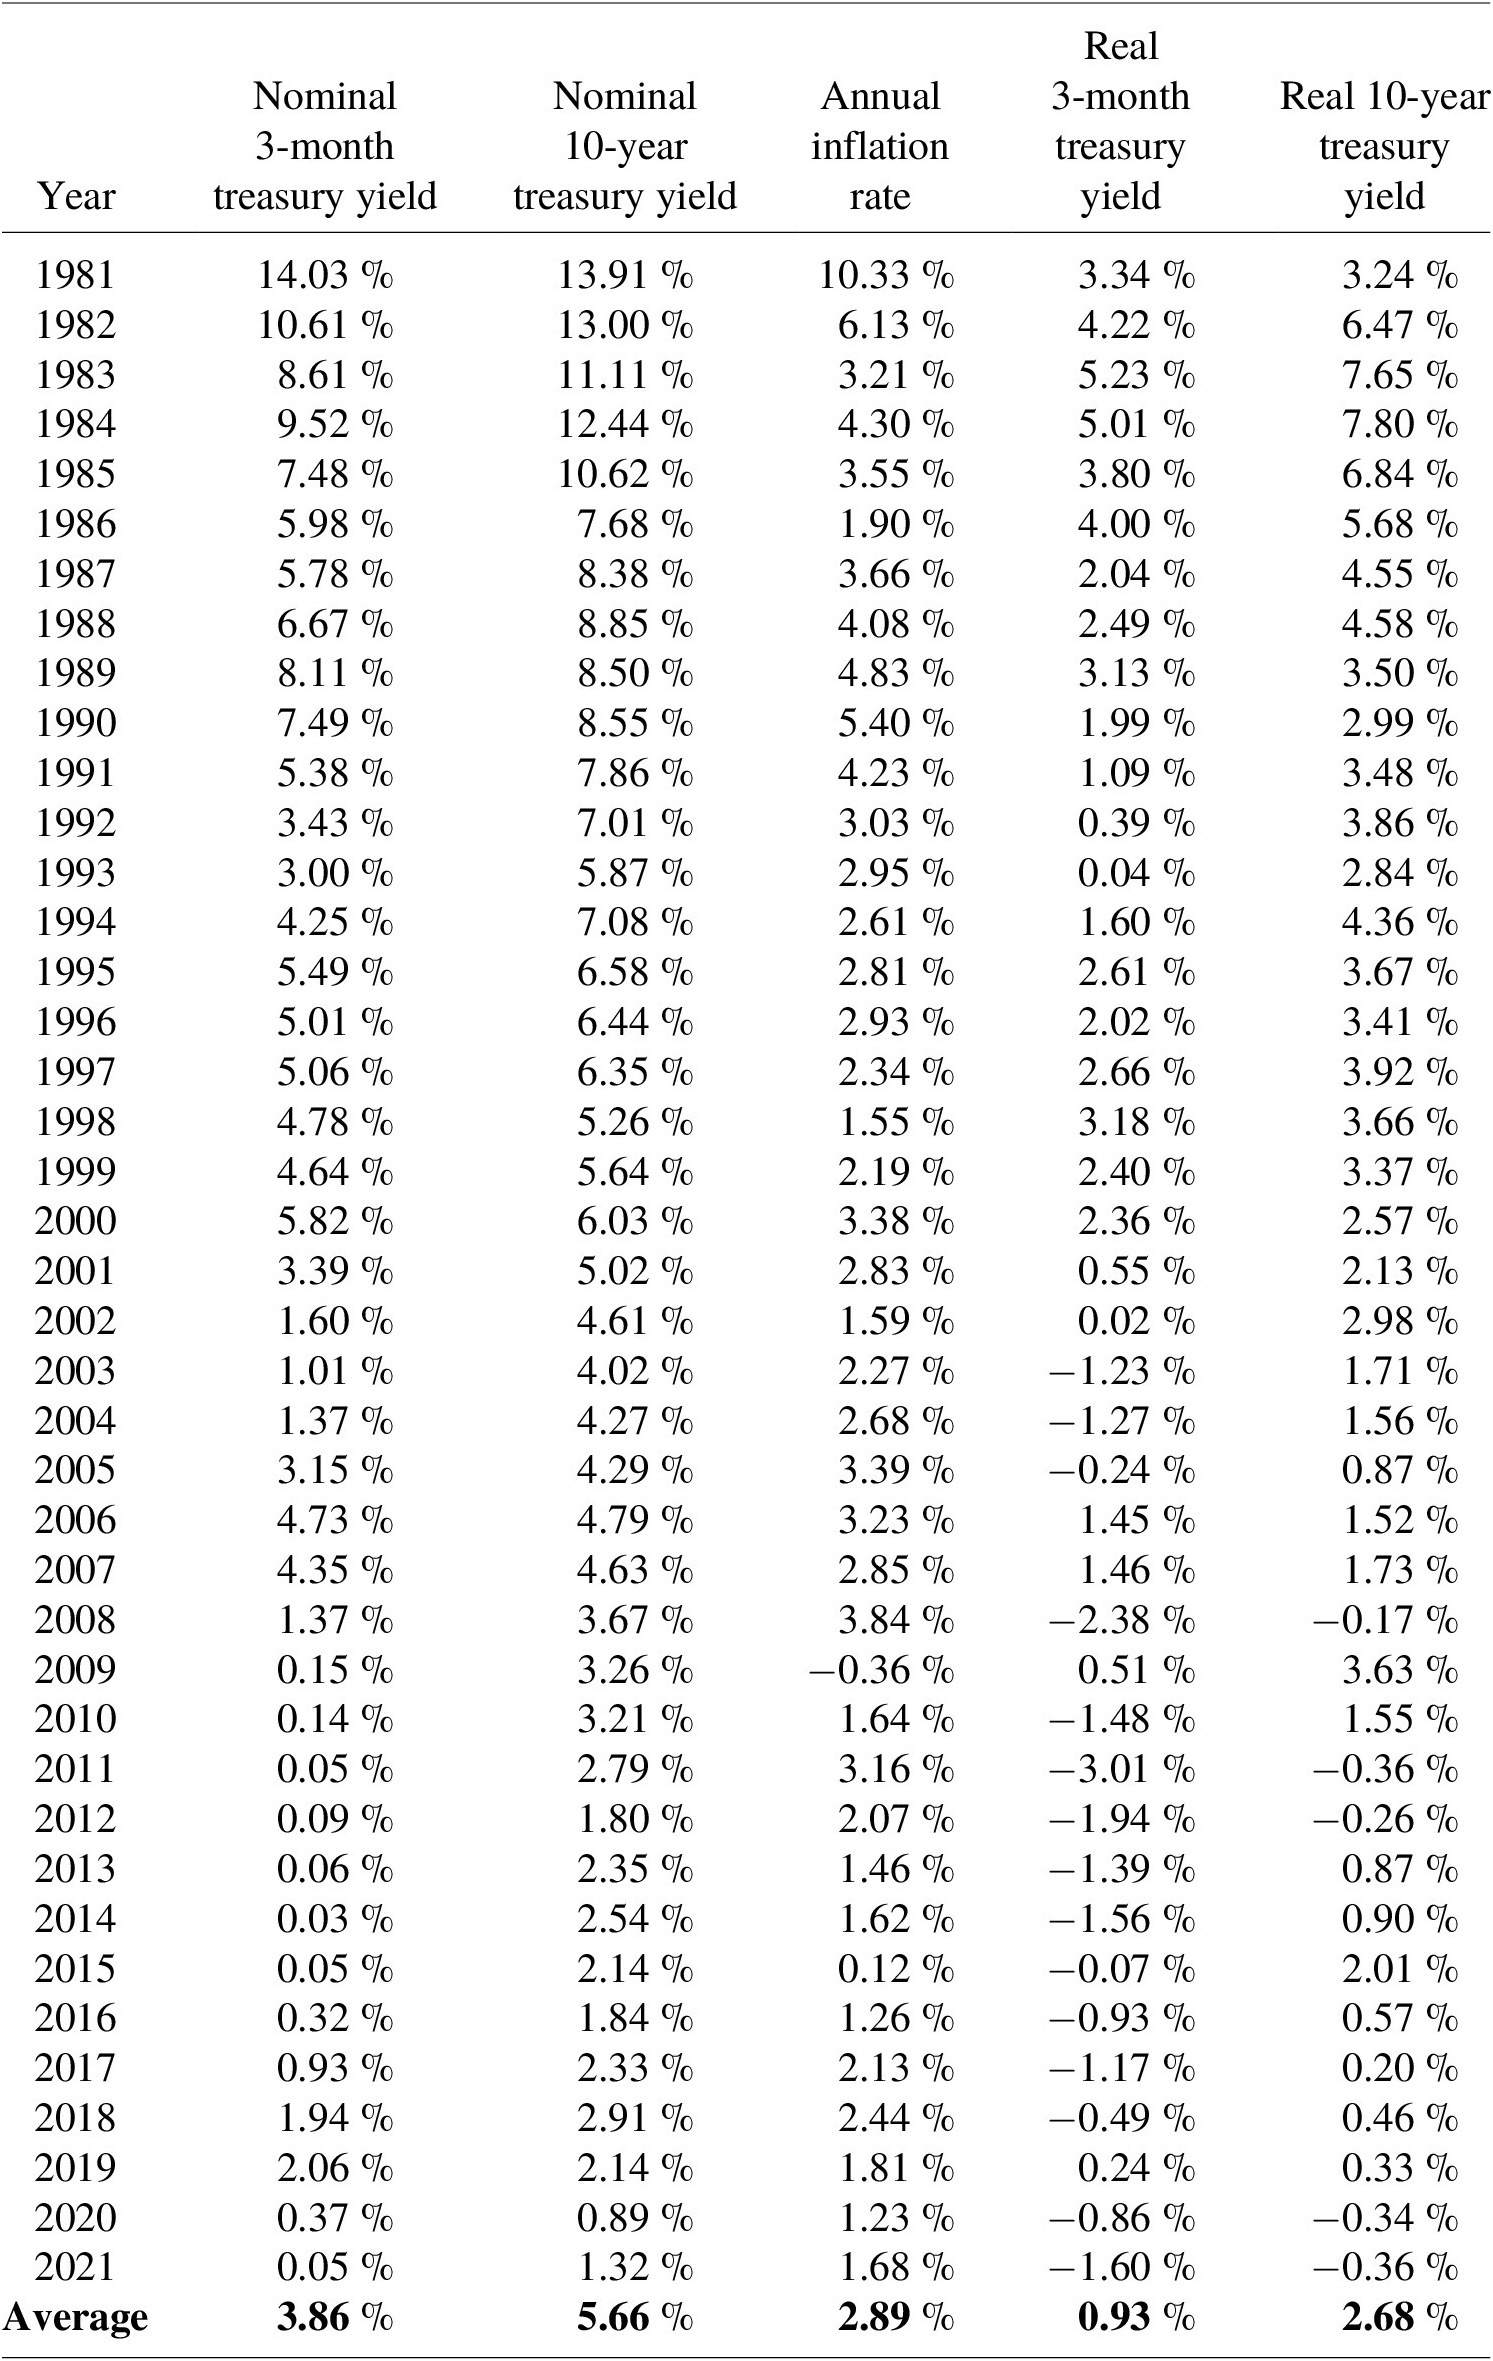
Source: All data featured in this table are from the Federal Reserve Bank of St. Louis (FRED; Federal Reserve Bank of St. Louis, 2021).
Table A.2 Historical WACCs for PRP industries.
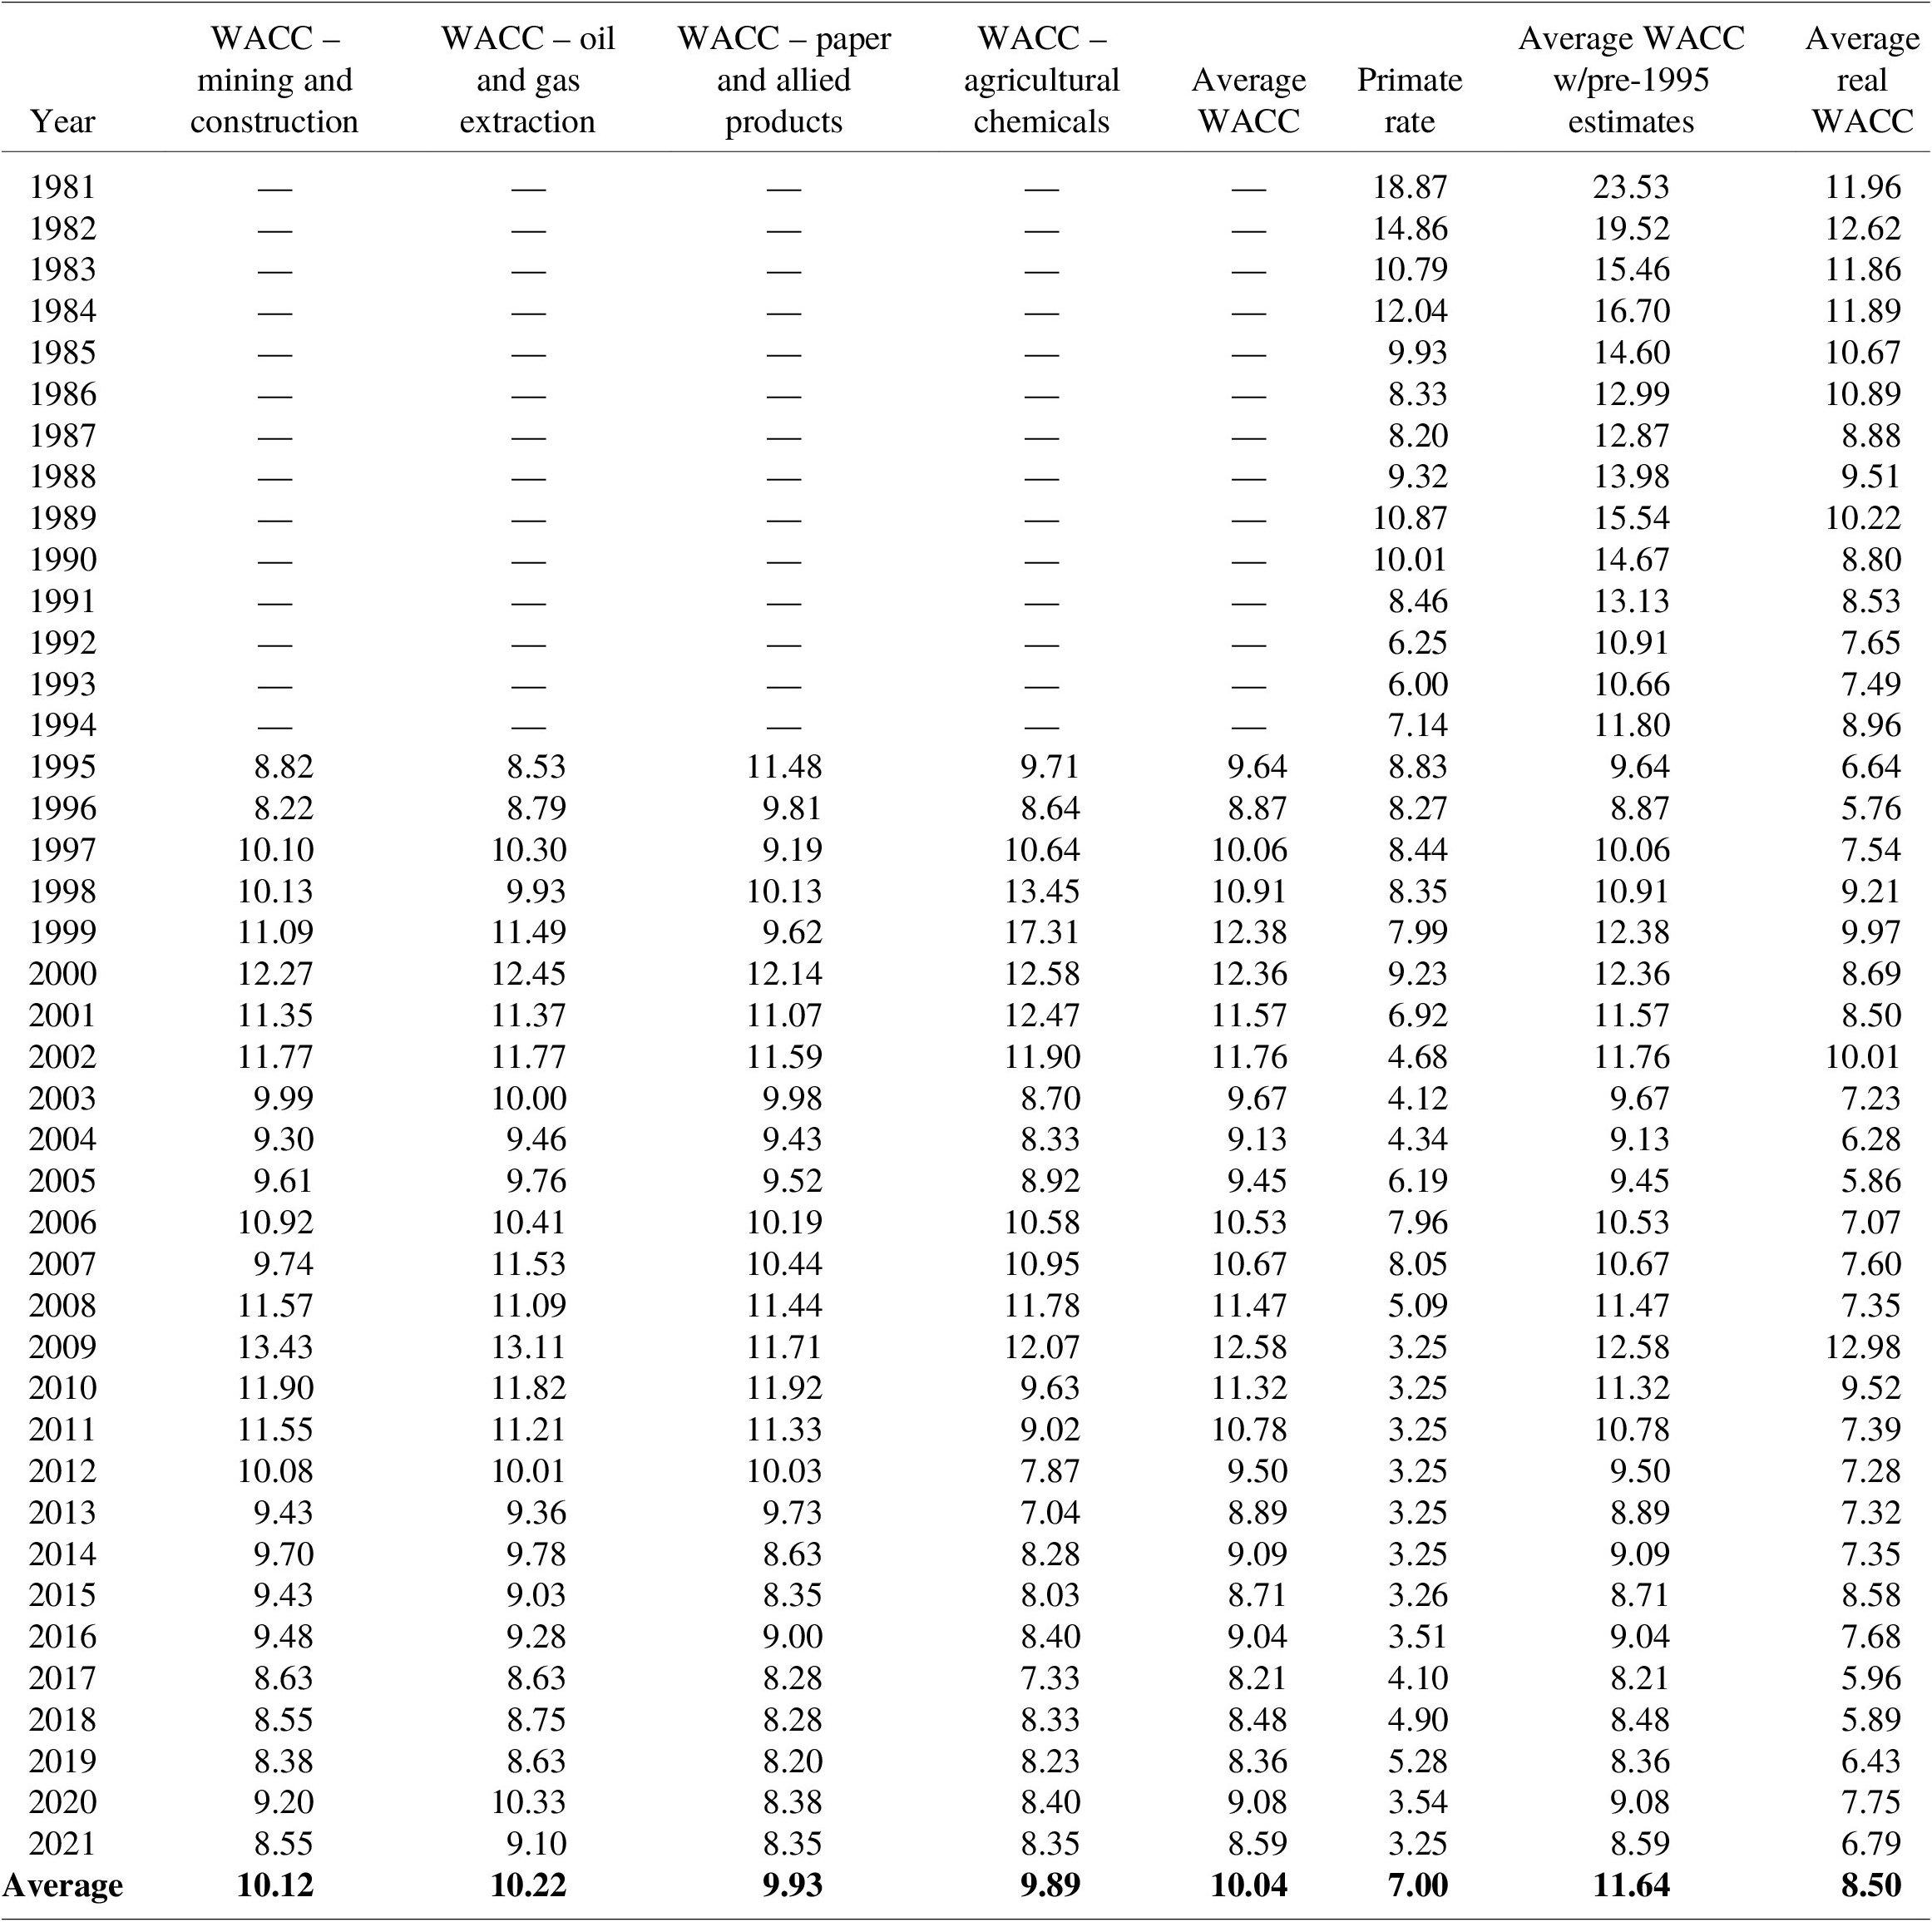
Sources: This table includes WACC data from Ibbotson Cost of Capital yearbooks (Ibbotson Associates, 1995–2006; Morningstar, Incorporated, 2007–2013) for 1995–2013 and from Duff & Phelps (2021) for 2014–2021. All prime rate data were collected from the Federal Reserve Bank of St. Louis (FRED; Federal Reserve Bank of St. Louis, 2021).


 Open access