A 53-year-old man who underwent recent mitral valve repair and tricuspid valve annuloplasty 3 months prior presented with transient mild left-sided facial droop and dysarthria. He had a National Institute of Health Stroke Scale (NIHSS) of 1. Initial unenhanced CT and CT angiogram (Figure 1A and B) demonstrated acute infarct in the right insula secondary to a filling defect in right distal middle cerebral artery (MCA). MRI vessel wall imaging was performed 12 h after initial CT to clarify the etiology of this filling defect and was concluded an embolus as there was no evidence of wall thickening or enhancement. Limited brain sequences (Figures 1C–H) performed concurrently demonstrated high fluid-attenuated inversion recovery (FLAIR) signal in the right insula, compatible with the infarct. There was additionally unexpected sulcal T1 and FLAIR hyperintensity overlying right frontal convexity and an area of contrast blush in the right occipital lobe without other corresponding abnormality allowing for lack of diffusion weighted imaging (DWI) and blood-sensitive sequences on this first MRI. While awaiting cardiac investigations, the patient developed visual field defect, prompting the second MRI brain with contrast (Figure 2). This MRI demonstrated a parenchymal hematoma in the right occipital lobe, with a focal area of enhancement centrally. The sulcal T1 and FLAIR hyperintensity were confirmed as blood products on the susceptibility weighted imaging (SWI) sequence, and there was restricted diffusion in the right insula, confirming the right MCA infarct. A subsequent transesophageal echocardiography demonstrated vegetation in the heart valves and he was commenced on moxifloxacin and doxycycline for 6 weeks. A digital subtraction angiography (DSA) was performed to exclude a mycotic aneurysm causing the parenchymal hematoma with this knowledge and was negative. He remained well without progression or development of new focal neurological deficit and was discharged with an NIHSS score of 0, 12 days after initial presentation.

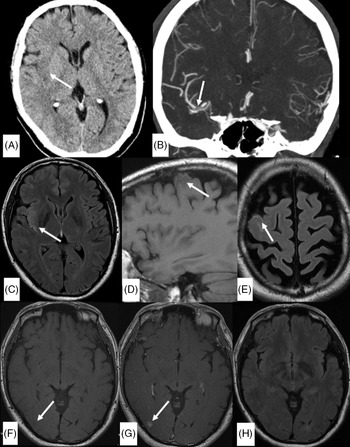
Figure 1: Unenhanced axial CT head (A), coronal CT angiogram in the arterial phase (B,) and initial limited MRI examination (C–H). A: Right insular hypoattenuation (arrow in A) secondary to an occlusion in the M1 segment of right MCA (arrow in B). (C) Axial FLAIR sequence demonstrate high signal in the right insula (arrow) corresponding to hypoattenuation on unenhanced CT. (D and E) Pre-gadolinium sagittal T1 FLAIR sequence and axial FLAIR sequence demonstrate intermediate T1-weighted signal and high FLAIR signal in the sulci overlying the right frontal convexity (arrows). (F and G) Pre- and post-gadolinium T1 FLAIR sequence (for vessel wall imaging) shows unexpected contrast blush in the right occipital lobe (arrow in G) in an area of probable T1 hypointensity (arrow in F). (H) Axial FLAIR sequence at the level of the right occipital lobe did not show corresponding abnormality. *A DWI or SWI sequence was not routinely performed with the vessel wall imaging protocol in our institution.

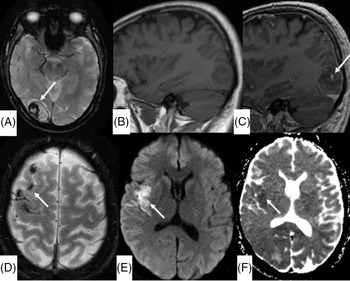
Figure 2: (A) Axial SWI at the level of the right occipital lobe shows interval development of a parenchymal hematoma. (B and C) Pre- and post-gadolinium sagittal T1-weighted image shows focal contrast enhancement in the right occipital hematoma, denoting the “conventional” spot sign. (D) Axial SWI demonstrates hemosiderin staining corresponding to the intermediate T1-weighted and high FLAIR signal seen on baseline imaging, confirming blood products in the subarachnoid space. Axial DWI sequence (E) and apparent diffusion coefficient map (F) demonstrate restricted diffusion in the right insula, confirming an embolic infarct.
The “spot” sign was first described on CT angiography by Wada et al. as a focus of contrast extravasation within a hematoma, shown to be predictor of hematoma expansion. Reference Wada, Aviv and Fox1 Multiple case reports and studies have assessed and reported on the analogous MRI spot sign in intracerebral and subdural hematoma. Reference Cutsforth-Gregory, Black, Hoffman, Datar and Wijdicks2–Reference Allam, Sweis and Sander4 Our case is unique in that the “spot” sign was demonstrated incidentally on an MRI performed for a different indication prior to any symptoms or signal abnormality in the right occipital lobe. Although we cannot definitely exclude an infarct in the right occipital lobe without a DWI sequence on the initial MRI, there is breakdown of the blood–brain barrier leading to parenchymal hematoma in any case of hemorrhage, whether spontaneous hemorrhage, hemorrhagic transformation of an infarct or rupture of a mycotic aneurysm. DSA in this case showed no aneurysms. Further, there is a differential diagnosis to the contrast blush, such as leptomeningeal process in a patient with endocarditis. We posit that the contrast blush demonstrated on initial limited MRI heralded the parenchymal hematoma.
This has implications on clinical practice because, as with other hyperacute stroke imaging features including the dense MCA sign Reference Tomsick, Brott and Barsan5 and non-demonstration of restricted diffusion in hyperacute stroke, Reference Lefkowitz, LaBenz, Nudo, Steg and Bertoni6 the differential diagnosis of imminent parenchymal hemorrhage should be included when an unexplained contrast blush on MRI is demonstrated.
Disclosures
The authors have no conflicts of interest to declare.
Statement of Authorship
SYF drafted, edited the manuscript, and prepared all figures. PN revised and edited the manuscript. TK conceived the topic for this manuscript and revised the manuscript.