


Social inequalities in health refer to unfair and unnecessary disparities that systematically burden populations rendered vulnerable by social or political structures(Reference Krieger1). Malnutrition is a key contributor to this type of inequality. Undernutrition, for instance, is both a cause and a consequence of poverty(Reference Heltberg2), and obesity is related to factors such as family income or urban/rural area of residence(Reference Braveman3). Therefore, to acknowledge and ultimately decrease social inequalities in health, it is important to understand how various factors, including malnutrition, contribute to these disparities.
Malnutrition refers to all forms of nutrition disorders caused by a complex array of factors, including dietary inadequacy (deficiencies, excesses or imbalances in energy, protein and micronutrients), and consists of both undernutrition and excess weight(4). Undernutrition, from conception to the first 2 years of life, has adverse effects on growth, mental and capacity development and intellectual performance(Reference Victora, Adair and Fall5). Anaemia is partly linked to nutritional deficiencies, but also other causes such as infectious diseases and genetic disorders – the relative importance of each of these factors depending on the context(4,Reference Balarajan, Ramakrishnan and Ozaltin6) . It has serious consequences on the motor and intellectual development of children, and, if not corrected before 2 years of age, this damage is irreversible. In women of reproductive age, anaemia is associated with increased maternal and perinatal mortality, increased prematurity and low-birth-weight products(Reference Levy, Fraser and Katz7). On the other hand, overweight and obesity in childhood can have a significant impact on physical and psychological health. Obese and overweight children are likely to stay obese into adulthood and more likely to develop diabetes and cardiovascular diseases at a younger age, and are at a higher risk of breast, colon, prostate, endometrium, kidney and gallbladder cancer(Reference Sahoo, Sahoo and Choudhury8).
In Mexico, excess weight has become a public health concern; in 2012, ~10 % of preschool-aged children, ~35 % of school-aged children and adolescents and ~70 % of adults were overweight (including obesity)(Reference Hernández-Cordero, Cuevas-Nasu and Morán-Ruán9,Reference Barquera, Campos-Nonato and Hernández-Barrera10) . Although undernutrition has declined, it still affects an important part of the population. Around 1·5 million Mexican children <5 years (13·6 %) suffer from stunting (low height-for-age)(Reference Rivera-Dommarco, Cuevas-Nasu and González de Cosío11). In 2012, the prevalence of anaemia among children <5 years was 23·3 %(Reference de la Cruz-Góngora, Villalpando and Mundo-Rosas12), and among non-pregnant women aged 12–49 years, it was 11·6 %(Reference Shamah-Levy, Villalpando and Mundo-Rosas13).
Previous studies looking at malnutrition differences by socioeconomic or ethnic indicators in Mexico have focused on only condition (either overweight/obesity, stunting or anaemia); on only one specific age group; and the majority on only one socioeconomic or ethnicity indicator(Reference Hernández-Cordero, Cuevas-Nasu and Morán-Ruán9–Reference Quezada and Lozada-tequeanes14). Therefore, to better understand social inequalities in all forms of malnutrition, our aim was to estimate parallel to each other and do a comparative analysis of the prevalences of both undernutrition (wasting/underweight, stunting/short stature and anaemia) and excess weight (overweight and obesity); in different age groups (children <5 years, women 11–19 years, and women 20–49 years); and by several socioeconomic and ethnicity indicators (wealth based on household characteristics and goods, education level and indigenous status). This study is part of a supplemental issue with the participation of several Latin American countries. It was coordinated by young researchers who participated in the VII Latin American Workshop on Leadership in Nutrition (Programa LILANUT) organised by the Latin American Society of Nutrition (SLAN)(Reference Barreto, Batis and Bortolini15). The goal was to perform analyses that were as comparable as possible across countries. Decisions about the studied population, malnutrition and socioeconomic and ethnic indicators used, and participating countries. Besides the common analyses, in this study we present malnutrition prevalence by urban/rural area, estimate adjusted prevalence ratios (PR) to understand the independent effect of each factor, and examine if the associations were different in rural v. urban areas.
Methods
Participants
The Mexican National Health and Nutrition Survey 2012 (ENSANUT, its acronym in Spanish) is a cross-sectional, multi-stage probabilistic survey representative of the national, regional and rural/urban population(Reference Romero-Martínez, Shamah-Levy and Franco-Núñez16). It was carried out between October 2011 and May 2012. The general aim of the survey was to quantify the distribution of health and nutrition status among the Mexican population and monitor trends across time. We included children <5 years old (n 10 658) and non-pregnant women of reproductive age (11–19 years: n 8044; 20–49 years: n 14 542).
Malnutrition indicators
Trained personnel measured weight and height (or length among <2-year-olds) using standardised protocols and equipment. As for indicators of malnutrition, we included overweight and obesity (excess weight), wasting/underweight, stunting/short stature and anaemia (undernutrition). We estimated BMI as weight (kg) divided by height (m) squared (kg/m2). Definitions were based on the WHO (see Tables’ footnote for specific cut-points in the Results section)(17–Reference de Onis, Onyango and Borghi19). The definition of overweight includes obesity (e.g., overweight is defined as BMI ≥ 25·0 kg/m2, not BMI ≥ 25 and <30). We excluded values with height-for-age z-score <–6 or >6, weight-for-height z-score <–5 or >5, BMI-for-age z-score <–5 or >5, and – among women 20–49 years – BMI <10 or >58 kg/m2.
Hb concentration was measured in capillary blood using a portable photometer (HemoCue). Anaemia was defined as Hb <110 g/l for children <5 years and <120 l for women 11–49 years. Hb was adjusted to altitude with the Cohen and Haas equation(Reference Cohen and Haas20). We excluded Hb values that were <40 or >185 g/l.
Socioeconomic characteristics and ethnicity
We included wealth, education level, urban/rural residence area and ethnicity (indigenous/non-indigenous) as socioeconomic and ethnic indicators. Wealth categories were based on a well-being condition index previously estimated with principal component analysis, which included household characteristics and assets such as household’s material on the floor, walls and roof, availability of public sanitary sewer system, public water network connected to household, electricity, motor vehicle, television, computer and refrigerator. The first component was used for the index; it explained 40·5 % of the total variation(Reference Shamah-Levy, Mundo-Rosas and Rivera-Dommarco21). Households were classified into tertiles as low, medium and high wealth. We classified education level as low (0–6 years of schooling: primary school or less), medium (7–12 years of schooling: secondary to high school) and high (>12 years of schooling: more than high school). For children and women <20 years, we used mother’s education level; and for women 20–49 years, we used their own education level. We defined rural areas according to the Mexican Institute of Statistics and Geography (INEGI, its acronym in Spanish) as areas with <2500 inhabitants(22). A household was classified, following ENSANUT’s methodology, as indigenous if at least one woman >12 years spoke an indigenous language(Reference Rivera-Dommarco, Cuevas-Nasu and González de Cosío11). This definition is used by the Mexican National Commission for the Development of Indigenous Populations considering that the identification and transmission of culture occurs within a household, and that decisions, resources, territory and social networks are shared within a household(23).
Statistical analysis
We calculated means or proportions of age, sex (only among children <5 years), education level (only among women 20–49 years), ethnicity and household characteristics and goods in the whole sample and by wealth tertiles.
For each malnutrition indicator, we estimated the prevalence by age group in the whole sample and by wealth tertiles, education level categories, ethnicity and urban/rural area. We tested the differences in the prevalence between each pair of subgroups using the test for linear combinations (lincom command). To quantify the association between socioeconomic and ethnic indicators and the prevalence of overweight or obesity, stunting/short stature and anaemia, we performed generalised linear models with a binomial family and log link to estimate PR. We estimated crude PR and adjusted PR by other socioeconomic indicators plus continuous age. We estimated PR instead of prevalence OR because, although both measures have issues(Reference Pearce24), PR was more interpretable as it related to the prevalence presented in the initial analyses. To understand if the later analyses differed by urban/rural area, we repeated the same multiple models but adding an interaction term between each sociodemographic and ethnic indicator and urban/rural area (we ran separate models for each sociodemographic variable). We present the predicted prevalence when the interaction term had a P-value <0·10. We performed a ‘chunk test’ to jointly test the interaction terms in the case of sociodemographic variables with dummies. As a sensitivity analysis, we estimated the adjusted predicted prevalences of malnutrition by wealth quintiles and deciles to find if there were different patterns or inflection points that we were missing by conducting the analysis by tertiles (see online supplementary material, Supplemental Fig. 1). We conducted these analyses in STATA 14 (StataCorp) using the survey prefix command (svy) to account for the complex design of ENSANUT 2012.
Results
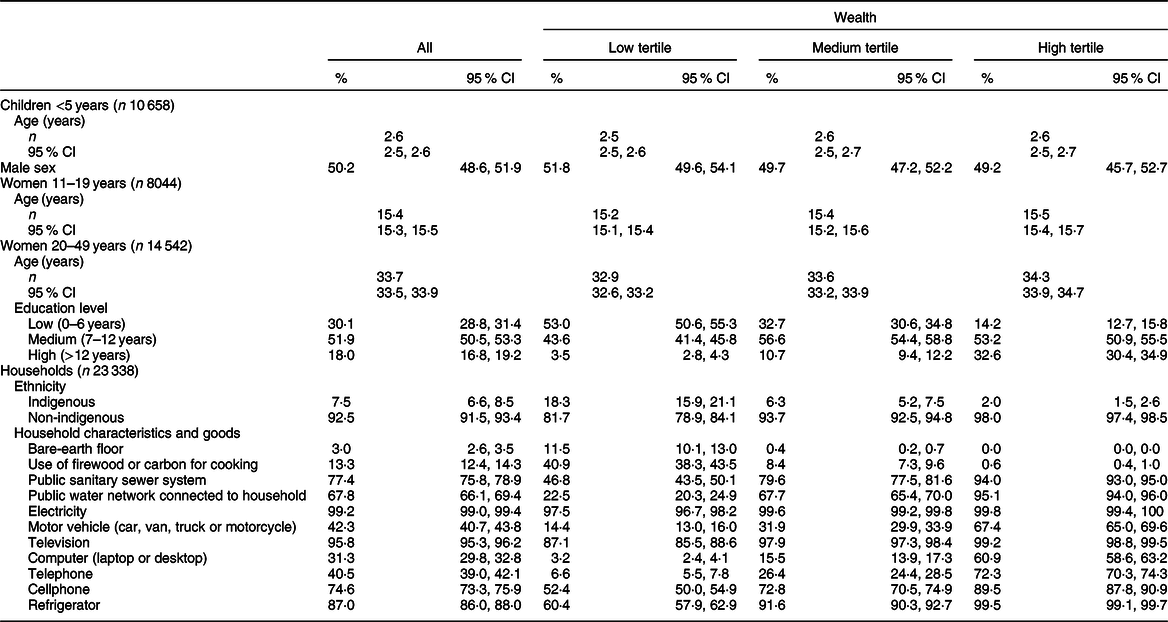
Participants’ characteristics (age, sex and education level), as well as ethnicity and household characteristics and goods by wealth tertiles in ENSANUT 2012 are shown in Table 1. We found that some of the larger differences in household characteristics and goods between low and high wealth were public water network connected to household (22·5 % in low wealth v. 95·1 % in high wealth), motor vehicle (14·4 v. 67·4 %), computer (3·2 v. 60·9 %) and telephone (6·6 v. 72·3 %) ownership.
Table 1 Sample characteristics by tertiles of wealth in Mexico – Mexican National Health and Nutrition Survey (ENSANUT 2012)
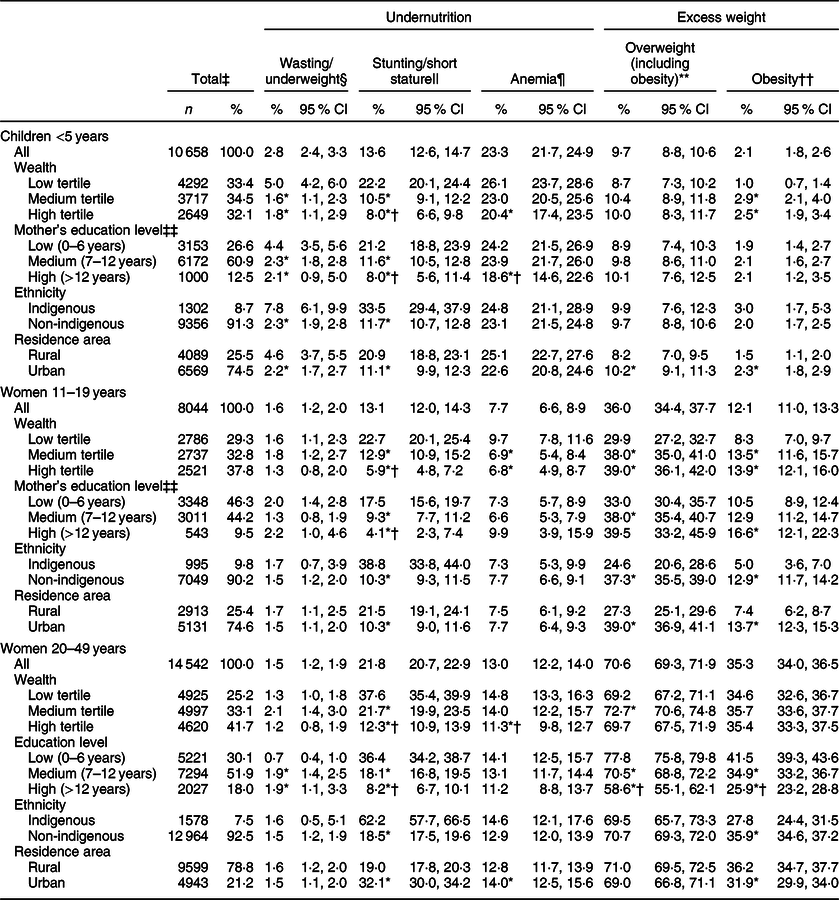
The crude prevalence of malnutrition by socioeconomic indicators among age groups in Mexico is presented in Table 2. In children <5 years, the prevalence of undernutrition (wasting, stunting and anaemia) decreased with increasing wealth and education, while the prevalence of wasting and stunting was higher among indigenous and rural children. Additionally, the prevalence of obesity increased slightly with increasing wealth (1·0, 2·9 and 2·5 % for low, medium and high wealth, respectively) and was higher in urban than rural residents (2·3 v. 1·5 %). In women 11–19 years, the prevalence of stunting was higher among all socially disadvantaged groups (low wealth tertile, mothers with low education level, indigenous and rural areas) compared with their counterparts. The prevalence of anaemia decreased with increasing wealth, and there were no differences in the prevalence of underweight. The prevalence of overweight and obesity increased with increasing wealth (high v. low wealth: 39·0 v. 29·9 % for overweight; 13·9 v. 8·3 % for obesity), education and among non-indigenous and urban women. In women 20–49 years, short stature was higher among all socially disadvantaged groups; anaemia was higher among the low wealth group and in urban population, whereas underweight was higher among women with medium and high education level. The results for excess weight varied by socioeconomic and ethnicity indicators. For wealth, the prevalence of overweight was slightly higher among medium wealth than low wealth tertile (72·7 v. 69·2 %). However, by education level, the prevalence of overweight and obesity was much lower for women with a higher education level (e.g., obesity prevalence was 41·5 % for low, 34·9 % for medium and 25·9 % for high education level). Whereas obesity was higher among non-indigenous and rural populations.
Table 2 Malnutrition prevalence by wealth, education level, ethnicity and residence area by age groups in Mexico – Mexican National Health and Nutrition Survey (ENSANUT 2012)
‡ Weighted %.
§ Wasting: weight-for-height z-score <–2 for children <5 years; underweight: BMI-for-age z-score <–2 for women 11–19 years; and BMI < 18·5 for women 20–49 years.
|| Stunting: height-for-age <–2 for children <5 years; height-for-age z-score <–2 for women 11–19 years; and short stature: height <1·49 m for women 20–49 years.
¶ Anemia: Hb adjusted using the Cohen and Haas equation <110 g/l for children <5 years; and <120 g/l for women 11–49 years. The sample size for anaemia was 7366 for children <5 years, 6706 for women 11–19 years and 12 073 among women 20–49 years.
** Overweight (including obesity): BMI-for-age z-score >2 for children <5 years; BMI-for-age z-score >1 for adolescents 15–19 years; and BMI ≥ 25·0 kg/m2 for women 20–49 years.
†† Obesity: BMI-for-age z-score >3 for children <5 years; BMI-for-age z-score >2 for women 11–19 years; and BMI ≥ 30·0 for women 20–49 years.
‡‡ The sample size by mother’s education level was 10 325 for children <5 years and 6902 for women 11–19 years.
* P < 0·05 v. low tertile/low education/indigenous.
† P < 0·05 v. medium tertile/medium education.
In Table 3 we present the crude and adjusted prevalence of wasting/underweight, stunting/short stature, anaemia and overweight. As can be seen, adjusted prevalences were weaker than crude prevalences, but adjusted prevalences remained statistically significant in most cases. Moreover, we found that, in general, the associations were much stronger for stunting/short stature and anaemia than for overweight.
Table 3 Prevalence ratio of malnutrition associated with wealth, education level, ethnicity and residence area by age groups in Mexico – Mexican National Health and Nutrition Survey (ENSANUT 2012)
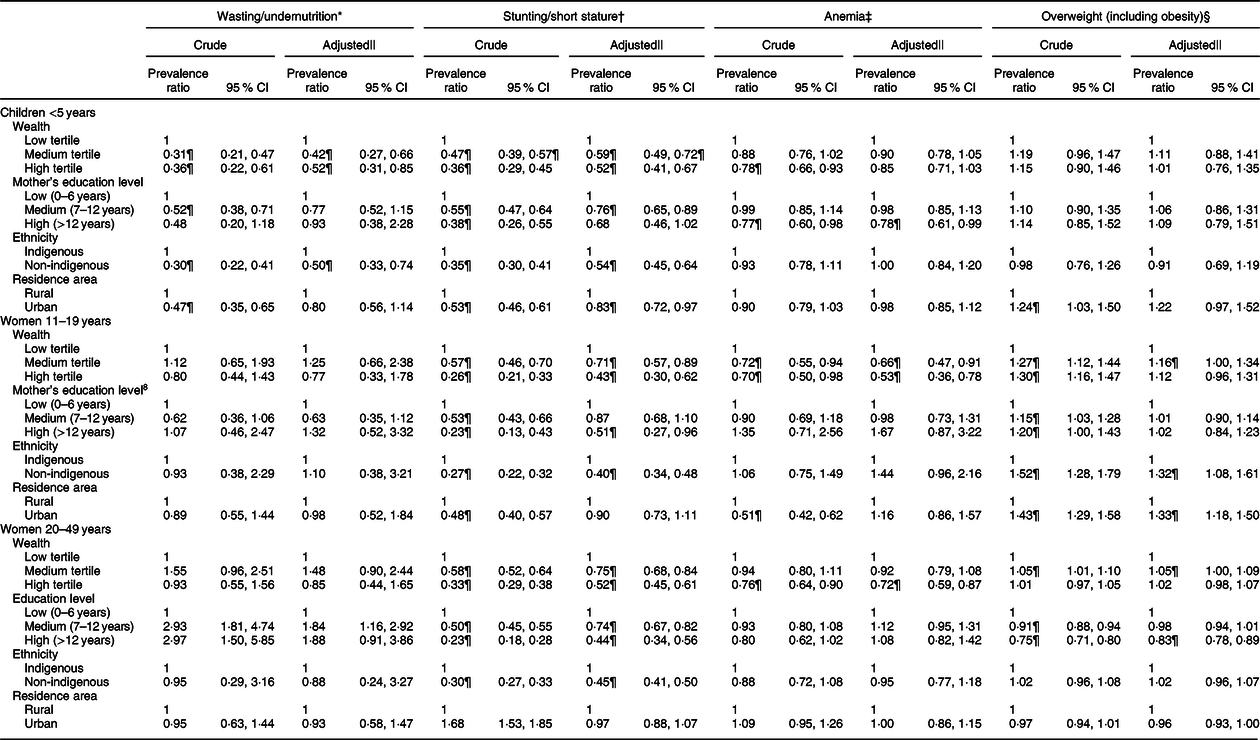
* Wasting: weight-for-height z-score <–2 for children <5 years; underweight: BMI-for-age z-score <–2 for women 11–19 years; and BMI < 18·5 for women 20–49 years.
† Stunting: height-for-age <–2 for children <5 years; height-for-age z-score <–2 for women 11–19 years; and short stature: height <1·49 m for women 20–49 years.
‡ Anaemia: Hb adjusted using the Cohen and Haas equation <110 g/l for children <5 years, and <120 g/l for women 11–49 years.
§ Overweight including obesity: BMI-for-age z-score >2 for children <5 years; BMI-for-age z-score >1 for adolescents 15–19 years; and BMI ≥ 25·0 kg/m2 for women 20–49 years.
|| Adjusted by all other variables in the table and age.
¶ P < 0·05.
In Fig. 1, we present adjusted prevalences by socioeconomic and ethnic indicators in rural and urban areas. We present only the cases in which the interaction between urban/rural areas and the socioeconomic or ethnic indicator was statistically significant (P < 0·10). For overweight among children and women 11–19 years in rural areas, those with high wealth or education had a higher prevalence than those with low wealth or education, whereas in urban areas, there were no differences. Among women 20–49 years, non-indigenous showed a higher prevalence in urban areas, and there were no differences in rural areas. For stunting, the inverse association with education was stronger and statistically significant in rural areas among women 11–19 years; and for anaemia, the inverse association with wealth was stronger in urban areas among women 20–49 years. In online supplementary material, Supplemental Fig. 1, we present the adjusted prevalences of malnutrition by wealth tertiles, quintiles and deciles. The shape of the patterns found between malnutrition prevalence as wealth increased remained similar regardless of the level of categorisation of wealth, but the gaps between the lowest and highest categories of wealth increased and are more evident when looking at deciles.
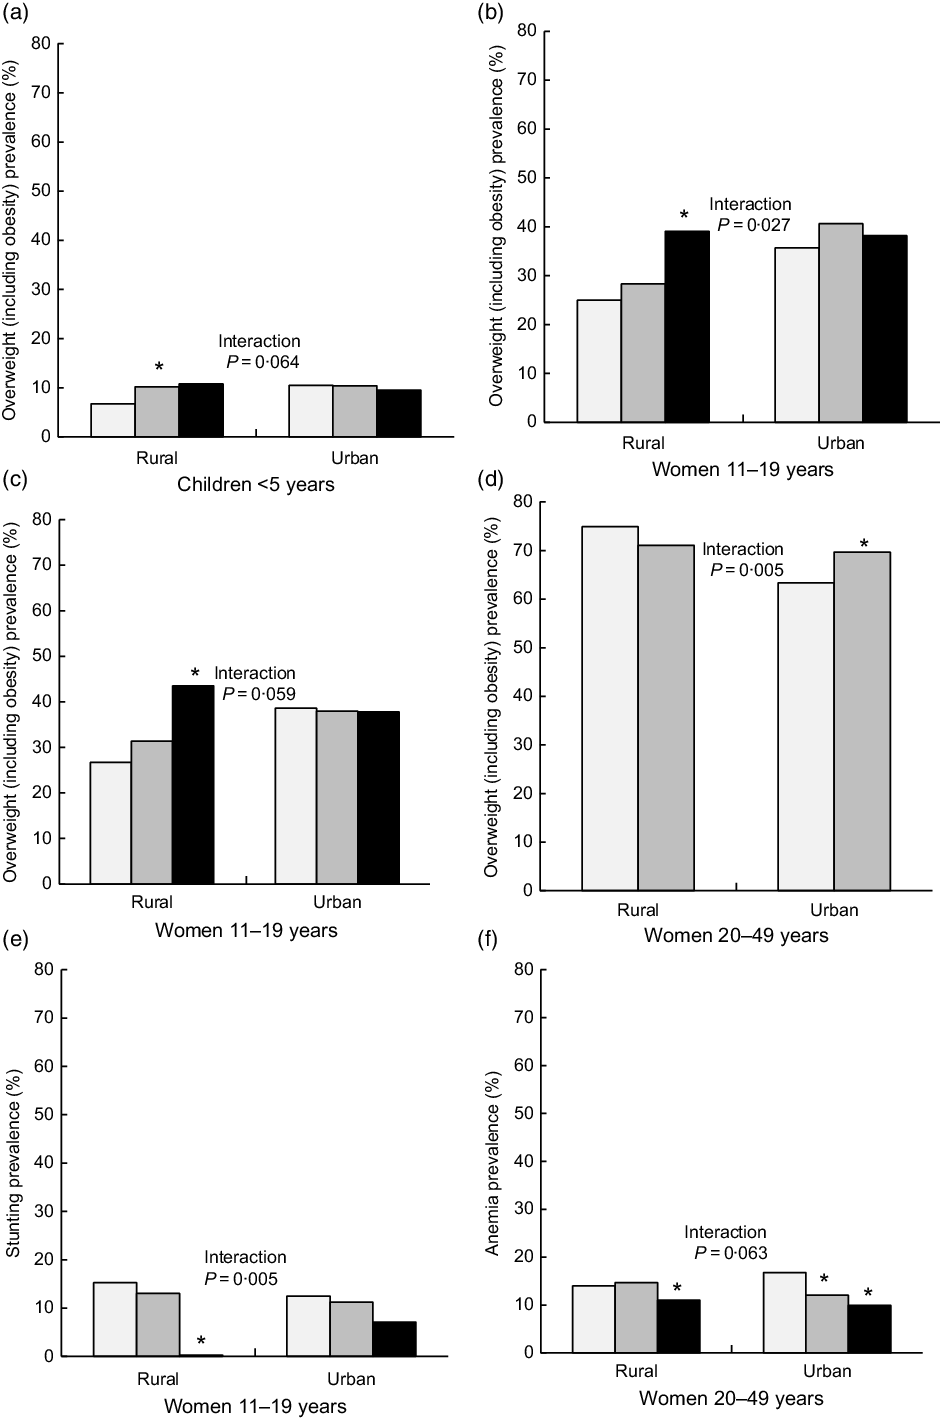
Fig. 1 Predicted prevalence of malnutrition by wealth, education and ethnicity across rural and urban populations. Predictions based on a model that included wealth, education, ethnicity and an interaction term between each of these and urban/rural areas (one model per interaction term). *P < 0·05 v. reference category (low wealth, low mother’s education or indigenous). Results are only presented for models in which the interaction term had a P < 0·10. Data are from the Mexican National Health and Nutrition Survey 2012 (n 33 244). (a, b, f) ![]() , low wealth;
, low wealth; ![]() , medium wealth;
, medium wealth; ![]() , high wealth; (c, e)
, high wealth; (c, e) ![]() , low mother’s education;
, low mother’s education; ![]() , medium mother’s education;
, medium mother’s education; ![]() , high mother’s education; (d)
, high mother’s education; (d) ![]() , indigenous;
, indigenous; ![]() , non-indigenous
, non-indigenous
Discussion
In this analysis of a representative sample of the Mexican population, we found important differences in the prevalence of malnutrition by wealth, education, indigenous ethnicity or urban/rural areas. In general, the socially disadvantaged groups (low wealth tertile, low education, indigenous and rural areas) had a higher prevalence of undernutrition, whereas the differences for excess weight were smaller and heterogeneous by age group. For overweight, among children <5 years, the prevalence was similar across groups; among women 11–19 years, the socially disadvantaged groups had a lower prevalence, and among women 20–49 years, those with low education had a higher prevalence. The strength of associations for these findings was attenuated once we adjusted for all other socioeconomic and ethnic variables, but they remained statistically significant, meaning that each factor had an effect independent of the others. Furthermore, inequality patterns differed by rural and urban populations, among children and adolescents; undernutrition inequalities were larger in the rural population, whereas for overweight in rural population, the socially disadvantaged groups had a lower prevalence, and in urban population, the prevalence was equal.
Regarding our findings for undernutrition, the greatest magnitude in differences between groups was for stunting, caused by a poor diet, insufficient food availability, recurrent infections, limited access to education and health services, which are factors strongly related to poverty(Reference Heltberg2,Reference Peña and Bacallao25) . Moreover, these gaps can persist during generations. The history of undernutrition in parents, especially in the mother, can be determinant since undernutrition during gestation can have adverse effects on the growth and mental development of the child(Reference Martorell and Zongrone26). This pattern of stunting being more prevalent among the poor is consistently reported in more than forty low- and middle-income countries(Reference Van de Poel, Hosseinpoor and Speybroeck27,Reference Ergo, Gwatkin and Shekar28) . Strong and tailored social programmes are needed to alleviate this situation. With anaemia, the PR were weaker compared with those observed with stunting, and only statistically significant in the adjusted models for education (among children) and for wealth (among adolescent and adult women). This weaker association with sociodemographic variables observed for anaemia might be related to multiple causes, particularly those that are not modifiable, such as genetic Hb disorders(Reference Balarajan, Ramakrishnan and Ozaltin6).
Contrary to undernutrition, we found that for excess weight, the differences across wealth, education, urban/rural areas and ethnicity groups were small. In developed countries, obesity is concentrated among the most vulnerable populations, whereas in developing countries, the contrary is the case because those with lower income live in an environment of food scarcity and high energy expenditure(Reference Monteiro, Conde and Lu29). According to our results, Mexico is transitioning from one stage to the other. This transition might occur possibly because as the country develops, the obesogenic environment becomes the default in the whole population, including the most vulnerable, and then only individuals with higher income have the resources or motivation to escape that default(Reference Rivera, Barquera and González-Cossío30). Another possibility is that the environment itself switches and becomes more obesogenic among the underserved populations (e.g., so-called food-deserts)(Reference Walker, Keane and Burke31). Furthermore, within Mexico, the transition might be occurring at different rates. Children and adolescents in rural areas still behave as in low-income countries (e.g., those with higher education and wealth had a higher prevalence); in urban areas, they are undergoing the transition (e.g., there were no differences); and among adult women, the trend is following the pattern of high-income countries (e.g., privileged populations tended to have a lower prevalence). The understanding of how this is influenced by the interplay between environmental and individual factors warrants further study. Moreover, among adult women, the different pattern observed for education v. wealth in our findings is noteworthy. For wealth, there was an inverted U-shaped pattern, in which women in both extremes of the wealth index had a lower prevalence compared with the mid-wealth. When looking at this association by deciles of wealth, we found that this trend accentuated; women in the lowest decile had a prevalence of 62 %; from deciles 2nd to 9th, it was 71–75 %; and again in the last decile, it was 65 %. It is interesting that only the very poor and the very rich had a remarkably lower prevalence. In the case of education, women with higher education had less overweight than those with lower education, even after adjusting for wealth and other socioeconomic indicators. We hypothesise that education might be related to more nutrition knowledge, motivation or awareness, better employment or higher social class. Interestingly, this pattern of inverse association between education and obesity in adult women has been consistently reported in Mexico since 1988(Reference Perez Ferrer, Mcmunn and Rivera Dommarco32). Moreover, this pattern is different in men, in whom obesity is positively associated with the household’s wealth and not associated with education(Reference Quezada and Lozada-tequeanes14).
In Mexico, over 12 million people are indigenous; they represent 10 % of the Mexican population. They live in the most remote areas of the country and are the most vulnerable to changes in the economic, social, political or ecologic environment(23). According to our analysis, stunting was at least three times more prevalent among the indigenous groups compared with the non-indigenous. Yet, the prevalence of overweight was only lower among the indigenous women 11–20 years, but for other age groups, there was no difference. These results are similar to other Latin American countries. In Guatemala, Bolivia, Peru, Brazil and Ecuador, stunting is two to three times higher among indigenous v. non-indigenous children(Reference Ramirez-Zea, Kroker-Lobos and Close-Fernandez33–Reference Horta, Santos and Welch35). Regarding overweight, in high-income countries such as Australia, Canada and USA, indigenous populations have a higher prevalence compared with non-indigenous(Reference Wake, Hardy and Canterford36,Reference Schell and Gallo37) . Whereas in Latin America, as in our results, the pattern is inconsistent. Among children in Bolivia and Guatemala, the prevalence of overweight is slightly higher among indigenous; in Peru it is lower; whereas in Ecuador, it is similar compared with non-indigenous children(Reference Lutter and Chaparro34). This scenario is worrisome; it means that the indigenous population is dealing with the double of malnutrition. Their undernutrition problems have not been resolved, and they now face an obesity prevalence comparable to that of the rest of the population. It is important to understand if the environment surrounding the indigenous population is obesogenic as that of other groups, or if the indigenous population is more vulnerable to even lesser obesogenic environments.
Mexico has a long history of implementing programmes and policies aimed at improving the nutritional status of vulnerable groups(Reference Barquera, Rivera-Dommarco and Gasca-Garcia38). Chronic undernutrition or stunting has decreased by 50 % from 1988 to 2012, and those with the lowest wealth had the greatest reductions(Reference Rivera-Dommarco, Cuevas-Nasu and González de Cosío11). Yet, we found that high prevalences and inequities remain for undernutrition. One possible explanation is that programmes such as ‘Prospera’ (formerly Progresa and Oportunidades) have led to an increase in the intake of supplements, but they have not achieved improvements in overall dietary patterns. Moreover, given the high prevalence of overweight and obesity in the socially disadvantaged groups that we reported, it is important that nutritional programmes targeting vulnerable populations include obesity prevention components.
Since 2014, the Mexican Government implemented a national strategy to prevent overweight, obesity and diabetes(39). Among several components, the strategy included taxes to sugar-sweetened beverages and non-basic energy-dense foods. The taxes had a differential effect by wealth in urban areas; households with lower wealth reduced the purchases of taxed products the most(Reference Colchero, Popkin and Rivera40–Reference Cochero, Rivera-Dommarco and Popkin42). But the prices of taxed products did not increase substantially in rural areas,(Reference Colchero, Zavala and Batis43) and hence this policy had a lower effect in rural areas(Reference Hernández-F, Batis and Rivera44). We found that the prevalence of overweight and obesity is still larger in urban areas compared with rural areas among children and adolescent women, but among adult women, there was no difference in the prevalence, or this was higher among rural areas for obesity. It is important to analyse if national policies to prevent obesity are working across socioeconomic and ethnic groups, or if changes on these are warranted. For example, the government cannot control the industry pricing strategy through taxes, but the tax revenue could be used for other programmes to prevent obesity in rural areas.
Strengths of this analysis include the large, nationally representative sample, the comprehensive malnutrition assessment with excess weight and undernutrition indicators, the several socioeconomic and ethnicity indicators, and the different age groups included. Moreover, our analysis was comparable to that of other Latin American countries taking part in this supplemental issue. One of the main limitations is the cross-sectional nature of the survey, which did not enable us to infer causality among socioeconomic and ethnicity indicators and malnutrition. Additionally, we did not analyse men 11–49 years, subjects >49 years old from both sexes, or abdominal adiposity.
In conclusion, these results urge the need to improve the programmes aimed at decreasing undernutrition in the socially disadvantaged populations, and to include obesity prevention components among these. Moreover, how national obesity prevention policies are working across the different socioeconomic strata should be carefully monitored and correction undertaken in case these are leaving a vulnerable stratum out.
Acknowledgements
Acknowledgements: The authors thank the Latin American Nutrition Leadership Program (Programa LILANUT) for coordinating this supplement, and the National Institute of Public Health for conducting the National Health and Nutrition Survey (ENSANUT) 2012 and for supporting the authors’ work on this article. Financial support: DSM Nutritional Products provided funds for the publication of this manuscript. They had no role in the design, analysis or writing of this article. Conflict of interest: There are no conflicts of interest. Authorship: C.B. and J.R. designed the study; C.B. analysed the data; C.B., B.I.E.S. and E.D.G. wrote the article; J.R. made comments to the article. Ethics of human subject participation: This study was conducted according to the guidelines laid down in the Declaration of Helsinki, and all procedures involving study participants were approved by the Ethics Committee of the Mexican National Institute of Public Health. Informed consent was obtained from each subject or subject’s parent/guardian.
Supplementary material
For supplementary material accompanying this paper visit https://doi.org/10.1017/S1368980019004725.


