

I. Introduction
For the past four decades, technological progress in semiconductors and wireless technology has been driven by specialized firms that develop technologies and license them to downstream chip manufacturers and implementers in exchange for royalties. Specialization and trade in technology along the vertical chain has been one of the hallmarks of fast technological progress, and in wireless communications this pattern has repeated itself across multiple rounds of change in standards. Indeed, 5G is being developed in significant part by the same specialized technology firms that previously helped to develop 3G and 4G. As with previous wireless generations, standardization, patents, and licensing support vertical specialization.
As in all markets, 5G market demand determines the amount of economic surplus produced. Over the past 20 years, technology developers and implementers have battled over the surplus and have sought to leverage policy, regulation, legislation, jurisprudence, popular sentiment, and other dynamics to capture the largest possible share for their stakeholders. Their duty to capture maximum surplus for their stakeholders discourages concern for unintended or unexpected consequences for the market as a whole and for other critical institutions in society.
Meanwhile, however, the battle over surplus has taken place in a market where technology developers compete. We have shown in previous work (which we discuss later) that an equilibrium emerged in wireless 3G and 4G licensing. In this equilibrium, innovators license standard-essential patents (SEPs) and implementers (chiefly, smartphone Original Equipment Manufacturers (OEMs)) pay royalties under a licensing regime in conformity with “fair, reasonable and nondiscriminatory” (FRAND) principles. We estimated that for more than 10 years the cumulative royalty yield paid by the entire phone manufacturing value chain hovered between a market average of 3% and 3.5% of the average selling price of a phone, which seems to be the agreed market price for the technologies that make phones work. We have also shown that the transition between 3G and 4G licensing occurred smoothly, as licensing practices and aggregate royalty levels did not change, despite substantial changes in products and the manufacturers involved.
5G will allow wireless technologies to become part of a broader array of products. When compared with current 4G networks, 5G promises to provide between 10 times and 100 times faster data rates, at latencies up to 10 times smaller. Faster data rates and lower latencies, in turn, may enable new technologies for automated manufacturing, private mobile networks, and fixed wireless access (FWA). These new technologies will create new markets and attract new entrants. For example, Multi-Access Edge Computing (MEC) will invite new participants into the 5G system, which may include firms in semiconductors (for example, Intel), computing (for example, Dell, VMWare), cloud services (for example, AWS) and more.Footnote 1 These new participants may take advantage of opportunities for specialization to create and patent innovations, and may implement external innovations to create new products and services. As such, they may become part of the 5G licensing landscape, whether as licensor, licensee, or both.
What role should competition policy play in emerging 5G markets? The seeming uncertainty about the practices and royalties that will emerge in new licensing markets may tempt antitrust authorities to intervene to regulate licensing or fix and apportion aggregate royalties. Indeed, for many years the Federal Trade Commission, the Department of Justice, the European Commission, and several academics and industry consultants have argued that the market prices that emerge from royalty agreements are the result of “excessive royalties” wrought by the additional monopoly power conferred by standardization. The central point of this chapter, however, is that economic theory and actual experience with royalty setting in 3G and 4G suggest that the revenues that patent holders obtain are not monopoly rents. Indeed, the level of royalties indicate that rents enjoyed by patent holders are Ricardian – that is, these rents reflect the fact that the selected technology creates more value per unit of input than the alternatives, not the exercise of economic market power.Footnote 2 Thus, the rents enjoyed by technology developers are the result of competition among technologies.
Indeed, 5G technology developers and implementers continue to collaborate to develop, produce, and deploy 5G products and services. Further, as with prior cellular technologies, consumers, enterprises, and implementers can choose among many alternatives to 5G for various tasks. Thus, 5G is being deployed under the same conditions that characterize the well-functioning cellular SEP licensing market. This market has achieved a long-term equilibrium across the period of our research (2007–2021), spanning the deployment and use of 2G, 3G, 4G, and 5G technologies. In this equilibrium, cumulative royalties have converged to market values, and the market has apportioned them according to the incremental value generated by each holder’s intellectual property (IP) assets. 5G and prior cellular technologies earn Ricardian rents determined by the differential value that those technologies create over alternatives.
We are, therefore, not aware of a prima facie argument to justify the intervention of competition authorities to regulate 5G royalties. Competition authorities should instead be watchful over the equilibrium that has existed in the market for cellular SEPs over the past decade or more, ensuring that parties do not undermine it through tactics employed to maximize their own share of economic surplus. If parties undermine the equilibrium in this manner, the results could be tragic for the associated technology, product, and service markets.
Further, competition policy should anticipate the arrival of new market participants, and the important role that 5G technology developers will play in the emergence of new markets. It should also anticipate that these new participants and markets may differ from present 5G-enabled participants and markets in terms of structures, behavioral norms, and other salient features. These new participants may lack a history of cellular SEP licensing. Such markets may need to find new solutions to adopt 5G or may need to adopt or adapt approaches from current 5G-enabled cellular SEP markets. Based on the experience of the past two decades across multiple cellular technology generations, it is our view that these markets will find their way to remunerate investments in R&D, so long as SEPs and SEP licensing transactions can be reliably enforced as elsewhere and as appropriate.
The rest of the chapter is organized as follows. In Section II, we briefly describe 5G and how its technological characteristics expand capabilities and alter network architecture. In Section III, we argue that the incremental value that the technology creates at the margin is a rent, and the source of this rent is the factor that informs competition policy. Section IV reviews substitutes that perform part of the functions that 5G can execute. Section V concludes.
II. What Is 5G?
5G provides an integrated cellular system performing the useful and relevant functions typical of prior cellular networks. Like 3G and 4G, 5G also provides a new radio technology (5GNR) and expands technical scope and functionality. In addition, 5G provides revolutionary new options for deployment architecture and opens the door to a broad range of entirely new applications.
A. New 5G Technologies and Capabilities
Table 3.1 shows that 5G will provide data rates potentially up to 20 gigabytes per second (gbps) (v. 4G: 20 megabytes per second (mbps)) and latencies as low as ~1 millisecond (ms) (v. 4G: 20–30 ms), and allow for considerably denser networks, of more than one million connections per square kilometer, which can support massive Internet of Things (IoT) deployments. In addition, 5G networks facilitate private networks (a network built for a specific organization – for example, on a university or corporate campus) and network slicing – that is, reserving part of the network for tailor-made applications for one or more specific clients.
Table 3.1. New 5G technologies and capabilities
5G also provides greater integration of useful capabilities that were formerly typically located outside cellular systems. For example, MEC (Mobile Access Edge Computing) incorporates processing capabilities at the edges of the network, in part to achieve broader system goals such as low latency. Integration also serves new applications through new specialized subsystems such as C-V2X (Cellular Vehicle to Everything) for safety coordination among vehicles, infrastructure, and other connected devices as well as UAS (Unmanned Aerial Systems) for 5G control of aerial drones.
These new subsystems stand to create value, which mobile operators, infrastructure vendors, users, and suppliers of the attendant new technologies may appropriate. Table 3.2 contains an exemplary list of markets and suppliers that could benefit.
Table 3.2. Potential beneficiary suppliers
| System/ feature | Description |
|---|---|
| MEC | |
| C-V2X | |
| UAS | |
| Private Networks |
|
| Network Slicing |
|
B. New 5G Distributed Architecture Options
The providers of radio access networks (RANs) for 2G, 3G, and 4G have long provided deeply integrated solutions comprising network equipment, software, and services. The situation resembles that of IBM in the mainframe era, in that a small number of incumbents provide end-to-end solutions to mobile operators. These incumbents, along with their consolidated predecessors such as Nortel and Motorola Networks, helped create the mobile industry. At present, four firms dominate the RAN market. Of these, Huawei and ZTE dominate the market in the People’s Republic of China (PRC) but are excluded from several markets, including the United States, where Nokia and Ericsson enjoy an effective duopoly, as seen in their market revenue shares depicted in Figure 3.1.Footnote 3
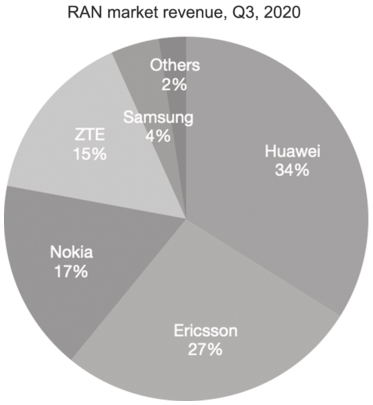
Figure 3.1. RAN market revenue by OEM
As we see in Figure 3.2, however, 5G enables new underlying architecture options, including vRAN and Open RAN, which provide network operators with additional supplier options to help build their networks. This architectural opening resembles the move from IBM mainframe to Client/Server, which launched a computing revolution. This change potentially provides opportunities for highly competitive vendors to participate in the 5G system, making it more efficient, less expensive, and more innovative. Leading industry analyst Dell’Oro forecasts Open RAN as 15% of the market by 2026, while vRAN will be 5–10%, and combined these will represent 20–25% of the market within four years.Footnote 4
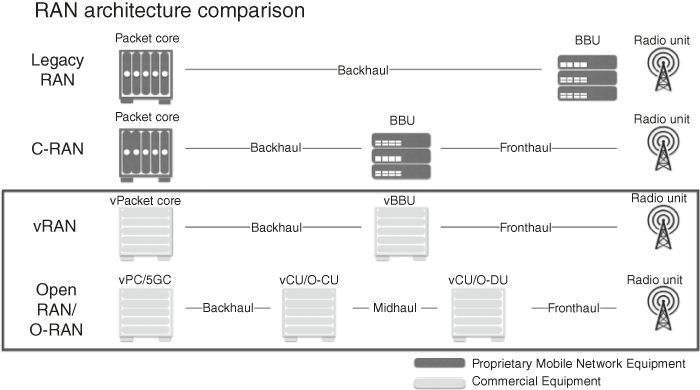
Figure 3.2. Comparison of RAN architecture options
Open RAN and vRAN enable network operators to move workloads to Commercial-Off-The-Shelf (COTS) equipment from leading computing vendors. Providers can base their equipment on world-class silicon, hardware, and software from some of the most competitive firms in the world, as well as from innovative startups, providing further diversification in the mobile value chain. Operators could use cloud service providers who can further enhance efficiency and handle these workloads as a service. Table 3.3 lists firms that potentially can participate as decentralized providers.
Table 3.3. Firms that potentially can participate as decentralized providers
| Element | Potential new beneficiaries |
|---|---|
Centralized Unit Distributed Unit | |
| NFV Software | |
| Radio Unit |
In the special case of Open RAN, operators can obtain radio units from competing vendors beyond the incumbent leaders such as Ericsson and Nokia. Qualcomm’s 5G RAN Platform for Small Cells and FSM200xx processors promises a ready avenue for small-cell entrant providers to provide competitive radio unit products. Enhanced competition in this area appears particularly desirable given the national security imperative to exclude Huawei and ZTE from many key markets.
These new architecture and vendor options promise to enable new players to enter the market for cellular services. Examples include Rakuten in Japan and, following their example, DISH in the United States. New entrants may be very helpful in the United States given the merger of T-Mobile and Sprint, which leaves just three major wireless carriers to serve the US market. The US market suffers from higher wireless prices than many other countries.Footnote 5
The nature of the new system enables new and superior applications. For example, the combination of 5G’s wireless nature and the improved performance through eMBB make 5G FWA a practical alternative to fixed broadband services based on FTTx and DOCSIS. This should benefit wireless carriers, FWA vendors, and broadband consumers.
In short, 5G brings an array of new technologies, scope improvements, features, and applications. While each may create value, the value may accrue to different market segments and participants in each case based on the nature of each improvement. Most improvements may chiefly benefit carriers, while others may chiefly benefit enterprises, vendors of particular types of equipment, software or services, or others. Interestingly, the expanded scope of 5G means that many mobile device vendors may be agnostic to many of these improvements since they are targeted at other markets and other parts of the mobile value chain.
C. The 5G Value Chain
A notable feature of the 5G value chain is that it involves multiple, specialized firms that act in a decentralized fashion, coordinated by standards and market interactions. In that respect, the 5G value chain is like the value chain of previous technological generations, only more advanced and perhaps more complex.
As is well known, the theory of patent holdup and royalty stacking predicts that a market characterized by multiple agents contributing to a standardized technology will be able to exploit monopoly power. According to the theory, the existence of multiple monopolies strangles markets and most of the price paid by consumers will redound to the profit margins of the technology development firms.Footnote 6
A testable implication of the theory is that implementers “see down” the game tree, and therefore refrain from making investments. It is therefore curious that implementers in 5G do not seem to be concerned about this possibility. They are making sizable investments. We think that they are likely drawing on the history of 3G and 4G in making their investment decisions.
III. What Determines Royalties? Lessons from 3G and 4GFootnote 7
In this section, we argue that the appropriate framework to think about royalties in new markets is standard price theory, which explains where value comes from and how it is distributed among the factors of production that create value in any given market. In 5G, IP is one of these factors of production, and its market price – the royalties paid by implementers – will indicate the incremental value that the technology creates at the margin. The main point is that this incremental value is a rent, and the source of this rent informs competition policy.
A. Value and Distribution in Wireless Mobile Markets
Price theory observes that in equilibrium the price paid by consumers equals the value created by the entire production chain at the margin, as determined by the good’s demand curve. This is true whether the good or service is a pound of bread, a bundle of pins, or a phone.
Price theory also shows that the total revenues generated by sales in a market are distributed among the factors of production – those inputs that were involved in the production of the final good – based on the value each adds to total revenues at the margin. It follows that revenues are exhausted by the payments made to the input suppliers along the value chain. These revenues remunerate the opportunity cost of the inputs used in the production of the final good and any rent that factors of production receive.
We follow our 2021 paperFootnote 8 and illustrate these insights with a simple supply and demand graph. Figure 3.3 depicts the observed equilibrium in the smartphone market in 2016. For simplicity, we parameterize the world market with a single linear demand curve and assume that all consumers paid the average selling price of a smartphone.Footnote 9
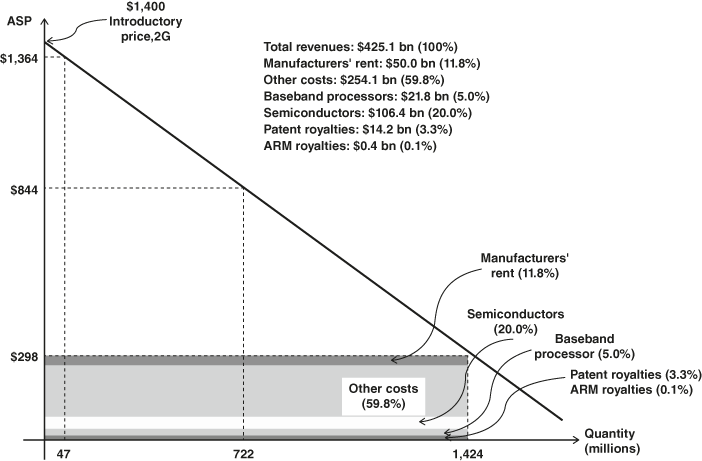
Figure 3.3. Value and distribution in the smartphone value chain
In 2016, phone manufacturers sold 1.42 billion units for $425.1 billion, at an average selling price of $298.Footnote 10 Because consumers are free to buy a phone, the demand curve shows how much consumers value a smartphone at the margin. On average, $298 is what the least willing consumer in 2016 was willing to pay for a smartphone. Figure 3.3 also shows that most consumers valued their phones at more than $298 and obtained a net surplus when they bought a phone, the difference between their willingness to pay, as shown by the demand curve, and the market price. It follows that the total consumer surplus was equal to the area between the demand curve and the market price for phones. According to the demand curve depicted in Figure 3.3, consumer surplus in 2016 was equal to $784 billion.Footnote 11
Figure 3.3 also shows how the revenues generated by the sale of smartphones were distributed among phone manufacturers and input suppliers. Roughly 20% of the revenues accrued to semiconductor manufacturers ($85 billion; $60 per smartphone, on average); 5% accrued to manufacturers of baseband processors ($22 billion; $15 per smartphone, on average); and 60% of the revenues ($254.1 billion; $178 per smartphone, on average) accrued to the producers of other inputs, such as the firms that made the cameras, gorilla glass, and housings, as well as the firms, such as Foxconn, that assembled the phones. Around 12% ($50 billion; or $35 per smartphone) reached the firms that sold the phones in the form of profits, most of which accrued to Apple.
IP is an asset, and royalties are the revenues that this asset generates. As can be seen in Figure 3.3, 3.4% of the revenue generated by the smartphone market reached the owners of patents ($14.2 billion, or roughly $10 per smartphone). Most of this ($12.4 billion) was earned by SEP owners. The remainder was largely earned by non-SEP patents, held by firms such as Microsoft (which earned royalties mainly on the patents on its operating system and software technologies), the patent pools that license audio and video codecs, and patent assertion entities that own the patents necessary to manufacture semiconductors.

Figure 3.4. Monopoly licensor sets the royalty rate
The distribution of the $425.1 billion in revenues among input providers reflects the choices that firms in the production chain made to substitute away from more expensive inputs toward less expensive inputs. Thus, firms at the end of the production chain, which designed and marketed the phones (for example, Samsung, Apple), combined inputs from many suppliers to minimize the costs of producing the smartphones that consumers valued. Similarly, the firms that produced the intermediate inputs and IP for those smartphones (for example, Corning, Ericsson) also combined inputs from many suppliers to minimize costs. Those suppliers, in turn, purchased the necessary inputs from firms even further up the production chain, and so on. Each input in the production chain had its own demand curve. That is, the demand curve each producer faced was derived from the demand for smartphones, and the elasticities of each demand curve depended in part on the possibilities for substituting away from that input. Consequently, firms along the production chain equalized the value created by each input at the margin with the input’s market price.
The share of each input in the $425.1 billion in revenues in the smartphone market was therefore the equilibrium outcome of a complex process of cost minimization. Because the output of an upstream firm is the input of firms further downstream, and all value stems ultimately from consumers’ willingness to pay, no stage of the production chain is independent of, and separable from, the others – prices are determined simultaneously in all of them.
What does price theory tell us about how to value the IP necessary to produce a smartphone? The royalty is the rental price of IP and is a function of the value that consumers were willing to pay for the capabilities created by those patented technologies, at the margin, and the possibilities that producers had to substitute away from using those IP assets toward alternative technologies. The finding that the patent holders earned 3.4% of the value of the average smartphone in 2016 has three complementary interpretations. First, the purchaser with the lowest willingness to pay for the average smartphone valued those technologies at the equivalent of just 3.4% of the price she paid for her smartphone. Second, there must have been alternative technologies toward which producers could eventually substitute. If that had not been the case, then the owners of the IP property would have operated as monopolists and charged far more than 3.4% of the value of a phone, a point to which we return later. Third, and importantly, IP owners did not enjoy market power; they could not constrain output to raise prices.
B Economic Rent and the Distribution of Value across the Stages of the Production Chain
Should competition authorities care about the level of royalties? Some argue that patent holders can charge royalties because they enjoy monopoly power, even beyond that granted by the patent. According to this argument, the profits that patent owners obtain are rents wrought by market power, and there is a natural role for competition policy. A different explanation, however, is that the revenues that patent holders obtain are the fair remuneration of their investment, given the risks they took when researching and developing the technology. In this view, the rents enjoyed by patent holders are Ricardian – their origin is that the selected technology creates more value per unit of input than the alternatives, not the exercise of market power. According to this argument, rents are the result of competition among technologies, and there is little, if any, role for competition policy.
Thus, the nature and origin of the rents made by patent holders are central to assessing whether competition policy must do something, if anything, about royalties. To appreciate the difference between a monopoly rent and a Ricardian rent, a few diagrams help.
Consider first a royalty set by a patent holder who holds a monopoly because nobody can produce without infringing the monopolist’s patent. To keep the argument simple, we assume that the monopolist licenses the technology to competitive manufacturers that can produce phones at constant cost c. As Figure 3.4 shows, when fixing the royalty rate, the monopolist patent holder confronts the market demand for the final good, and reasons that if she sets the royalty equal to R, competitive manufacturers will pass on the royalty and set a price p = c + R for a phone.
Thus, by fixing R, the monopolist patent holder controls the final price p. Also, by setting R, the monopolist patent holder controls the per-unit rent. Standard economic theory says, and Figure 3.4 shows, that the monopolist patent holder will increase R to contract output until the marginal revenue from selling phones is equal to the manufacturing cost c. In equilibrium, the price of a phone will be equal to pM = c + RM and then
 (3.1)
(3.1)where η is the elasticity of the demand for phones. It follows that, just as for a standard monopolist, pricing is determined by the classic Lerner formula.
A Ricardian rent, by contrast, emerges when a firm produces more or higher quality output per unit of input than its competitors. Because a Ricardian rent remunerates a competitive advantage, it can emerge in a competitive market. Observed royalties have nothing to do with market power.
To appreciate this point, Figure 3.5 draws the standard average and marginal cost curves of a competitive licensee. The figure shows an innovation that increases quality and consumers’ willingness to pay by a factor λ > 1 over the alternative, and in equilibrium, products that use the technology command a market premium equal to (λ − 1)pc. Thus, the licensee obtains additional revenues equal to the shaded rectangle. This rectangle is the Ricardian rent wrought by the technology, which the patent holder can appropriate through licensing and charging royalties. But its origin is the market premium (λ − 1)pc, and its total amount is capped by the incremental value created by the technology.

As can be seen in Figure 3.5, the royalty is part of the licensee’s average cost. The licensee covers all her costs, and the good’s market price equals its long-run marginal cost. But because a better technology commands a price premium, which is equal to consumers’ differential willingness to pay, well-functioning markets naturally create the rents and rewards that incentivize investments in R&D. This rent may be transferred to the patent holder via per-unit royalties, a lump-sum payment, or a combination of both. Whatever the means whereby the Ricardian rents are transferred, they remunerate those technologies that are more productive and deliver more output or value per unit of input.
It follows that competition policy may have a role if the source of the rents is the exercise of market power – that is, if technology developers are able to raise the running royalty to create scarcity at the margin. By contrast, competition policy does not have much of a role if technology developers earn Ricardian rents, which emerge in competitive markets. The point we make next is that the observed level of the royalties charged by technology developers is informative about the source of the rents.
C. Monopoly Power and Royalty Stacking in the Mobile Phone Industry
As Figure 3.6 shows, a patent holder acting as a monopolist would exploit market power by restraining output, raising the market price of the final good, and extracting the monopoly rent through the royalty. A direct test for the existence of a monopoly therefore uses the Lerner margin, as shown in (3.1) to predict the level of the royalties that patent holders would charge if they acted as a monopoly. We apply this reasoning to the smartphone market.

Figure 3.6. Value and distribution in the smartphone value chain with a single Monopoly Patent Holder (2016)
Figure 3.6 shows the same demand curve as Figure 3.3 but assumes that patent holders act as a single profit-maximizing monopolist. The main result is that patent holders would have earned 66% of all revenues of the value chain, instead of 3.3%. Higher royalties would have multiplied the average selling price of a smartphone by a factor of almost three – from $298 to $844. Consequently, only 722 million units would have been sold, instead of 1.42 billion. Despite the decline in unit sales, however, total revenues would have risen from $425.1 billion to $609.4 billion. More than two-thirds of those revenues (about $400 billion) would have accrued to the patent holders. Those revenues would have been pure rent, as they exceeded the long-run cost of the inputs used to produce the patented technologies.Footnote 12
An influential literature, known as patent holdup and royalty stacking, implies that the situation should have been even worse than outlined in the prior paragraph. The theory claims that because multiple firms own the IP that is essential to make a phone interoperable and compatible, each can exploit its monopoly independently.Footnote 13 That is, the magnitude of the cumulative royalty in the smartphone value chain predicted by the theory of royalty stacking grows with the number of patent holders.Footnote 14 Monopoly will stack upon monopoly, strangling the industry. Formally, if the number of patent holders is n, then the Lerner margin is:
 (3.2)
(3.2)In our 2017 paper,Footnote 15 we parameterize a standard royalty stacking model. We observe that in 2016, there were 21 identified patent licensors who received royalty revenue, and that the cumulative royalty yield predicted by the theory of patent holdup and royalty stacking is 79%. That is, if patent holders were each exploiting their monopoly power independently, they would receive four out of every five dollars paid for a smartphone.
A predicted royalty of 67% (a single monopolist) or 79% (21 monopolists) compares with the observed average cumulative royalty yield from the 21 identified patent licensors of 3.4% in 2016.Footnote 16 That is to say, the actual yield is more than 20 times lower than either the yield predicted by the theory of patent holdup and royalty stacking or by the predicted royalty that would be charged by a single profit-maximizing monopolist.
The implication is that patent holders in the smartphone value chain do not exercise any meaningful monopoly power. On the contrary, the remuneration that patent holders receive is a Ricardian rent. Thus, the evidence from 3G and 4G is that there is no evidence that standardization creates market power. Because of this, there is little ground to claim that competition authorities have any meaningful role to play in cellular SEP licensing as traditionally practiced within the smartphone industry.
D. 3G and 4G: A Functioning Licensing Market
As we have seen, in 2016, the average royalty yield for a smartphone was 3.4% of the average selling price of a smartphone. In our 2018 paper,Footnote 17 we estimated royalty yields from 2007 through 2016 and found that they showed remarkable stability. Figure 3.7 shows the average royalty yield since 2007 for 16 licensors, which accounted for 78.2% of all royalty revenues in 2016. Since 2009, we have data for 21 licensors, which accounted for 92.5% of all royalty revenues in 2016. As Figure 3.7 shows, both series are remarkably stable. The average cumulative royalty yield of firms with data since 2007 hovers between 2.1% and 3%; the average cumulative royalty yield of firms with data since 2009 hovers between 3% and 3.5%, falling only marginally during the last three years. Note that, as can be seen in Figure 3.8, the composition of sales between feature and smartphones changed significantly during the period, and the value of sales roughly doubled, and yet the average cumulative royalty yield remained stable.
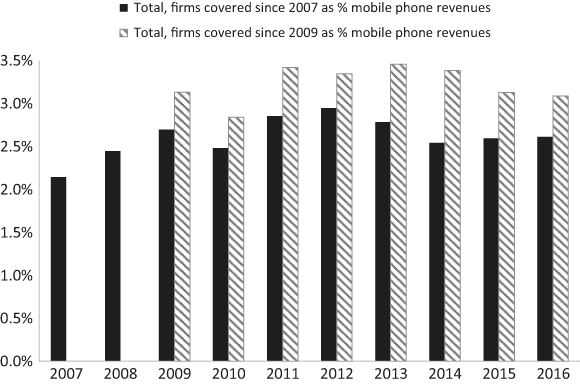
Figure 3.7. Patent royalties as percentage of the value of mobile (smart and feature) phones shipped (2007–2016)
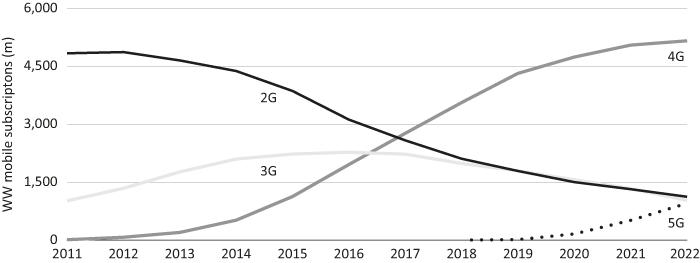
Figure 3.8. WW mobile subscriptions by cellular generation
E. New Estimates of the Cumulative Royalty Yield
Since our research described above, we have continued to monitor the market for cellular SEP licenses, although we have modified our methodology so that we now focus on cellular SEP licensing specifically.Footnote 18 The leading cellular SEP licensors are Qualcomm, Nokia, Huawei, Ericsson, and Interdigital. These constituted 84% of royalties in 2016, the last year covered in our prior studies.Footnote 19
As can be seen in Table 3.4, these five licensors obtained $82 billion in royalty revenues during 2015–2022, on average about $10.2 billion per year. On average, royalties were $9.05 per smartphone. If we make room for other licensors, average royalties per mobile device are about $9.79, in line with the orders of magnitude in our previous research. Basically stated, the data are consistent with our earlier estimates. In conclusion, little seems to have changed since the period covered in our previous research – a profound observation given the passage of so many years and the corresponding changes in markets, technologies, products, and companies.
Table 3.4. Leading cellular SEP licensing businesses (2015–2022)
IV. Lessons for 5G Licensing
We have seen that the R&D investments that yielded the previous technological generations have been remunerated by Ricardian rents, which emerge in competitive markets and reflect that the selected technology creates more value per unit of input than the alternatives. What does this suggest about the licensing equilibrium that will emerge in 5G?
So far, the evolution of 5G suggests that technology developers and implementers have and will continue to collaborate to develop, produce, and deploy 5G products and services. Thus, 5G replicates the conditions that yielded the functioning licensing market for 2G, 3G, and 4G. An additional reason to think that investments in 5G will be remunerated by Ricardian rents is that consumers, enterprises, and implementers can choose among alternatives to perform many of the tasks that 5G will perform. In a competitive market, therefore, 5G will earn a rent, but it will be determined by the differential value that the technology creates over the alternatives.
Indeed, parties in each market are likely to consider the appropriateness of 5G for their specific situations in light of alternatives and substitutes. Different jobs for different customers may be accomplished with different devices, on different networks with different underlying network technologies.Footnote 20 This may depend upon the required data rates, latencies, ranges, power consumption limitations, mobility characteristics, and costs. These factors may determine whether and when a substitute or alternative displaces 5G and when it cannot. In what follows, we briefly review several potential alternative technologies that perform at least some of the tasks that 5G can accomplish, effectively acting as substitutes.
A. 5G Alternatives and Substitutes
1. Competition from Predecessors
5G must contend with its predecessors, 4G/LTE and 2G/ GSM. GSM remains highly useful and popular in specific geographic regions, powering roughly the same number of devices shipped in 2020 as in 2007. What does this mean? We can look at this from the perspective of the “Jobs to be Done”Footnote 21 framework developed by Clayton Christensen and colleagues. In this framework, it is critical to understand the “progress a consumer is trying to make in particular circumstances.” The answer can indicate which products consumers will “hire” for a job. The decisions by consumers here suggest that 2G continues to sufficiently address the job-to-be-done for some customer segments. Interestingly, as Figure 3.8 shows, consumers quickly moved on from 2G’s immediate successors, 2.5G and 3G, to 4G. Time will tell whether such segments move on to 5G, relegating 4G to the historical record, or whether 4G can, like 2G, retain a segment of consumers over the longer term.
Similarly, 4G has successfully addressed smartphone-based jobs such as getting to a meeting, arranging a dinner, or planning a vacation. Some 5G-capable smartphones continue to enable such tasks over 4G networks to save power, moving users to 5G only for select tasks where higher bandwidth justifies higher power consumption. Such tasks might include the much-discussed use case of preparing for a long trip by instantly downloading entire movies, but more likely will involve fundamentally new jobs most of us cannot currently foresee.
2. IoT Applications
From an IoT use case standpoint, 5G provides support through its mMTC capabilities. However, some IoT use cases may continue to employ traditional proprietary wireless technologies such as DJI OccuSync for UAV control, or standardized alternatives such as Wi-Fi, Bluetooth LE, Wireless HART, LoRaWAN, or other options. In each case, markets can consider performance, cost, and suitability for the use case at hand. For example, within the home or enterprise, many IoT devices do not require a mobile network to connect, and so Wi-Fi or Bluetooth may be satisfactory and lower in cost. For some IoT deployments in the field, LoRaWAN may remain appropriate, while in others 5G may provide advantages. At a minimum, 5G’s mMTC capabilities should provide value in massive field deployments.
3. Fixed Wireless Access Applications
5G delivers a legitimate mobile broadband service, which should enable it to deliver a highly competitive FWA service that its predecessors could not deliver in many geographic areas. This may enhance competition in areas with fixed broadband build-outs, such as suburbs, and also provide a first true broadband option in areas presently lacking fixed broadband services. FWA can also serve vehicles such as buses, RVs, and mobile duty trailers. Even here, 5G should face competition, however, for example, from SpaceX’s Starlink service (see Section 5, SpaceX Starlink).
4. Network Combinations and Offload
Users operating from homes, workplaces, and well-equipped “third places” such as airports, libraries, university campuses, and chain restaurants often enjoy Wi-Fi connectivity with fixed broadband backhaul for both better coverage and bandwidth. Historically, the worldwide Wi-Fi mobile data offloadFootnote 22 from 4G was 59%, and forecasts call for 70% offload from 5G. This may be desirable, as it reduces the burden on cellular networks in use cases where cellular network attributes such as mobility do not add value. The Wi-Fi plus FTTx combination may continue to address many jobs to be done for mobile device users.
Note that many jobs may leverage such network combinations. For example, the major Japanese cellular carrier KDDI will use Starlink backhaul for rural base stations. This may enable 5G or other cellular coverage to serve customers in remote locations, but only through combination with Starlink.
Different geographic locations and even regions may present different preferred combinations. For example, outstanding fixed broadband offerings in Pacific Rim metro areas may enable Wi-Fi substitutes and derivatives such as Amazon Sidewalk networks. Rural areas within the United States may lend themselves to combinations involving cellular networks plus SpaceX’s Starlink backhaul. When performing a job requires multiple networks working together, the different networks and technologies involved create value commensurate with their roles in completing the entire job.
B. Future Developments
During the lifespan of 5G, we can expect much improvement in 5G itself, as well as in some of these substitute and alternative technologies. Cisco’s Annual Internet Report observes the following trajectories for some key 5G alternatives and substitutes:Footnote 23 Fixed broadband speeds will more than double by 2023, to 110 mbps (v. 46 mbps in 2018); Wi-Fi speeds from mobile devices will triple by 2023, to 92 mbps (v. 30 mbps in 2018); Wi-Fi hotspots will grow four times, to 628 million public hotspots (v. 169 million in 2018). Cisco forecasts these improvements in the context of rapidly growing quantities of users, connected devices, and changing use cases, including for UHD video and IoT devices.
For nascent technologies, the trajectory is more uncertain and speculative, but perhaps has greater potential upside. We look at three interesting cases to consider.
5. SpaceX Starlink
This is a satellite constellation of 3,185 operating satellites,Footnote 24 with FCC approval obtained for 12,000 and plans filed with ITU regulators for an additional 30,000,Footnote 25 to reach a total of 42,000. It would provide fixed wireless access for 25 countries, and there are pending applications to serve many more. Starlink can serve vehicles such as RVs and mobile duty trailers and promises to soon serve vehicles in motion, including planes, boats, trucks, and cars.Footnote 26
6. Amazon Sidewalk
This is a LoRaWAN network technology embedded into Amazon devices such as Echo (Alexa voice assistants) and Ring (surveillance camera, doorbell, and flood light) devices, as well as Sidewalk network devices. Amazon has distributed, and continues to distribute, millions of these devices, creating a rapidly growing global Sidewalk network. There is no end-user charge for Sidewalk technology or usage. Ultimately, this network could become highly useful, at least in particular geographic areas and, for certain use, cases such as IoT deployments in those areas. Tile and similar tracker tags provide an early use case. Amazon could expand the capabilities of Sidewalk in the future to do more jobs, perhaps including some jobs presently performed by Wi-Fi or cellular networks such as messaging.
7. Helium
Another LoRaWAN network is Helium. While Sidewalk is centralized under Amazon control, Helium is decentralized. As with Sidewalk, any party can deploy one or more network nodes at their convenience and personal cost on their site. For example, a homeowner could deploy in their neighborhood, while a business property owner could deploy across its locations. In both cases, the parties can create a new revenue stream while also serving their own users. Helium coordinates these actors using a crypto-based system where node operators earn HNT crypto tokens, and network users can “burn” such tokens to obtain service. Helium has deployed over 966,000 nodes across over 180 countries and 74,000 cities.Footnote 27
Helium is now deploying a 5G network with plans for over 40,000 small cells (6,300 deployed to date) and has formed a partnership with DISH to supplement Dish’s new network build-out. It could also provide its node operators with improved or additional wireless technologies to deploy in the future under this model.
In general, we should expect these alternatives and substitutes to do various wireless networking jobs in competition with 5G technologies, and for that competition to continue over years to come (Table 3.5).Footnote 28
Table 3.5. Comparison of 5G and substitutes, alternatives, and complementsFootnote a
| Category | Technology | Max rate (mbps) | Latency (ms) | Range (km) |
|---|---|---|---|---|
| Cellular | 5G mm Wave | 20,000 (down)Footnote b | 1 (URLLC)Footnote c | <0.5Footnote c |
| 5G Sub 6 | 900 (down)Footnote d | <10Footnote e | 30Footnote e | |
| 4G/ LTE (excl. advanced) | 150 (down)Footnote f | <35Footnote f | 200Footnote g | |
| WiFi | Wi-Fi 7Footnote h | 46,000 (down) | <5 | n/a |
| Wi-Fi 6EFootnote h | 9,600 (down) | <10 | n/a | |
| PAN | Bluetooth Classic (v1.0-3.0)Footnote i | <3 | <100 | 0.01 |
| Wireless IoT | Bluetooth LE (v4.0-5.x)Footnote i | <1 | 6 | 1.0Footnote j |
| ZigbeeFootnote k | 0.250 | n/a | 0.1 | |
| LoRaWAN Footnote k | 0.006 | n/a | 10 | |
| Fixed Broadband | Starlink (satellite constellation)Footnote l | <500 | 25–50 | n/a |
| DOCSIS 4.0 (cable) | 10,000 (down)Footnote m | <1Footnote n | n/a | |
| DOCSIS 3.1 (cable) | 10,000 (down)Footnote o | <5 (LLD)Footnote p | n/a | |
| 50G-PON (fiber)Footnote q | 50,000 (down) | n/a | n/a | |
| Proprietary | DJI OccuSync 3.0 (Drone)Footnote r | 15 (down) | 130 | 15 |
a These figures provide a basic perspective on these technologies’ capabilities and position to compete to do specific jobs-to-be-done. Some of these figures may be theoretical maximums, while others may be viewed as practical maximums. Many may represent estimates of varying rigor and quality. In either case, a host of assumptions may apply; for example, one might achieve a maximum rate at a minimal range. Future advances in technology, or perhaps in implementation techniques, may improve upon these figures.
b Report ITU-R M.2410-0 (11/2017), Minimum requirements related to technical performance for IMT-2020 radio interface(s), www.itu.int/dms_pub/itu-r/opb/rep/R-REP-M.2410-2017-PDF-E.pdf.
c Ronan McLaughlin, “5G low latency requirements,” Broadband Library, https://broadbandlibrary.com/5g-low-latency-requirements/.
d Jeremy Horwitz, “The definitive guide to 5G low, mid, and high band speeds” (Dec. 10, 2019), https://venturebeat.com/mobile/the-definitive-guide-to-5g-low-mid-and-high-band-speeds/.
e Ronan McLaughlin, “5G low latency requirements,” Broadband Library.
f “How fast are 4G and 5G?,” 4G.co.uk, www.4g.co.uk/how-fast-is-4g/.
g “Ericsson and Telstra extend reach on an LTE network up to 200km,” Ericsson (Feb. 27, 2020), www.ericsson.com/en/press-releases/2/2020/2/ericsson-and-telstra-extend-reach-on-an-lte-network-up-to-200km.
h Rajiv, “Wi-Fi 7 Specifications and Features,” RF Page (May 8, 2023), www.rfpage.com/wi-fi-7-specifications-and-features/#:~:text=It%20can%20support%20data%20rates,of%20less%20than%2010%20milliseconds
i “Bluetooth low energy basics: classic Bluetooth vs. Bluetooth LE,” How to Electronics (May 20, 2023), https://how2electronics.com/classic-bluetooth-vs-bluetooth-low-energy-comparison/
j Jon Gunnar Sponås, “Things You Should Know About Bluetooth Range,” Nordic Semiconductor (Jan. 25, 2023), https://blog.nordicsemi.com/getconnected/things-you-should-know-about-bluetooth-range.
k “Comparison of Wireless Technologies: LoRaWAN and Zigbee, WiFi, NB-IoT,” DFRobot (Apr. 12, 2023), www.dfrobot.com/blog-1646.html.
l Anthony Spadafora, “Starlink internet coverage, cost, speeds and the latest news,” Tom’s Guide, (June 16, 2023), www.tomsguide.com/news/starlink-internet-coverage-speed-cost-satellites-ipo-and-latest-news.
m “DOCSIS 4.0 Technology,” CableLabs (July 3, 2023), www.cablelabs.com/technologies/docsis-4-0-technology.
n Vivian Susko, “DOCSIS 4.0, Explained,” Minim (Apr. 21, 2021), www.minim.com/blog/docsis-4.0-explained.
o “DOCSIS 4.0 Technology,” CableLabs (July 3, 2023).
p Vivian Susko, “DOCSIS 4.0, Explained,” Minim (Apr. 21, 2021).
q Jeff Heynen, “50G PON moves closer to deployment,” Dell’Oro (Apr. 19, 2023), www.delloro.com/50g-pon-moves-closer-to-deployment/.
r “Consumer Drones Comparison” (July 5, 2023), DJI.com, www.dji.com/products/comparison-consumer-drones.
V. Conclusion
We started this chapter by asking what role competition policy should play in emerging 5G markets. Our analysis suggests that the R&D investments that brought about previous technological generations have been remunerated by Ricardian rents, which emerge in competitive markets and reflect that the selected technology creates more value per unit of input than the alternatives. Moreover, the evidence shows that royalty yields are an order of magnitude smaller in prior wireless generations (through 4G) than those that would obtain if technology developers enjoyed market power. In short, there is evidence that royalty rates are determined in a competitive market, and there is no evidence that technology holders operate as monopolists.
So, royalty rates have been determined in a competitive market, and as we have observed, the market for mobile device cellular SEPs appears to be in a long-term equilibrium. What might enable such an equilibrium? Cellular SEP licensing typically relies upon long-term agreements, often on the order of five years but occasionally as long as 10 years and often involving one or more parties with long-term involvement in the industry. These agreements also tend to span periods of time during which cellular technologies arrive and depart, and during which their relative utility changes. These license agreements often cover several or even all such technologies simultaneously (for example, 5/4/3/2G and even “future generation” rights), in the form of license grants and/or in complex combinations with other rights such as covenants. Some license agreements provide this coverage for a fixed amount of royalties paid out in a structured fashion within the term of the agreement.
Because of this, cellular SEP royalties appear “sticky” in the aggregate, and do not change quickly as might prices for commodities traded in spot markets. Many implementers may have entered the 5G market while operating under agreements established years before. Of those who entered the market with 5G licenses, some may have done so through serendipity when prior licenses happened to expire in a timely fashion to parallel their product roadmap transition to 5G. Note that individual parties may conduct their licensing activities differently on one or more of the deal parameters described earlier.
There are indications that Ricardian rents drive 5G as well. 5G has been developed in decentralized fashion with collaboration among specialists and others, as has been the norm. 5G confronts competition for the jobs-to-be-done from alternative technologies, including from 4G/LTE and 2G/GSM. This suggests that the equilibrium will continue, with royalties converging to market values and apportionment among licensors according to the incremental value generated by their respective intellectual property assets.
For these reasons, competition authorities should remain vigilant as always in observing the market but should not presume that monopolistic market power or other problems will distort the market for 5G cellular SEPs. Instead, competition authorities should be watchful over the equilibrium that has determined cellular SEP royalties for many years lest market participants employ tactics that undermine it and produce tragic consequences for its corresponding product and service markets.


 Open access