


INTRODUCTION
Communities of practice are groups of people who share ideas and artifacts related to a common interest or passion, which they use to enhance their practice.Reference Li, Grimshaw and Nielsen 1 , Reference Wenger 2 As communities of practice develop online in emergency medicine,Reference Li, Grimshaw and Nielsen 1 , Reference Thoma, Paddock and Purdy 3 social media (SoMe) is rapidly evolving into a critical tool for the dissemination of new scholarly material and resources for practitioners.Reference Thoma, Mohindra and Artz 4 , Reference Chan, Trueger and Roland 5 It is becoming important for authors, research groups, and journals to do more than simply publish research; they are increasingly tasked with assisting in the dissemination and knowledge translation of their work.Reference Chan, Trueger and Roland 5 This is especially important in the field of emergency medicine, where SoMe tools, including Twitter, Facebook, blogs, and podcasts, are frequently used by trainees and practitioners.Reference Mallin, Schlein and Doctor 6 - Reference Lulic and Kovic 8 As an example of the effective use of SoMe to disseminate new knowledge, a recent infographic initiative run by BoringEM.org (now CanadiEM.org) translated the 2015 American Heart Association guidelines into a collection of infographics.Reference Bigham 9 The blog post where these graphics are housed has been viewed well over 60,000 times. Although this reach is impressive, it underestimates their impact, because they were also downloaded and shared through private SoMe platforms (e.g., Facebook, WhatsApp).
Because emergency medicine’s online community of practice is comfortable accessing and using these resources, we anticipated that articles promoted using podcasts and blog-based infographics will be more broadly disseminated to increase awareness of new research. Although a significant amount of literature has been published on the utilizationReference Mallin, Schlein and Doctor 6 - Reference Lulic and Kovic 8 and qualityReference Lin, Thoma and Trueger 10 - Reference Chan, Grock and Paddock 13 of such resources, relatively little has been done to determine which strategies are the most effective for increasing dissemination and readership of medical research. Mixed results have been found in the investigation of promotion on Twitter,Reference Fox, Bonaca and Ryan 14 - Reference Hawkins, Hunter and Kolenic 16 and no studies to date have formally investigated the effects of collaborative promotion with popular SoMe-based websites.
The Canadian Journal of Emergency Medicine (CJEM) created a SoMe Team in 2014. The SoMe Team promoted CJEM articles on the journal’s Facebook and Twitter accounts and trialed a process of creating and disseminating secondary resources to promote selected CJEM publications. The CanadiEM website was enlisted to create and publish infographics describing CJEM articles. The Skeptics’ Guide to Emergency Medicine (SGEM) website agreed to critically appraise CJEM publications and discuss them in a series of podcasts and review articles.Reference Purdy, Thoma and Milne 17 , Reference McKenna, Thoma and Milne 18 We performed a retrospective analysis to quantify the impact of these efforts on the dissemination and readership of CJEM articles.
METHODS
The CJEM SoMe Team consisted of the CJEM SoMe editors (TM, BT, RM), a group of trainees (SH, LM, CY, AC), and two consultant emergency physicians (WBS, HM), all of whom were recruited to contribute to its work. Its exact composition varied over time with members added on an ad hoc basis as needs were identified.
Article selection
Articles published in the 2015 and 2016 issues of CJEM in the “Original Research” and “State of the Art” sections were considered for SoMe promotion with the creation of secondary resources (infographics and podcasts). Studies on SoMe topics were excluded. No article was selected for more than one promotional technique.
One article was promoted via podcast in each of the six issues of CJEM published in 2016. The article was selected from each issue by group consensus based upon their perceived interest to emergency physicians as determined by the SGEM team (KM and CB) and the CJEM SoMe editors (TC, BT, RM).
Articles promoted via the creation of infographics were published in the 2015 and 2016 issues of CJEM. From January 2015 through June 2016, articles were selected on an ad hoc basis by the CJEM SoMe editors based upon their perceived interest to emergency physicians. From July 2016 through November 2016, four articles per issue were selected by the SoMe team, and two were randomized to receive an infographic as part of an ongoing randomized trial external to this study. Infographic articles were always selected after the podcast article had been selected.
Control group articles were selected retrospectively by identifying the article with the highest Altmetric score as of January 1, 2017, from each of the 12 CJEM issues published in 2015 and 2016, which was not promoted by infographic or podcast.
Interventions
Three SoMe promotional strategies were used. Each process is outlined in Figure 1.
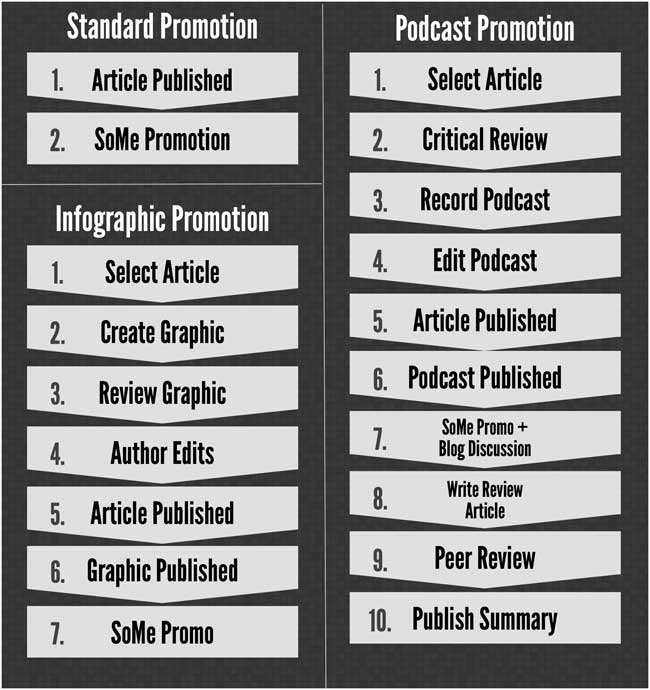
Figure 1 Graphical representation of the social media promotion process for control, infographic, and podcast groups.
All articles included in the study received standard SoMe promotion. This included a tweet from the journal’s Twitter account (@CJEMonline) and a post on the CJEM Facebook page containing a link to the article and a brief (1- to 2-sentence) summary of its contents. In some cases, the SoMe posts of the control articles included screen captures of the articles’ abstracts. The use of screen-captured images for control articles increased throughout the study period as the importance of images in SoMe promotion was recognized by the SoMe Team.
Infographics were published as part of a collaboration between CJEM and CanadiEM (https://canadiem.org). CanadiEM is a nonprofit Canadian website hosting emergency medicine content freely accessible to all users. The infographic creation process evolved over time to allow the authors of the articles promoted by the infographics to review them prior to publication. The infographic and article were also promoted on the CanadiEM and CJEM Twitter and Facebook accounts.
Podcasts were published as part of a collaboration between CJEM and the SGEM podcast (www.thesgem.com). The SGEM is a nonprofit Canadian website that critically appraises new and recent research using downloadable podcasts linked with online content. Each article was featured on a Hot Off the Press (HOP) series SGEM podcast and made freely available (in full text and as a PDF download) from the CJEM website for one month after publication. In addition, listeners and followers of the SGEM and CJEM SoMe accounts were directed to the SGEM blog to participate in a discussion of this article. Following the publication of the podcast, the SGEM team drafted a summary of the podcast and SoMe commentary that was subsequently published in CJEM.Reference Purdy, Thoma and Milne 17 , Reference McKenna, Thoma and Milne 18
Dissemination and readership
The metrics used to quantify dissemination and readership were selected by the SoMe editors in collaboration with the CJEM Editor-in-Chief.
Dissemination was measured using each article’s Altmetric score as of January 1, 2017. Altmetric scores are proprietary metrics calculated for scientific research articles that amalgamate the discussion of articles across various platforms to provide an estimate of their disseminative impact.Reference Trueger, Thoma and Hsu 19
Readership was quantified using abstract page viewsReference Page 20 and full-text page views on the CJEM website in the month of formal publication and the two subsequent months. This timeline was selected to ensure that the full impact of SoMe promotion was included while standardizing the time interval across issues. An abstract view was recorded each time that an article’s abstract page was loaded on the CJEM website. A full-text view was recorded each time that a full-text article page was loaded and each time that a PDF version of the article was downloaded from the CJEM website.
To quantify how frequently abstract viewers loaded a full-text version of an article promoted by each of the SoMe promotional strategies, the number needed to view (NNV) was conceived. The NNV was calculated by dividing the mean number of abstract views by the mean number of full-text views to provide a relative estimate of the frequency with which an abstract viewer reviews the full article for each promotional method.
Analysis
Descriptive statistics were calculated using Microsoft Excel (2016). Altmetric scores, abstract views, and full-text views were reported as the mean +/- interquartile range.
RESULTS
The selection of the articles within the control, infographic, and podcast groups is outlined in Figure 2. The average abstract views, full-text views, Altmetric scores, and NNV are presented in Table 1.
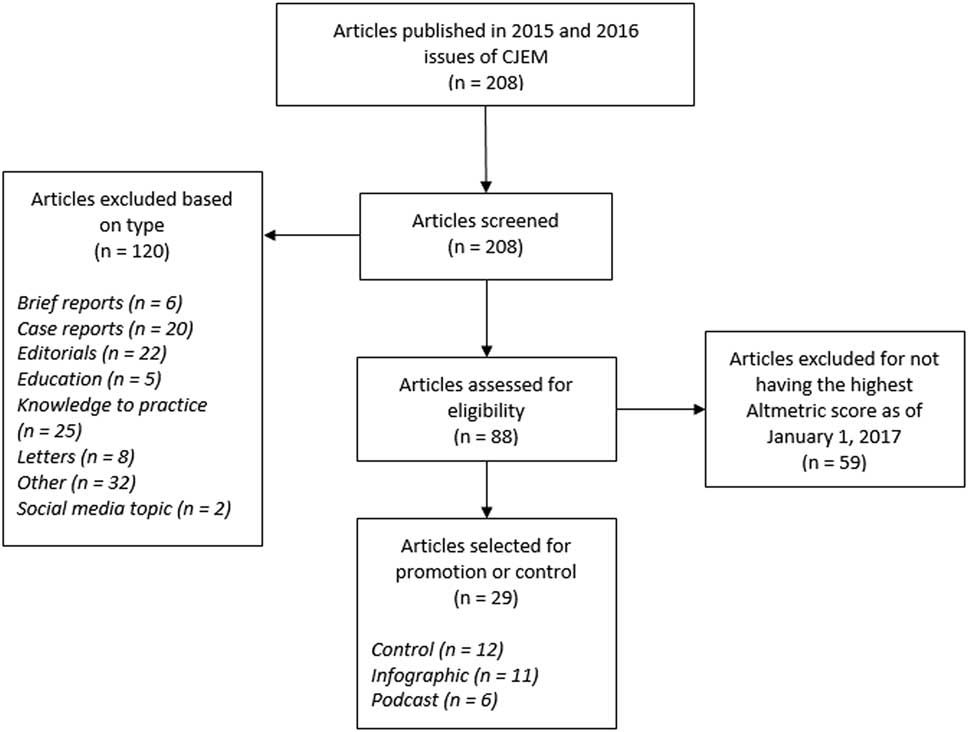
Figure 2 Flowchart outlining CJEM article selection for promotion in the control, infographic, and podcast groups.
Table 1 Comparison between the control, infographic, and podcast promotional strategies
CI=confidence interval; NNV=number needed to view.
DISCUSSION
In previous editorials, we hypothesized that SoMe could effectively disseminate new scientific findings.Reference Thoma, Mohindra and Artz 4 , Reference Chan, Trueger and Roland 5 Contrary to other journal-level analyses, which focused on SoMe promotion with social networks such as Twitter and Facebook,Reference Fox, Bonaca and Ryan 14 , Reference Fox, Gurary and Ryan 15 we considered this level of SoMe promotion to be standard for all articles and investigated the additional impact of creating infographics and podcasts. We believe that we are the first to demonstrate increased abstract readership using these modalities and to investigate the impact of SoMe-directed abstract readership on article readership through the calculation of a NNV.
Although both podcast and infographic strategies significantly increased article Altmetric scores and abstract readership, they did not significantly increase full-text readership. This was true even for articles promoted by podcasts, where full-text readership was easier because the articles were freely accessible during the month of dedicated SoMe promotion. This is concerning because it demonstrates that, although SoMe increased the dissemination of research findings, the research was not likely to have been read in detail. Because the appropriate interpretation of research requires critical appraisal, this finding suggests that the SoMe promotional strategies did not result in deep review of the research and that there is a risk that SoMe promotion could be harmful if a study’s results are presented inaccurately. This finding is more concerning for infographics than podcasts because infographics generally provide a shorter and more superficial overview of research, whereas podcasts often include a more extensive critical appraisal. Medical educators with prominent SoMe platforms should be vigilant in ensuring their accuracy and aware that the results that they promote are likely to be viewed without further appraisal of the primary literature.
On the other hand, awareness is an important first step in knowledge translation because clinicians unaware of practice-changing literature cannot change their practice. Awareness is the first step of Pathman’s knowledge translation model, which includes three additional steps: agreement, adoption, and adherence.Reference Pathman, Konrad and Freed 21 , Reference Diner, Carpenter and O’Connell 22 Beyond awareness, SoMe may foster agreement by amplifying the influence of opinion leadersReference Carpenter and Sherbino 23 and disseminating well-designed resources. The final steps of Pathman’s model, adoption and adherence, require decisions to be made at a local institution and may involve the development of new policies, the purchase of equipment, the availability of medications, practice auditing, and feedback.Reference Pathman, Konrad and Freed 21 These steps are less likely to be influenced by SoMe promotional initiatives. In general, their effect is difficult to target at a specific clinician group, which implies that it will be more effective for national or international initiatives than local implementation.
Based on our results, we would recommend that journals and researchers continue using various methods of SoMe promotion. However, there is a need for increased incorporation of experimental study designs to better determine what strategies work most effectively in various contexts. In addition to the use of Twitter, Facebook, infographics, blog posts, and podcasts, virtual abstracts are an intriguing new modality that requires study.Reference Ibrahim, Lillemoe and Klingensmith 24 Each of these modalities has different costs and may have different effects on dissemination, readership, and translation of research findings. Our results support collaboration with established SoMe as part of these efforts. Moving beyond Altmetric scores, the impact of a SoMe strategy on abstract and article readership should also be quantified with metrics such as page views and downloads. Although it has not been previously described, we believe that the NNV is a promising metric for use in comparing changes in abstract and full-text readership secondary to SoMe promotion.
Of note, only the podcast strategy incorporated the use of a discussion forum which, in addition to increasing article dissemination, required active engagement with the article from discussion participants. Because active learning has been found to be superior to passive learning in multiple contexts,Reference Prince 25 - Reference Michael 27 it is likely that more interactive strategies, such as online discussions and journal clubs,Reference Chan, Thoma and Radecki 28 , Reference Lin, Joshi and Hayes 29 would increase knowledge uptake and retention. However, an investigation of this hypothesis was outside of the scope of this study and should be considered for investigation in future research. While dissemination and readership were investigated in this study, the impact of SoMe on practice change is unlikely to relate directly to these metrics.
LIMITATIONS
Selection bias was introduced through the selection of articles for the intervention groups that were felt to be of greatest interest to the emergency medicine community. We attempted to ameliorate this by comparing their results to the strongest possible control group. The impact of podcasts is particularly at risk given that the podcast articles were selected from each issue first.
Because of the unique circumstances surrounding the SoMe promotion by CJEM, the results presented may not be generalizable. Specifically, emergency medicine has an established virtual community of practice,Reference Thoma, Paddock and Purdy 3 , Reference Wenger, McDermott and Snyder 30 the CJEM SoMe Team included two of the most influential emergency medicine physicians on Twitter,Reference Broaddus, Riddell and Brown 31 websites with prominent pre-existing SoMe followings (CanadiEM and SGEM)Reference Thoma, Sanders and Lin 32 were used for dissemination, and the SoMe Team was able to leverage the study authors to create the infographics at negligible monetary costs.
While we believe that it will be useful for comparing the success of promotion using various SoMe modalities, the NNV is a new and untested metric. It is likely to vary based on interest in the article, the impact of the journal, the quality of the resource, and the effectiveness of its promotion.
The comparison of full-text views was limited by their poor accessibility beyond those with memberships in the Canadian Association of Emergency Physicians (CAEP) or those who work at institutions with subscriptions to CJEM. However, there was no significant difference in full-text views in articles promoted by podcasts that were freely accessible for a full month. This could have been due to a lack of power.
CJEM changed publishers and website domains in January 2015 and had its Web platform upgraded in September 2016. The changing of publishers/domains likely decreased viewership metrics, whereas the upgrade of the Web platform may have increased them. These changes likely benefited the intervention groups as more articles were promoted in the latter half of 2016.
The readership metrics for all promotional modalities are likely underreported because they did not capture all avenues of readership. For example, abstract views on PubMed could not be quantified, and full-text versions of the article may have been accessed through repositories and the study authors.
Finally, while a difference in Altmetric scores was only one outcome of interest, SoMe promotion in and of itself impacts this outcome. It is unsurprising that the CJEM articles with the highest Altmetric scores were those that received more aggressive SoMe promotion.
CONCLUSION
The abstracts of articles promoted using podcasts and infographics were viewed more often than those promoted only on CJEM SoMe accounts and achieved higher Altmetric scores. However, full-text readership did not change, suggesting that this dissemination did not lead to a detailed review of the articles by readers directed to them through SoMe promotion. Randomized studies are required to overcome confounding to determine the effectiveness of these strategies for increasing readership. The preliminary results of the SoMe Team’s promotional strategies are promising.
Competing interests: None declared.


