


Introduction
Light microscopy observations of living cells and organisms in environmental samples can be hampered by their low visibility in the presence of contaminating matter. Fluorescent staining by nucleic acid probes is currently the technique of choice; however, autofluorescence and nonspecific binding in such samples are quite common [Reference Williams1–Reference Porter and Feig3]. More advanced methods have been proposed to discriminate between specific staining and autofluorescence [Reference Connally4], but those require a custom setup. Furthermore, accessibility to vital stains varies among different cell types [Reference Zachlender and Cepák5,Reference Goff and Coleman6].
Transmission-through-dye (TTD) microscopy is a recently developed imaging technique that presents living cells in a strong contrast without the need to stain cells [Reference Model7]. Thus, it might be a practical alternative, or at least a supplement, to other methods employed in observation of environmental specimens. This article describes the method and provides several examples of applications.
Materials and Methods
How it works
TTD microscopy is based on exclusion of the dye Acid Blue 9 (AB9) by living cells. In this method, 0.5–1% of AB9 is added to the original sample, which is then placed in a shallow chamber (which can be simply the space between a cover slip and a slide). The sample may be imaged on any standard light microscope in transmitted light at the wavelength of maximal absorption of AB9 (630 nm). This produces a dark background because of the absorption of light by the dye. At the same time, cells with intact membranes exclude the dye, thus reducing the depth of the absorbing layer through which light has to pass; therefore, cells appear brighter than the background in direct relationship to their thickness (Figure 1). Detritus and cells with broken membranes do not exclude AB9 and do not stand out over the background.
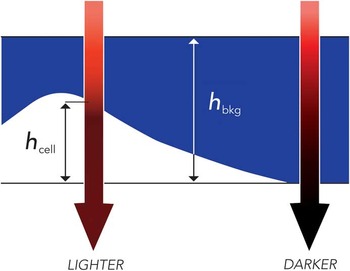
Figure 1 Principle of TTD imaging. Absorption of transmitted light depends on the travel distance through the dye, h bkg – h cell, which is the smallest above the cell. Thus, cells appear brighter than the background. Reproduced from [Reference Model7] with permission from Cambridge University Press, copyright 2012.
Specimen preparation
Samples of water were collected from natural ponds and fish tanks located on the Kent State University campus. Approximately 10 ml of water was collected into plastic 15 ml centrifuge tubes and allowed to stand for at least 10 minutes to allow living organisms to settle to the bottom. The sediment was resuspended in a small volume; in some experiments, the DNA stain Hoechst 33258 (Sigma-Aldrich, St. Louis, MO) was applied at 10 μg/ml. For TTD imaging, a 1.5% solution of AB9 (TCI America, Portland, OR) in phosphate buffered saline was mixed with the sample in a 1:1 ratio. A droplet containing ~30 μl of the sample was placed on a slide and covered with a cover slip. In another experiment, Madin-Darby bovine kidney (MDBK) cells (American Type Culture Collection (ATCC), Manassas, VA) were grown on cover slips in Dulbecco’s Modified Eagle Medium (DMEM) with 10% fetal bovine serum; the medium was replaced before observation with Leibovitz’s L-15 medium (Sigma-Aldrich) containing 0.7% AB9.
Imaging details
The slides were imaged on an Olympus inverted microscope IX81 under Köhler illumination using 20/0.7, 10/0.4, or 4/0.16 PlanApo objectives and a NA0.55 condenser. To obtain TTD images, light from a halogen lamp was passed through a 630/10 bandpass filter (Andover, Salem, NH) installed in a condenser wheel. Control brightfield images were observed through a 485/10 filter (Omega Optical, Brattleboro, VT), where AB9 does not absorb. Images were captured with a SensiCam QE CCD camera (Cooke, Romulus, MI). Phase contrast and DIC images were obtained in white light; fluorescence of the Hoechst stain was observed by illuminating the sample with mercury arc lamp using 387/11 excitation filter, 440/40 emission filter, and a multi-band dichroic filter (Semrock Inc, Rochester, NY).
Images were processed by ImageJ (https://imagej.nih.gov/ij/). In some cases, and where indicated in figure legends, TTD images are shown on a logarithmic intensity scale to better emphasize slight gradations of intensity in darker areas of the image. Using logarithmic display is justified for TTD images because cell thickness is proportional to the logarithm of transmitted intensity [Reference Model7] and also because logarithmic scale better corresponds to human vision. However, the visual effect of logarithmic transformation is often slight and amounts to a more even distribution of intensity values.
Results
When imaging intact cells, TTD image brightness is related to cell thickness, with brighter areas corresponding to thicker parts of cells. Figure 2 shows cultured MDBK cells imaged by four different techniques. The standard transmission methods, such as brightfield, DIC, and phase contrast, do not directly reveal the same thickness information (Figure 2a–2c) as does TTD (Figure 2d). Furthermore, cells with broken membranes absorb the dye and become either indistinguishable or darker than the background (Figure 2e). Cells identified as dead by TTD also show positive staining by the standard live-dead fluorescent probe propidium iodide (not shown).
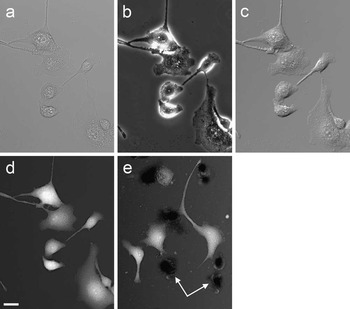
Figure 2 MDBK cells imaged by four different transmission techniques: (a) brightfield, (b) phase contrast, (c) differential interference contrast, and (d) TTD. The other TTD image (e) shows another field containing several dead cells (arrows); they appear darker than the background. The TTD images are shown on a logarithmic scale. Scale bar = 25 µm.
Selective exclusion of AB9 by intact membranes is not limited to mammalian cells but is also observed in cells from other kingdoms. Figure 3 demonstrates that intact non-filamentous green algae Coelastrum sp. show positive contrast in TTD (brighter than the background), but this contrast is eliminated by briefly placing the test tube in boiling water.

Figure 3 A sample of pond water showing the non-filamentous green algae Coelatrum sp. Images (a) and (b) show the original sample in brightfield (a) and in TTD (b). Next, the sample was exposed to 100oC for 4 minutes, and brightfield (c) and TTD (d) images were taken again. TTD images of all cells in the treated sample are darker than the background, confirming that they have been killed by heat. Contrast in image (d) was chosen to demonstrate this fact. Scale bar = 100 µm.
Figure 4 shows a filamentous green alga Microspora sp. that consists of two sections, one of which appears much darker than the other on the brightfield image (a). This information may be difficult to interpret; however, the corresponding TTD image (b) demonstrates that the darker section is intact because it excludes the dye, whereas the more transparent part is leaky. This is similar to the effect illustrated by Figures 1e and 2d. DNA staining by Hoechst of both parts was weak and not very specific.
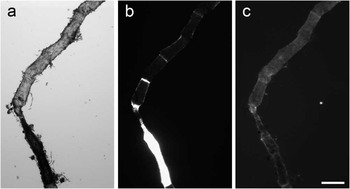
Figure 4 Images of a filamentous green alga in (a) brightfield, (b) TTD, and (c) Hoechst fluorescence. The TTD image demonstrates that only the lower segment of the alga is intact. Hoechst staining provides little information in this case. Scale bar = 200 µm.
Perhaps most importantly for the proposed application, strong contrast generated by dye-excluding cells enables one to discern living cells and organisms in samples contaminated with dead matter and debris (Figure 5). The images (a, b) show algae Chlorella sp. and cyanobacteria that are barely noticeable among numerous floating pieces of debris. However, TTD imaging makes the debris essentially invisible, while making live cells stand above the background. The images (c, d) show a mite, which is a scavenger of debris common in freshwater ecosystems. The TTD image clearly shows the entire mite’s body when brightfield microscopy shows it almost entirely obscured by debris.
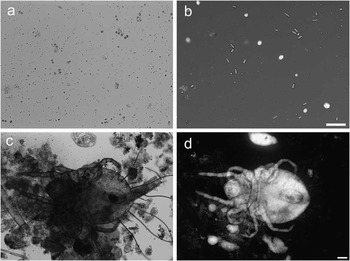
Figure 5 Organisms found in a freshwater sample collected from a fish tank. Comparison of (a, c) brightfield and (b, d) TTD. The images (a, b) show a few live single-cell green algae Chlorella sp. as well as cyanobacteria, along with numerous floating fragments. Chlorella, that are prominent on a TTD image, are barely visible in brightfield. Similarly, images (c, d) show a mite from the order Trombidiformes. A large part of the mite is hidden behind debris when observed in brightfield; however, TTD shows the entire body in clear detail. Image (b) is shown on a logarithmic scale. Scale bars = 50 µm.
While the images described above demonstrate the ability of TTD to identify living cells, false positives in TTD may result from small transparent particles, such as sand. A sample from a freshwater pond shown in Figure 6 has a colony of protozoa (unicellular eukaryotic organisms) as well as a piece of inert, presumably inorganic, material. Although the particle has a bright center in TTD, it does not appear to be a live cell, as evidenced by its strong brightfield contrast (suggesting a large refractive index difference between this object and the medium) and the lack of specific DNA staining by Hoechst.
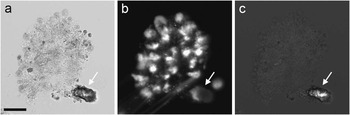
Figure 6 A sample of water from a pond showing a colony of protozoa and a particle sitting next to it. The sample was imaged in (a) brightfield, (b) Hoechst fluorescence, and (c) TTD. Even though the particle has a bright area in TTD, its very strong contrast in bright field, as well as the lack of Hoechst fluorescence, suggest its inorganic nature. Scale bar = 25 µm.
Discussion
Previously TTD microscopy was used for mammalian cells or pure bacterial cultures [Reference Lababidi8]. Here we present several examples that show that TTD is highly effective for recognizing live cells in environmental samples, even those heavily contaminated with dead matter and detritus. The concentration of AB9 is chosen so as to ensure sufficient contrast (which typically requires at least 0.5% AB9) while not making the sample too dark. The latter aspect depends not only on the dye concentration, but also on the depth of the gap between the cover glass and a slide and on the brightness of illumination. It is often convenient to put small spots of silicon grease on the slide to keep the cover slip above the slide at a distance that can be adjusted by applying light pressure; with some practice, it is easy to achieve the optimal depth judging by the color of the cover slip (it should be a rather intense sky-blue color). Alternatively, one can use fixed-depth semen counting chambers available from several vendors or glass slides with 20–30 µm strips glued along the edges, which are available from Bioptechs Inc. (Butler, PA).
Contrast in TTD depends on the cell thickness; it can be estimated that a cell with thickness h (micrometers) is brighter than the background by the factor e0.22∙c∙h, where c is the dye concentration in % w/v. TTD microscopy can be combined with brightfield imaging by switching from a red to a blue filter and allows epi-illumination for observation of fluorescent staining.
Imaging at 630 nm can be accomplished by using a bandpass filter placed anywhere between a white light source (such as halogen lamp) and an eyepiece or a camera. Illumination based on LEDs is also possible. Considering its simplicity and low cost, the method can be realized on any microscope and used not only for research but also in undergraduate labs and even in K–12 education.
Conclusion
We described the utility of TTD imaging in situations where few living cells or small organisms have to be recognized among debris and detritus, which are common in environmental samples. Exclusion of AB9 by intact cells makes them brighter than the rest of the field and therefore easily noticeable. TTD imaging can be realized on any standard light microscope equipped with a narrow-band red filter or an LED.


