


I. INTRODUCTION
The outbreak of COVID-19 is officially recognized as a pandemic by the World Health Organization (WHO) on March 11, 2020. The pandemic has made a huge impact on the world today and people can clearly feel the impact of the epidemic. In China, the COVID-19 epidemic has generated an outburst of public opinions in the Chinese Sina Weibo. Compared with other social media platforms and news platforms, Weibo is the most popular Chinese social media platform. Information on Weibo is real-time, fast propagating, subjective, and noisy. Opinions of Weibo users are representative of public opinions in China to a large extent. In this paper, we try to answer the question of how public opinion changes with the development of COVID-19 pandemic in China and figure out what key factors may cause the change of public opinion. Since public sentiment is a good indicator of public opinion, we disentangle these problems by analyzing the sentiment changes of the public on social media websites.
We divide the collected microblogs into different subsets according to two criteria: (1) geographical differences of bloggers and (2) demographic differences of bloggers. Since the first case infected by COVID-19 was identified in Wuhan in December 2019, multiple countries and regions reported infected individuals. During different stages of the outbreak, people in different regions showed different sentiment orientations. Demographic information is another factor we are interested in. People with different education levels/age may have different opinions on certain social events about COVID-19.
People's attitudes toward China, the U.S., and their governments during the COVID-19 outbreak are also interesting, since the government issued policies that directly influence people's daily lives. Therefore, we analyze people's opinions toward China, the U.S., and their governments.
Our main contributions can be summarized as follows:
• We collect large-scale data from Sina Weibo and analyze the public opinion on COVID-19 using textual information.
• We analyze and find different factors (e.g. education levels, regions, gender, and epidemic trends) that affect the orientation of the public sentiment toward China, the U.S., and their governments as well as social events in China.
• Our extensive analyses show that our collected data are informative and the factors we analyze have a significant impact on the public opinion.
II. RELATED WORK
In recent years, due to the boom of online social networks, web information plays an increasingly significant role in shaping people's beliefs and opinions. With misinformation and disinformation, such online information can easily affect online social network users, in turn having tremendous effects on the offline society. Therefore, public opinion analysis is important for monitoring and maintaining social stability.
Research studies on social media have pointed out how social media reflects [Reference Jin, Gallagher, Cao, Luo and Han1] or affects [Reference O'Keeffe and Clarke-Pearson2] the thoughts of different social groups. Badawy et al.[Reference Badawy, Ferrara and Lerman3] analyze the digital traces of political manipulation related to the Russian interference of the 2016 U.S. Presidential Election in terms of Twitter users’ geo-location and their political ideology [Reference Badawy, Ferrara and Lerman3]. Wang et al. compare the Twitter followers of the major U.S. presidential candidates [Reference Wang, Li and Luo4, Reference Wang, Feng and Luo5] and further infer the topic preferences of the followers [Reference Wang, Luo, Niemi, Li and Hu6]. More closely related to this study, [Reference Gilbert and Hutto7, Reference Lu, Hu, Wang, Kumar, Liu and Maciejewski8] explore the impact that disasters have on the underlying sentiment of social media streams. Our research draws knowledge from the body of research on characterizing the demographics of social media users, along the dimensions such as gender [Reference Wang, Feng and Luo5, Reference Rao, Yarowsky, Shreevats and Gupta9, Reference Bergsma and Van Durme10], age [Reference Nguyen, Gravel, Trieschnigg and Meder11, Reference Sloan, Morgan, Burnap and Williams12], and social class [Reference Sloan, Morgan, Burnap and Williams12, Reference Agichtein, Castillo, Donato, Gionis and Mishne13].
Sentiment analysis is a popular research direction in the field of social media. In this field, many natural language processing technologies are employed to capture the public sentiment toward certain social events and analyze the causality of the public sentiment. The majority of past approaches employed traditional machine learning methods such as logistic regression, SVM, MLP, and so on trained on lexicon features and sentiment-specific word embeddings (vector representations of words) [Reference Maas, Daly, Pham, Huang, Ng and Potts14, Reference Giachanou and Crestani15]. Best performing models of this breed include [Reference Thongtan and Phienthrakul16] which proposes training document embeddings using cosine similarity and achieves state-of-the-art on the IMDB dataset [Reference Maas, Daly, Pham, Huang, Ng and Potts14]. Yin et al. [Reference Yin, Cui, Chen, Hu and Zhou17] use Distributional Correspondence Indexing (DCI) – a transfer learning method for cross-domain sentiment classification and achieve the first place on the Webis-CLS-10 dataset [Reference Prettenhofer and Stein18]. In our study, we collected 99 913 sentiment-labeled Weibo posts and more unlabeled Weibo posts which will be detailed in Section A). To make the samples more representative and improve the reliability of the analysis results, we bootstrap the sentiment labels using a sentiment classifier. Finally, we use the user profiles to create different user group labels for users and keyword classifiers to find specific topic-related microblogs.
A number of previous works conduct qualitative and quantitative analyses using social media information of COVID-19. Yin et al. [Reference Yin, Lv, Zhang, Xia and Wu19] propose a multiple-information susceptible-discussing-immune model to understand the patterns of key information propagation on the social networks. Cinelli et al. [Reference Cinelli, Quattrociocchi and Galeazzi20] address the diffusion of information about COVID-19 with massive data on Twitter, Instagram, and YouTube. The main difference between our work from these works is that we try to track the Chinese public opinion during different stages of the COVID-19 pandemic and analyze some key factors (e.g. education levels, gender, region, epidemic trends) that might have an impact on the public opinion of COVID-19.
III. DATA AND METHODOLOGY
A) Data collection
We collect a large-scale corpus from Sina Weibo. The data collection strategy includes three parts. First, we use the dataset provided by the Data Challenge of The 26th China Conference on Information Retrieval (CCIR 2020)Footnote 1 as the seed data for classifier training. The unlabeled data provided by CCIR 2020 are also used for further processing. Second, we crawl microblogs on Sina Weibo with COVID-19-related keywords. After we obtain the COVID-19-related microblogs, we further collect the corresponding user information from Sina Weibo. Third, we crawl the comments and contexts (including the number of reposts, likes, etc.) corresponding to the second part of the data.
The first data source covers the microblogs from January 1 to February 18, while the second data source covers the microblogs from February 19 to April 15. According to the epidemic trends (the number of newly infected cases decreases in China while the number of newly infected cases increases outside China), the data from January 1 to February 18 are marked as stage 1, and data from February 19 to April 15 are marked as stage 2.
B) Classifier
Our collected dataset contains 99 913 Weibo microblogs with manually labeled sentiment polarity (positive, negative, or neutral). We use these data to train a sentiment classifier. Specifically, we use the FasttextFootnote 2 framework to implement the classifier. We use 30% of the labeled data to validate the classifier and its precision is 69%. We randomly select 30% of the labeled data to validate the classifier and report the experimental result as follows. For the neutral label, the precision is 75% and the recall is 82%. For the positive label, the precision is 71% and the recall is 63%. As for the negative microblogs, the precision is 61% and the recall is 52%. The average precision can be directly calculated as 69%. Considering the unbalanced distribution of microblogs in different opinions, where the proportion of neutral, positive, and negative microblogs in the labeled data is about 57.7%, 25.4%, and 16.9%, respectively, the overall precision and recall are both about 72%. Based on our experience, this is on par with the performance of VADER [Reference Gilbert and Hutto7] on tweets. We then use the classifier to predict the sentiment polarity for the remaining unlabeled data including the extended comment data.
After filtering the noisy and incomplete microblogs, for the topics of concern, the corresponding keywords and similar expressions are used to filter the related microblogs. For microblogs with user information, we filter the properties in user profiles attached to the corresponding microblogs, to divide the microblogs into different user groups.
C) Sentiment analysis
Using the timelines of the COVID-19 pandemic summarized by WikipediaFootnote 3, Ding Xiang Yi ShengFootnote 4 and China DailyFootnote 5, we are able to identify key events during different stages of the pandemic. These key events and the Weibo data with sentiment label enable us to track the public opinion with the sentiment polarity. In order to provide an intuitive measure of the public opinion, we define a Sentiment Index as follows:
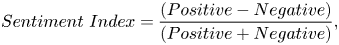
where $Positive$ or $Negative$
 represents the number of positive or negative microblogs. The Sentiment Index varies in the range of $[-1, 1]$
 , where $1$
 represents pure positive and $-1$
 represents pure negative (ignoring neutral microblogs). We build the index to capture the overall trend of the public sentiment.
IV. EMPIRICAL RESULTS
A) Volume
In this subsection, we mainly discuss this question: Who is discussing COVID-19 on the Internet considering the geographical distribution? Based on the geographical information provided by the users, Fig. 1 shows the number of uploaded microblogs from different regions. “Other” refers to users who mark their locations with the label “Other”. Because the U.S. is the world's only current superpower, Japan is near China and issued quite different policies compared with the U.S., we list these two representative countries separately. It should be noted that “Overseas” refers to overseas users except the users whose profiles are labeled with “U.S.” or “Japan”. In other words, “Overseas” refers to all countries other than China, the U.S., and Japan.
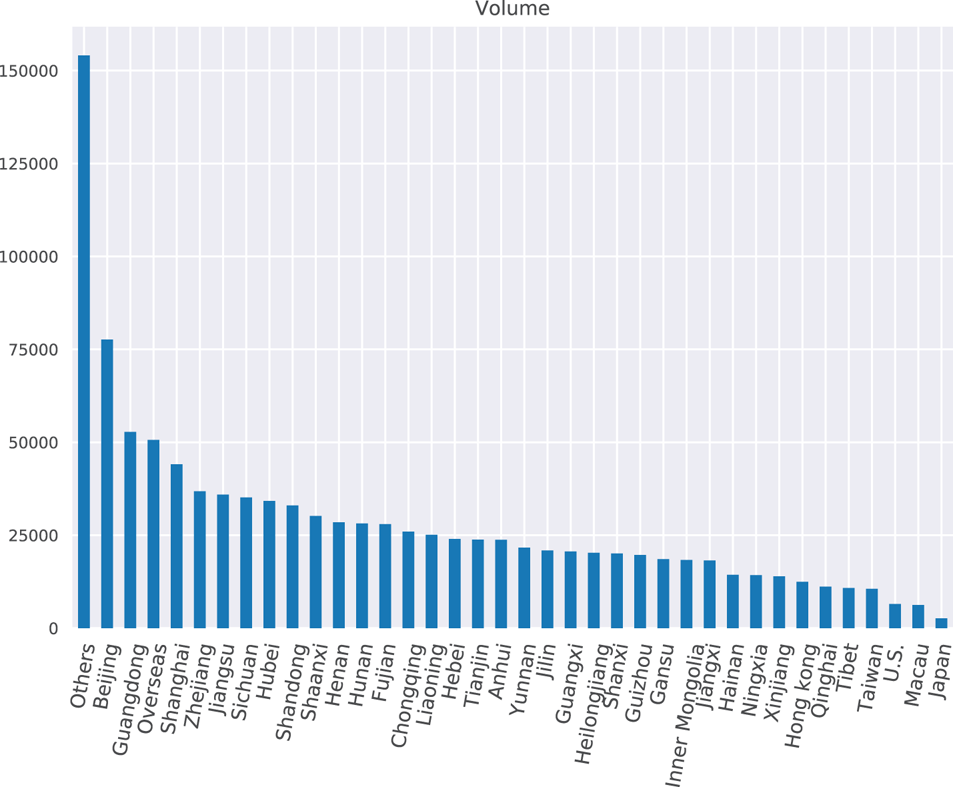
Fig. 1. Where are the microblogs on the pandemic from?
As is shown in Fig. 1, a preliminary observation is that the number of microblogs from the regions with higher GDP per capita is more than the lower GDP regions considering the administrative divisions of China. For example, Beijing and Shanghai discuss the pandemic even more than the most intensely hit areas by the pandemic, such as Hubei.
B) Overall sentiment
This subsection intends to answer two questions: How does the public sentiment vary with different stages of the COVID-19 pandemic? What are the public opinions of microblogs from different groups of users?
1) Public opinion on different stages
Figure 2 shows the sentiment proportion and Fig. 3 shows the number of different sentiments from January 1 to February 18. A direct observation is that most of the microblogs hold a neutral attitude toward the pandemic. Considering the polarity of the opinions, there is a significant decline of the proportion of positive microblogs from January 19 to January 25. Also, most of the microblogs were posted after January 19. Figure 4 shows the Sentiment Index from January 1 to February 18 and a significant decline could be observed near January 20.
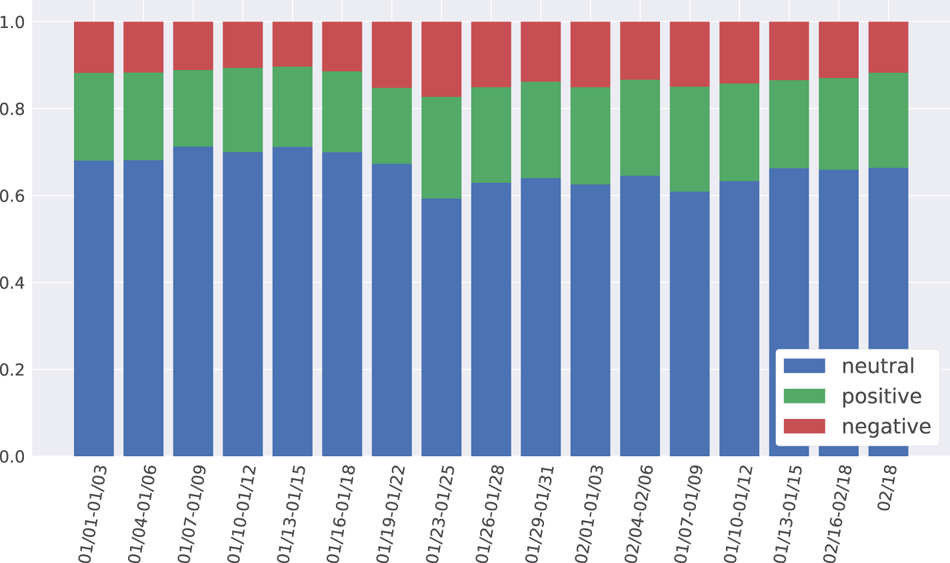
Fig. 2. The sentiment distribution of stage 1.
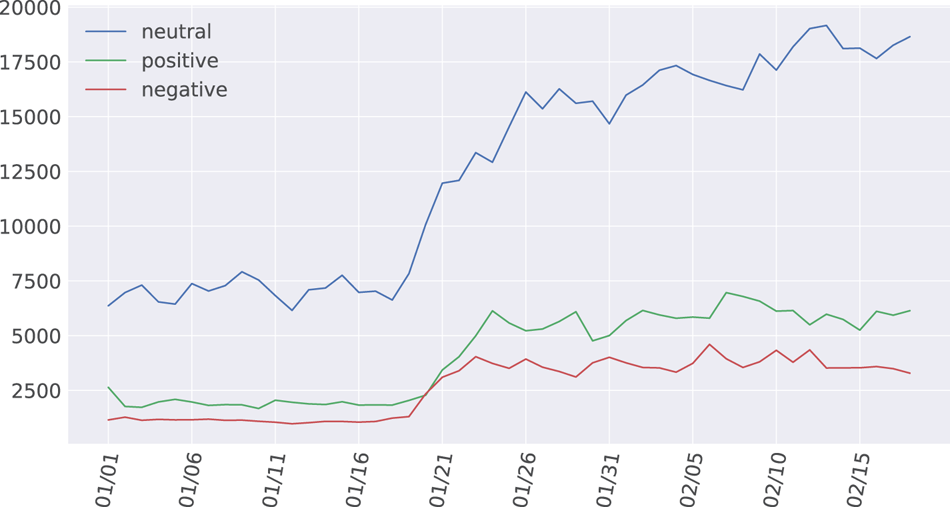
Fig. 3. The number of microblogs of stage 1.
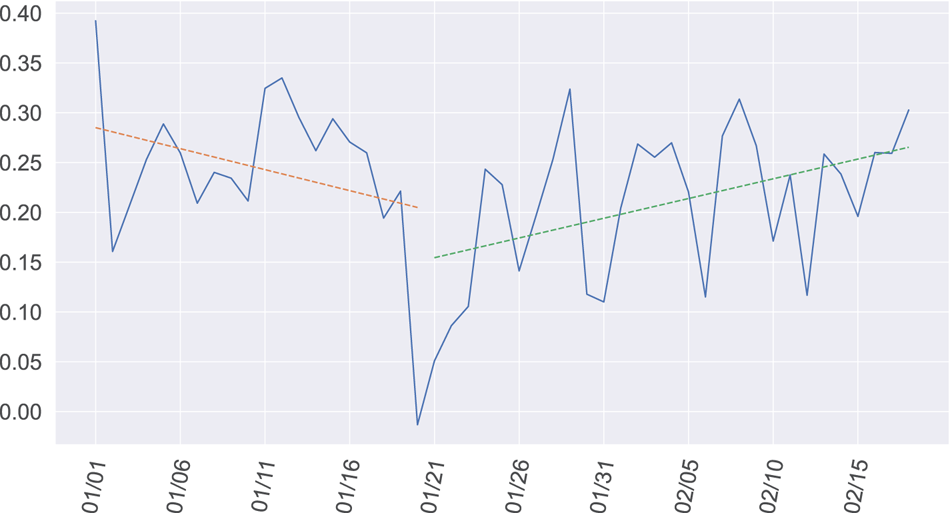
Fig. 4. The sentiment index of stage 1.
Based on the timeline, we can find two related key events: (1) COVID-19 was announced to be human-to-human transmissible on January 20. (2) A quarantine of the Greater Wuhan area beginning on January 23 was announced on January 22. The influence of these key events on public opinion is clear. We regress the Sentiment Index against the number of days from January 1 on the two parts divided by January 21, respectively, and report the regression coefficients (coef.) and t-statistics (t) as: (1) Part-1. $coef.= -0.0042; t=-1.369; P>|t|: 0.188$ ; and (2) Part-2. $coef.= 0.0040 ; t=2.635; P>|t|:0.014$
 . Overall, the opinion was positive toward the pandemic and the sentiment was becoming positive after the decline.
Figure 5 shows the sentiment proportion and Fig. 6 shows the volume from February 19 to April 15. A decrease of positive sentiment proportion can be observed from February 28 to March 1. Based on the timeline, we can find the related events: First death was confirmed in the U.S. From Figs 6 and 5, we can find that there is a decrease of the number of sentiment-positive microblogs near March 15. The key event near March 15 is that the confirmed cases in the U.S. increased from 1000 to more than 10 000 during March 10 to March 19. In addition, the U.S. President Donald Trump called novel coronavirus the “China virus” on Twitter on March 16. Based on this, Fig. 7 shows the Sentiment Index from February 19 to April 15 and the two stages are divided by March 15. We regress the Sentiment Index against the number of days from January 1 on the two parts, respectively, and report the regression coefficients (coef.) and t-statistics (t) as: (1) Part-1. $coef.= -0.0026 ; t=-0.830; P>|t|:0.415$ ; (2) Part-2. $coef.= -0.0002; t=-0.057; P>|t|:0.955$
 .
.
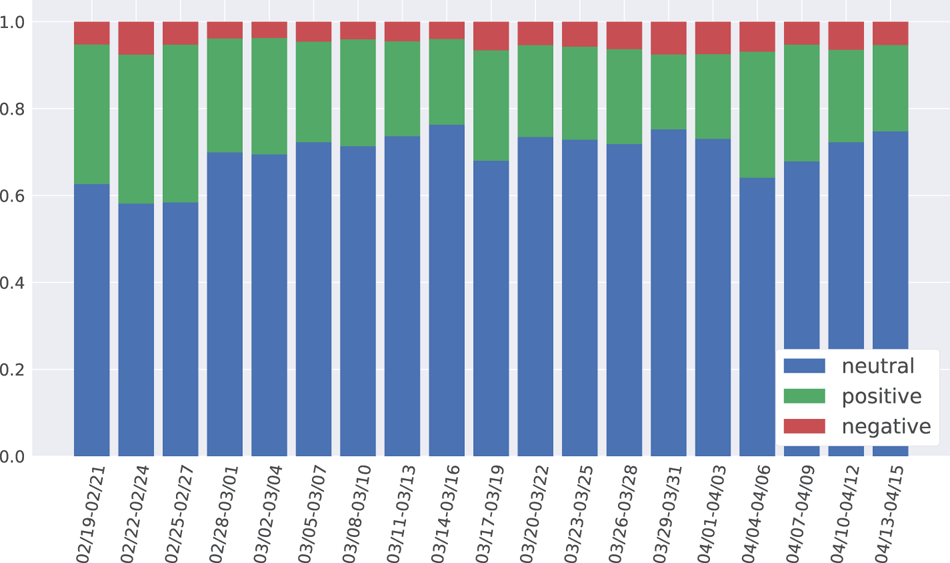
Fig. 5. The sentiment distribution of stage 2.
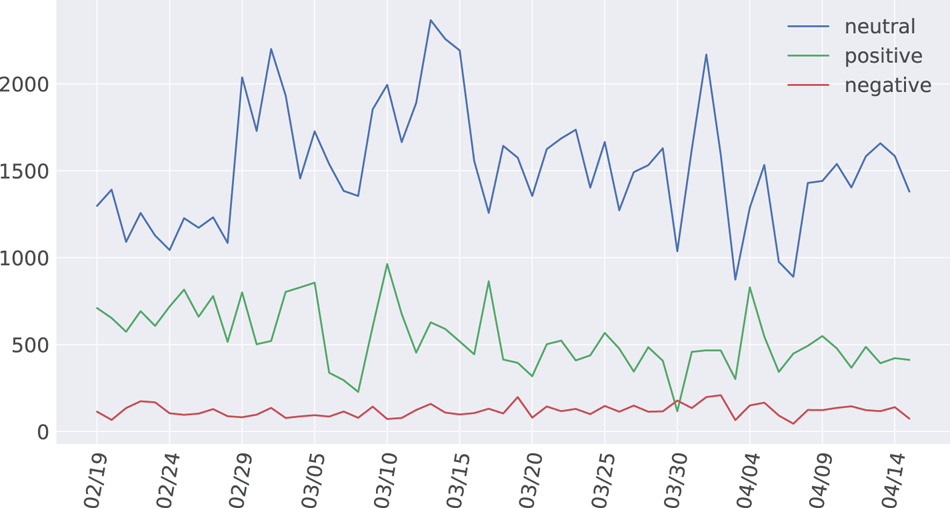
Fig. 6. The number of microblogs of stage 2.
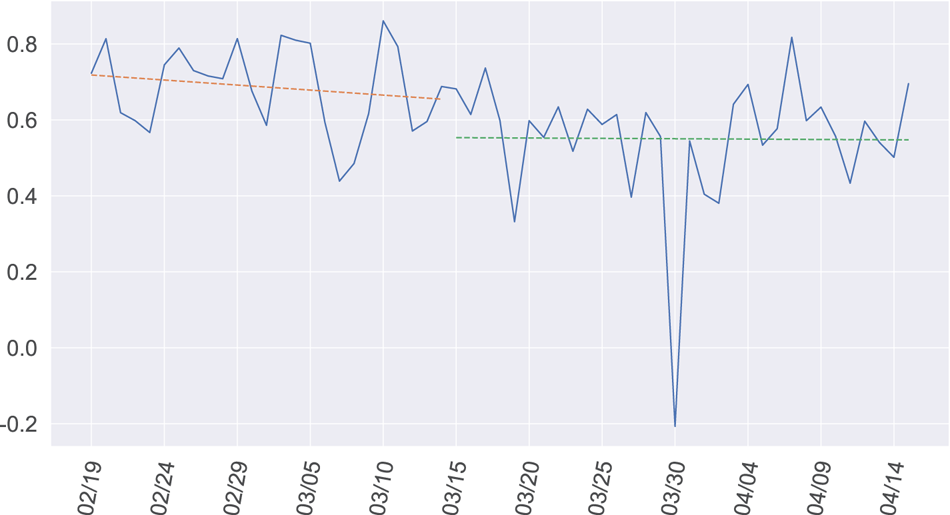
Fig. 7. The sentiment index of stage 2.
On the whole, positive microblogs are more than negative microblogs most of the time, while there is an obvious negative Sentiment Index near March 30. On that day, two COVID-19 survivors beat the CT technician of a hospital, which ignited much discussion on Weibo.
Figure 8 shows the volume of microblogs with different keywords in different stages. In stage 1, there is an increasing frequency of certain terms, such as “Wuhan” and “Lockdown” near January 23, and “Human-to-human transmission” near January 20, and strong correlation between terms “U.S.” and “Cases”, which helps us understand the relationship of microblogs and real-world events.

Fig. 8. Volume of microblogs with different keywords in different stages. (a) Stage 1. (b) Stage 2.
We also tried using January 23 to divide stage 1 into two parts, similar coefficients $-0.0071$ and 0.0024 could be generated for the first part and the second part. There are no significant differences when selecting the date for this key event.
2) Public opinion of users from different regions
We present region-related sentiment in this section. First, we select several representative regions and show the number of microblogs with different types of sentiment in Fig. 9. Clearly, Hong Kong and Taiwan hold more positive microblogs than negative microblogs. The numbers of positive and negative microblogs are close from overseas and the U.S. Japan posts more negative microblogs than positive microblogs.
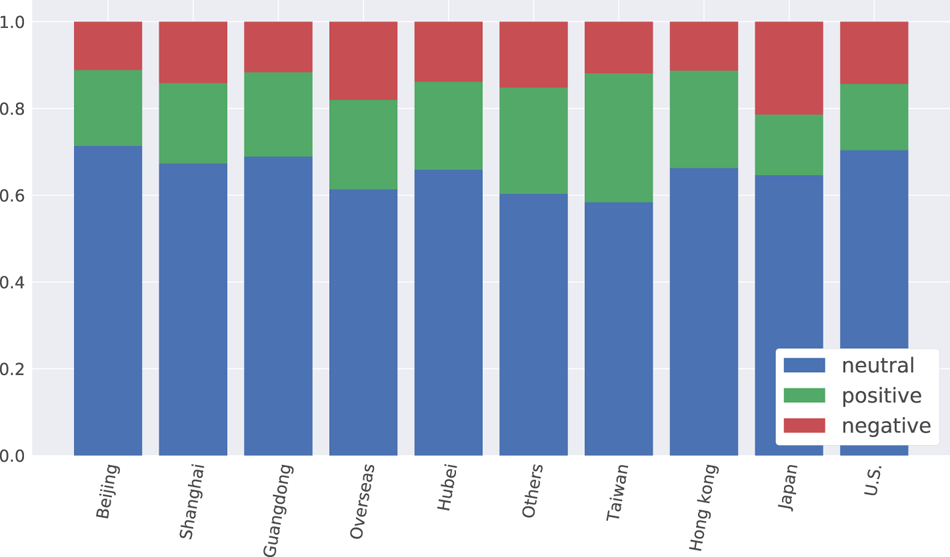
Fig. 9. Sentiment in different regions.
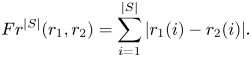
We further present a detailed analysis of the relationship between sentiment and GDP per capita of a given province of China. We rank the GDP per capita of Chinese provinces (except for Hong Kong, Macau, and Taiwan) and their positive/negative sentiment proportions. To compare the two ranks, we use Normalized Spearman's footrule given by:
where $r_1,r_2$ are two permutations and $|S|$
 is the number of overlapping items between them, when $|S|$
 is odd $max\quad Fr^{|S|}=1/2(|S|+1)(|S|-1)$
 and when $|S|$
 is even $max\quad Fr^{|S|}=1/2|S|^{2}$
 . $Fr^{|S|}(r_1,r_2)$
 represents standard Spearman's footrule as:
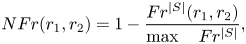
$NFr(r_1,r_2)$ ranges from 0 to 1 and a higher score indicates $r_1$
 and $r_2$
 are more similar and the comparison result of different lists is shown in Table 1. With the results of NFr, we can draw a preliminary conclusion that the higher GDP per capita a province has, the more negative microblogs and fewer positive microblogs it has.
Table 1. NFr between different ranks of sentiment.
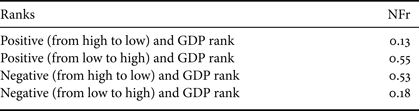
Figure 10 shows the Sentiment Index in different regions. The Sentiment Index is regressed against the number of days from January 1 on the two parts divided by January 21 respectively. The results of regression are shown in Table 2. Most of the results do not pass the t-test. There are several observations from Fig. 10: (1) most of the regions held a positive attitude toward the pandemic before January 21 and there was a clear decline on January 21 like the overall sentiment in Section B.1; and (2) Hubei suffered a significant decline near January 21 and the Sentiment Index was close to $-0.2$ here. Overseas and the U.S. hold a similar pattern, especially the U.S., the lowest Sentiment Index of the U.S. is close to $-0.4$
 .
.
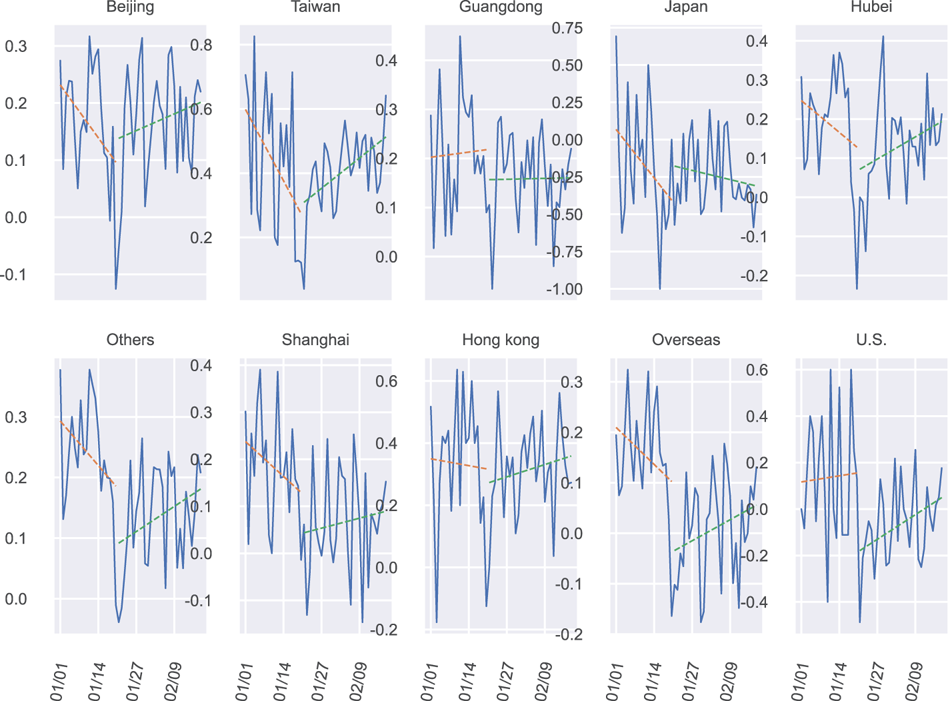
Fig. 10. The sentiment index by different regions of stage 1.
Table 2. Regression analysis of stage 1.
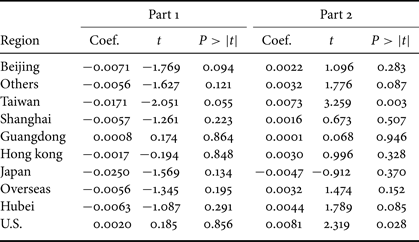
Figure 11 shows the Sentiment Index in different regions on stage 2. Sentiment Index is regressed against the number of days from January 1 on the two parts divided by March 15, respectively, and the results of the regression are shown in Table 3.
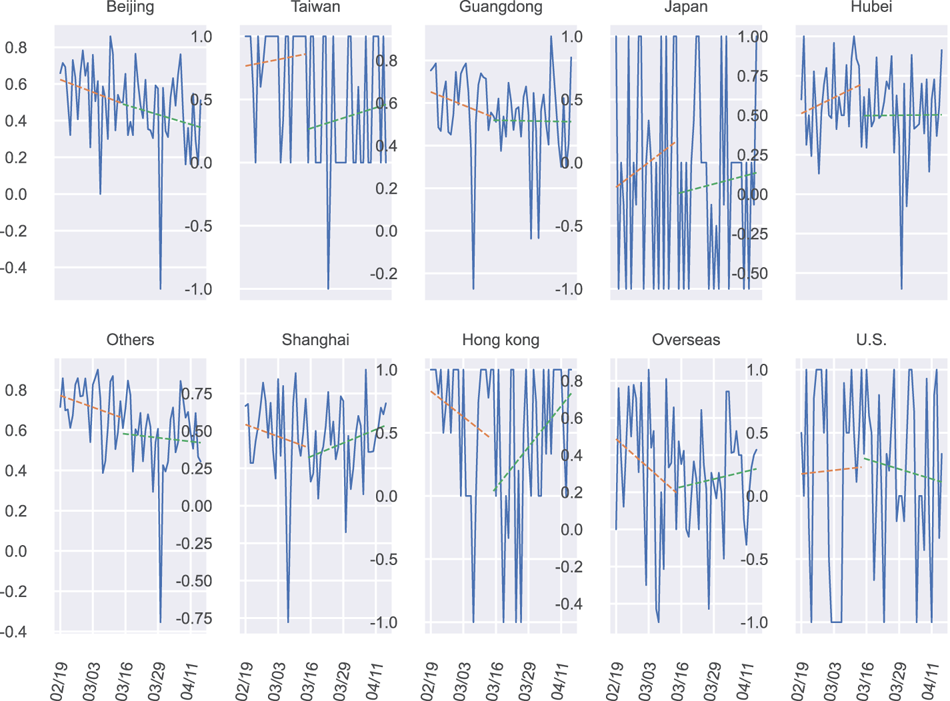
Fig. 11. The sentiment index of different regions of stage 2.
Table 3. Regression analysis of stage 2.
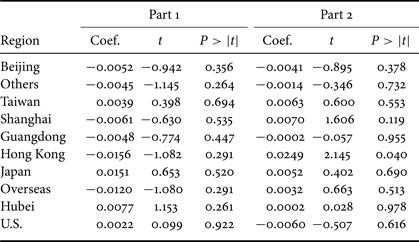
We can make several intuitive observations from Fig. 11. (1) There is no significant pattern to show that the sentiment of these regions changed over time. (2) An obvious decline can be observed near March 30 in some regions like Beijing and Shanghai. As the hospital fighting event was mentioned in Section B.1. (3) There is a decline near March 7 in several Chinese regions like Shanghai and Guangdong and outside China regions like Overseas and the U.S. Two events can be found near March 7: Xinjia Express Hotel which served as a centralized medical observation point collapsed in Quanzhou, Fujian on March 7. COVID-19 infected Nicola Zingaretti, chairman of Partito Democratico.
3) Public opinion of users of different gender
Considering users of different genders whether their microblogs are positive or negative, there are 25.2% positive and 16.7% negative in stage 1 and 33.0% positive and 6.5% negative in stage 2 for female users. For male users, there are 16.5% positive and 9.9% negative in stage 1 and 16.6% positive and 4.5% negative in stage 2. Most male and female users hold a neutral position and the proportions of positive and negative are close in both stages. What is different is that a higher proportion of male users post neutral microblogs in stage 1. The ratio of male to female microblogs is 78%, which means more microblogs are posted by female. An interesting finding is that in stage 2 the ratio of male to female microblogs is 1.06, which indicates with the development of pandemic, the proportion of microblogs by male users is increasing.
4) Public opinion of users with different age
Only user profiles from stage 2 provide information about their birthdays, allowing us to analyze the users in stage 2 by considering their age. The result is shown in Fig. 12 with a stacked histogram.
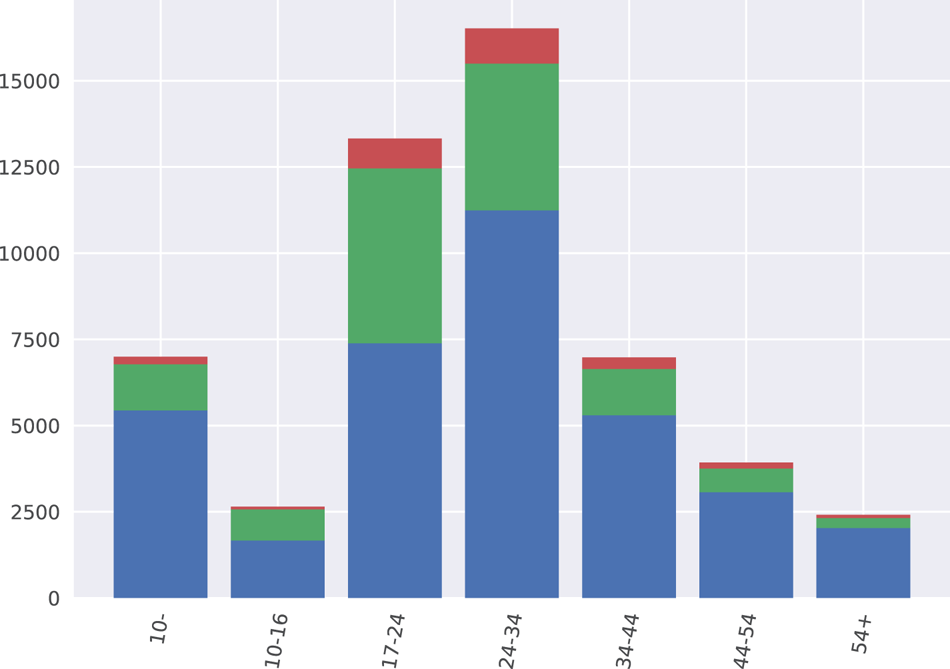
Fig. 12. Sentiment of different users.
Most microblogs were posted by users from 17 to 34, while most of the positive and negative microblogs were posted by them at the same time. Users from 17 to 34 prefer to express their positive and negative opinions.
5) Public opinion of users with different numbers of followers
The follower number is an important indicator of the popularity of a Weibo user. We analyze the relationship with the stacked histograms. Figure 13 shows that the microblogs posted by the users with few followers are more likely to express negative opinions. We discover that the accounts with few followers are always individual accounts. On the other hand, the microblogs posted by the users with a large number of followers are more likely to be neutral and these users are usually official channels like online newspapers. These official channels are intended to deliver news or post announcements, which tend to be neutral under normal conditions.

Fig. 13. Sentiment of different users with different numbers of followers in different stages. (a) Stage 1. (b) Stage 2.
6) Public opinion of users with different authentication
We can use a function called “authentication” in Weibo to obtain the identity for a user. There are several types of authentication in Weibo, including government, enterprise, organization, media, website, and individual. We are also interested in the relationship between the user opinions and the types of user authentication. Only the user profiles from stage 2 provide labels on their homepages, allowing us to rank the users with difference authentication based on frequency. Note that certain authentications is unique, e.g. identification for a specific newspaper. They do not appear in the rank list since there are no users with similar authentications.
The top two types of authentication in the ranking lists of all types of opinions are “headline author” and “entertainment blogger”. Several types of authentication-related micro-media and video creator also achieve high ranks in the ranking list, including “news video micro-media”, “sign Weibo micro-media” and “Weibo original video blogger”. One slight difference between the ranking list of polarity microblogs from the other is that the users identified with “entertainment blogger” rank higher.
7) Public opinion of users with different educational background
Few users provide their educational background. We filter the educational background of a specific user by searching keywords like “high school student” in the brief introduction of their profiles. With the stacked histogram shown in Fig. 14, we can find that microblogs with the higher educational backgrounds are more likely to be negative in stage 2 considering polarity.
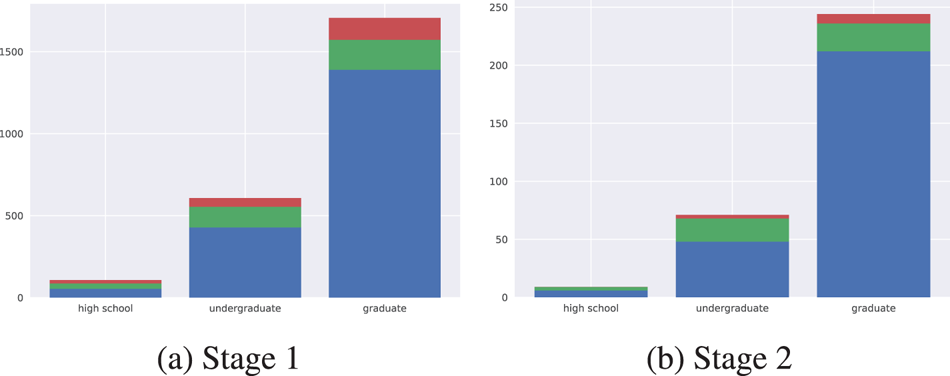
Fig. 14. Sentiment of different users in different stages. (a) Stage 1. (b) Stage 2.
V. SPECIFIC TOPICS
A) China and the U.S.-related microblogs
China and the U.S. are two regions of high interest. We first make an analysis of the volume of microblogs related to the two topics on different stages. It is shown that 11.5% microblogs discussing China and 0.9% microblogs discussing the U.S. on stage 1 and on stage 2 there are 14.9% microblogs for China and 8.4% for the U.S. We can see a significant increase in the proportion of microblogs discussing U.S. comparing different stages of the COVID-19 pandemic.
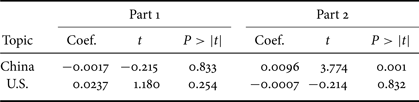
The Sentiment Indices of the microblogs from January 1 to February 18 discussing China and the U.S. are shown in Fig. 15 and the regression statistics are shown in Table 4. We can make several intuitive observations: (1) In general, the public attitude toward China was more positive than toward the U.S. (2) During part 1, the public opinion on U.S. was fluctuating and slumped after January 21.
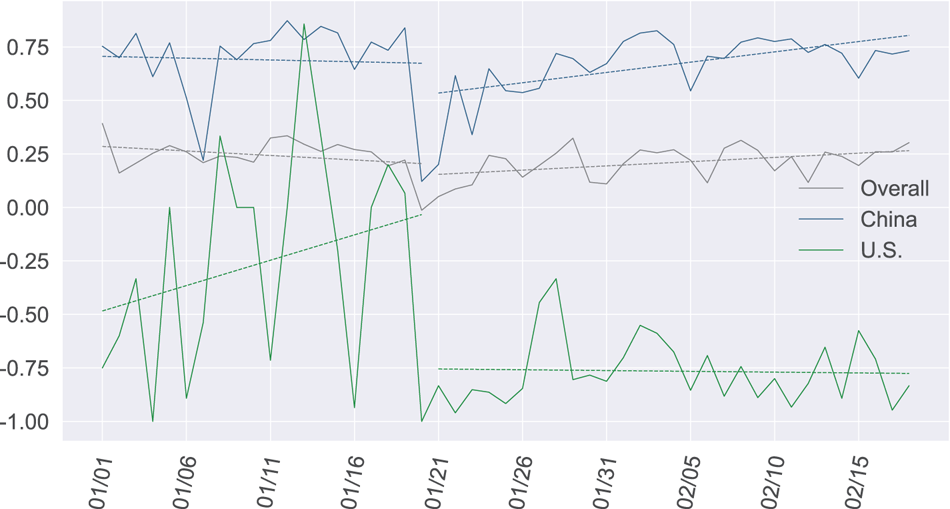
Fig. 15. The sentiment index on China and the U.S. in stage 1.
Table 4. Regression analysis on the public opinion of China and the U.S. during stage 1.
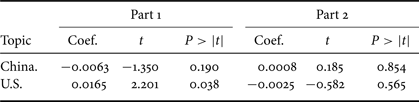
The Sentiment Index and corresponding regression statistics on microblogs from February 19 to April 15 discussing the China and U.S. are shown in Fig. 16 and Table 5. It is shown that public opinion on the China is similar to the overall opinion on the pandemic, while the public attitude toward the U.S. is below them.
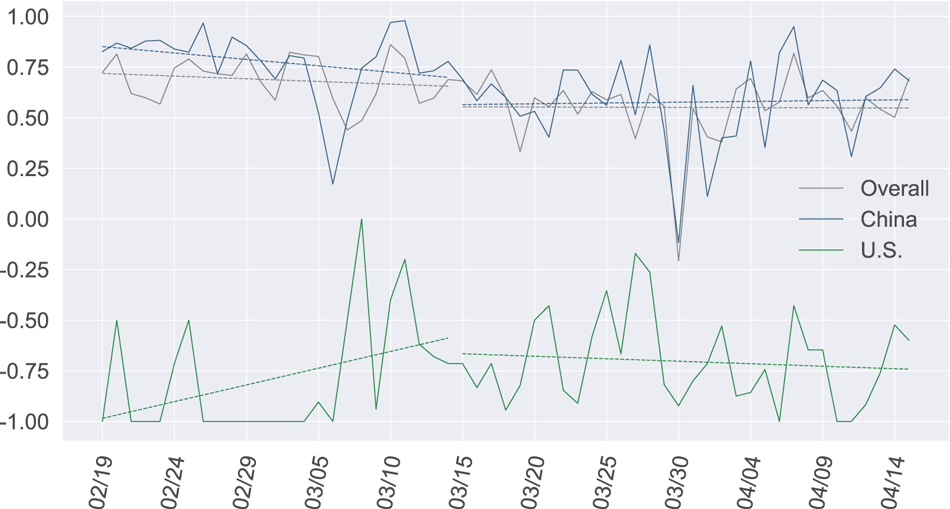
Fig. 16. Sentiment Index on China and the U.S. in stage 2.
Table 5. Regression analysis on the public opinion of China and the U.S. during stage 2.
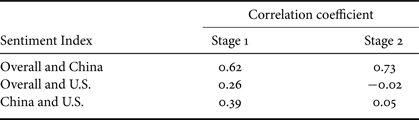
We further validate the relationship between the public opinion on China, the U.S., and overall public opinion with Pearson correlation coefficients and the results are shown in Table 6. The highest correlations are achieved by overall and China in stage 2 and we can find satisfactory results on overall and China in both stages. In addition, it is noticeable that the coefficient between the microblogs of China and the U.S. in stage 1 is 0.39.
Table 6. The correlation coefficient on the sentiment indices of different topics.
We also provide an analysis of the opinion on China and the U.S. by considering the regions of users. Figures 17 and 18 show the results of sentiment proportions in different regions. Considering the microblogs about China, only Japan holds a similar number of positive and negative microblogs. When it comes to the microblogs about the U.S. in Fig. 18, there are more negative microblogs than positive microblogs in most regions.
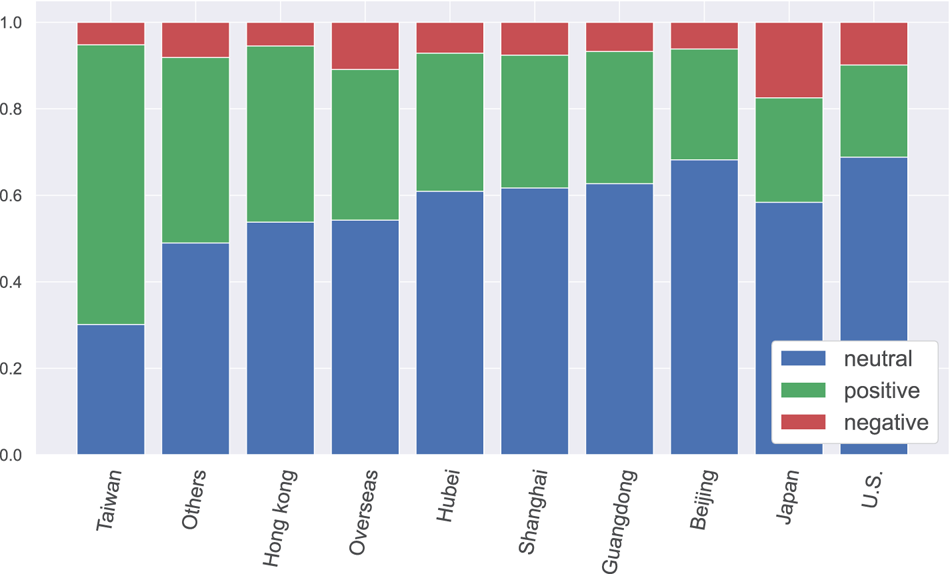
Fig. 17. Sentiment on the China-related microblogs in different regions.
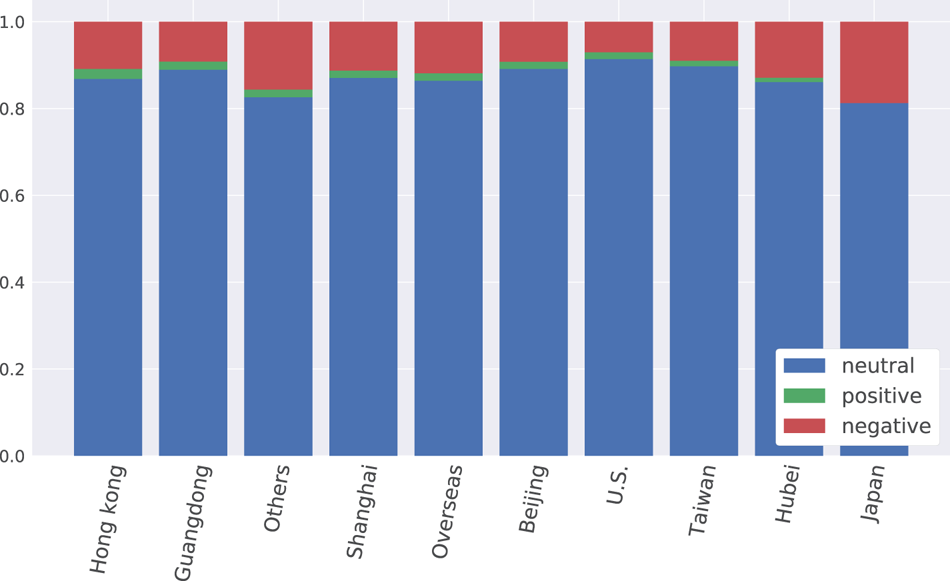
Fig. 18. Sentiment on the U.S.-related microblogs in different regions.
In addition, we provide further analysis on Chinese government-related and U.S. government-related microblogs. Since the volume of government-related microblogs is not enough to make an analysis based on time, we provide a direct analysis of the volume. Based on the statistics, the Sentiment Index in all stages for the topic “China” is $0.69$ and for the topic “U.S.” is $-0.72$
 , and the Sentiment Index on microblogs directly mentioning “Chinese government” is $0.09$
 and that for “U.S. government” is $-0.96$
 . It is shown that most microblogs show a negative attitude toward the U.S. and U.S. government, which means the public opinions on them are consistent. In contrast, there is a significantly higher proportion of negative microblogs of the Chinese government than China.
B) Term usage
There are different types of terms referring to COVID-19 by users. For example, controversial expressions that connect region and virus such as “China virus” and “U.S. virus” are used during the pandemic. We show the usage of different terms during different stages of the pandemic in Figs 19 and 20 “China Virus” refers to China-related COVID-19 terms and “U.S. Virus” refers to U.S.-related COVID-19 terms. Some terms like “Wuhan Virus” can sometimes be a part of “Wuhan Institute of Virology” in Chinese, etc. It is clear that the “U.S. virus” was used more in stage 2. Considering the Sentiment Index on the different topics of the two stages, the “China virus” is $-0.50$ and $-0.68$
 . When it comes to “U.S. virus”, the Sentiment Index in stage 2 is $-0.89$
 .
.
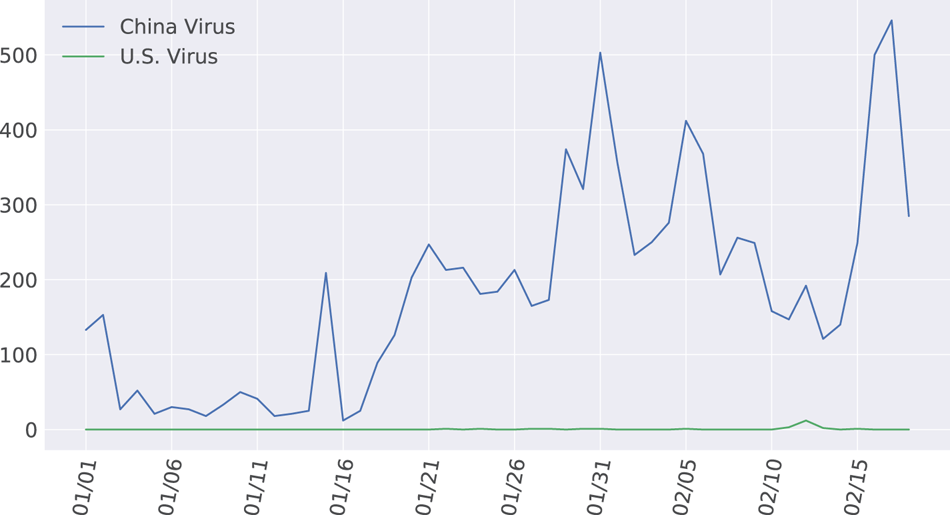
Fig. 19. Term usage during stage 1.
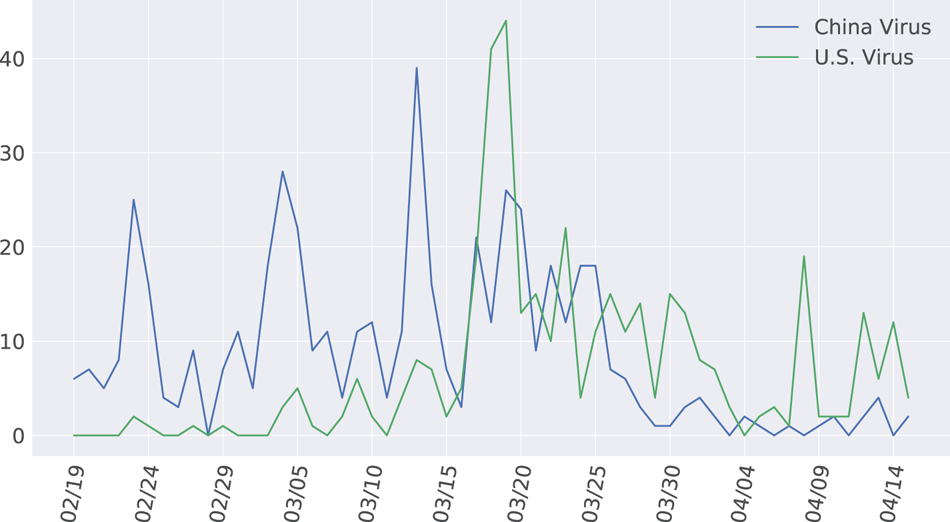
Fig. 20. Term usage during stage 2.
That means the Chinese public expressed negative sentiment when using these terms in general. Also, some peaks were influenced by the China–U.S. relationship. For example, on March 19 the CNN reporters noticed that the “corona virus” in the U.S. President's speech was manually changed to the word “Chinese virus”, an immediate reaction by using “U.S. virus” can be observed near March 19.
C) Daily life during the COVID-19 pandemic
In this part, we discuss some topics about daily life during the COVID-19 pandemic: staying at home, washing hands, disinfection, quarantine, mask, online learning, live streaming, vaccine, and going out. We will discuss the similarities and differences between them, and some of the properties are shown in Figs 21–38.
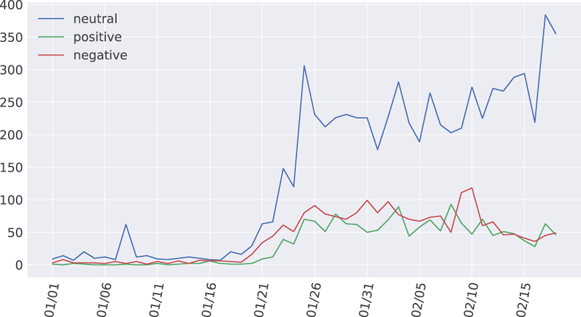
Fig. 21. Number of microblogs on staying at home in stage 1.
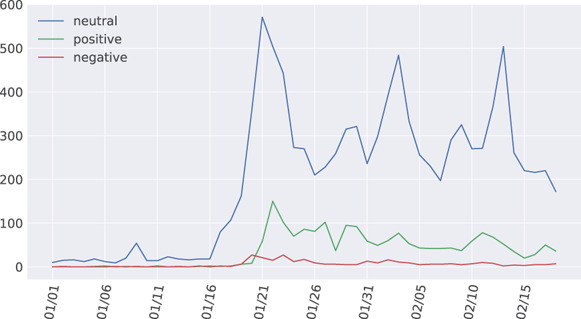
Fig. 22. Number of microblogs on washing hands in stage 1.
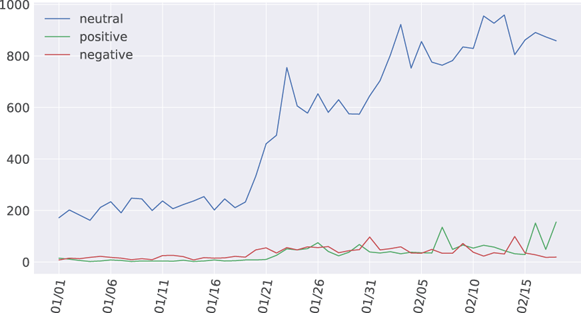
Fig. 23. Number of microblogs on disinfection in stage 1.
Fig. 24. Number of microblogs on staying at home in stage 2.
Fig. 25. Number of microblogs on washing hands in stage 2.
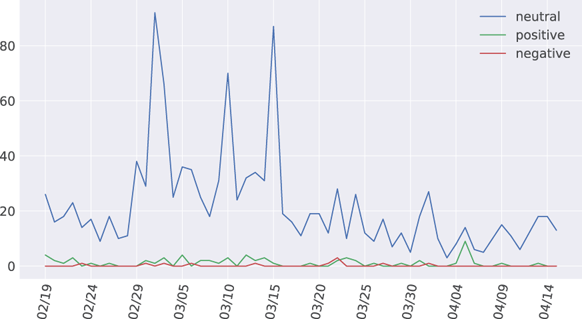
Fig. 26. Number of microblogs on disinfection in stage 2.
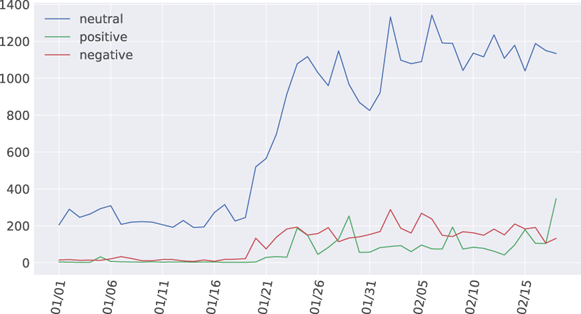
Fig. 27. Number of microblogs on quarantine in stage 1,
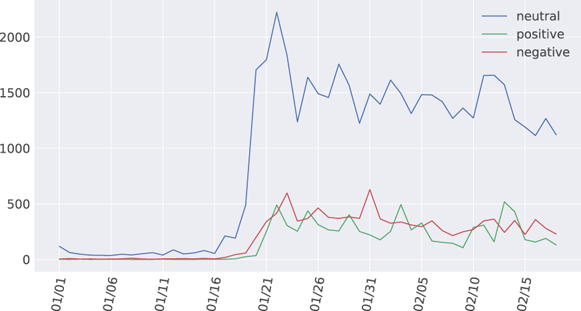
Fig. 28. Number of microblogs on mask in stage 1,
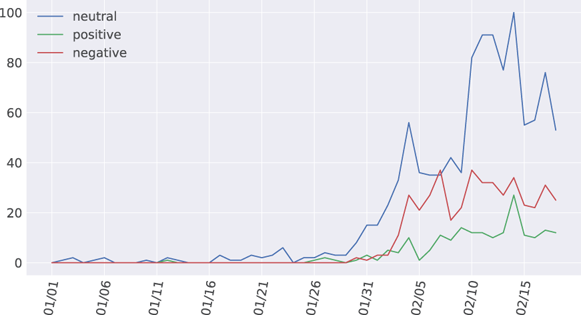
Fig. 29. Number of microblogs on online learning in stage 1.
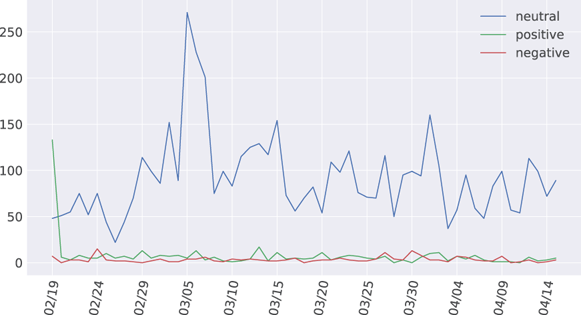
Fig. 30. Number of microblogs on quarantine in stage 2.
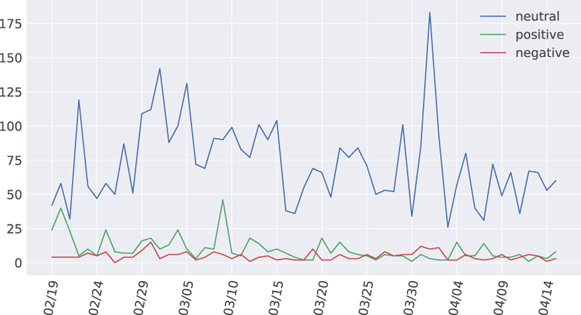
Fig. 31. Number of microblogs on mask in stage 2.
Fig. 32. Number of microblogs on online learning in stage 2.
1) General observations
We observe that there is an increasing discussion increased near January 21. The main reason is that COVID-19 was officially announced to be human-to-human transmissible on January 20, and there would be a quarantine of the Great Wuhan region beginning on January 23. Therefore, the period around January 21 is the key time span when discussions on different aspects of daily life influenced by COVID-19 picked up, except for online learning.
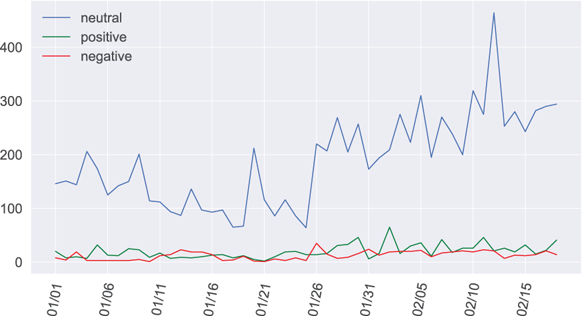
Fig. 33. Number of microblogs on live streaming during stage 1.
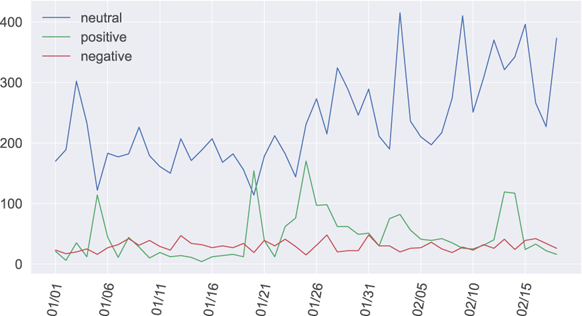
Fig. 34. Number of microblogs on vaccine during stage 1.
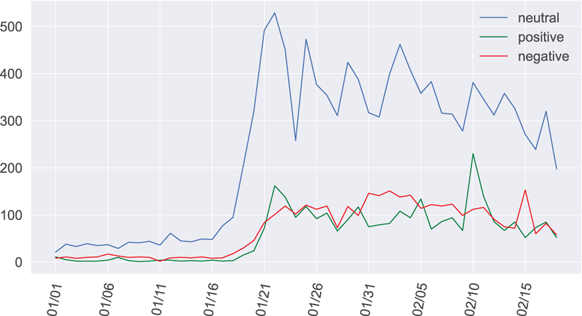
Fig. 35. Number of microblogs on going out during stage 1.
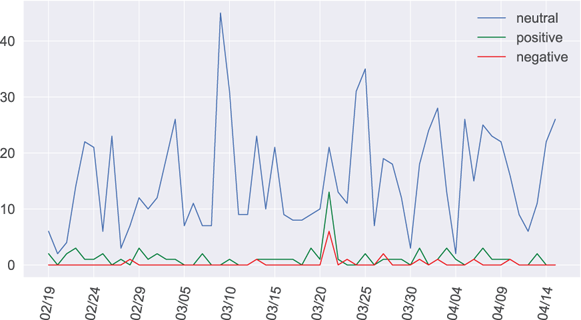
Fig. 36. Number of microblogs on live streaming during stage 2.
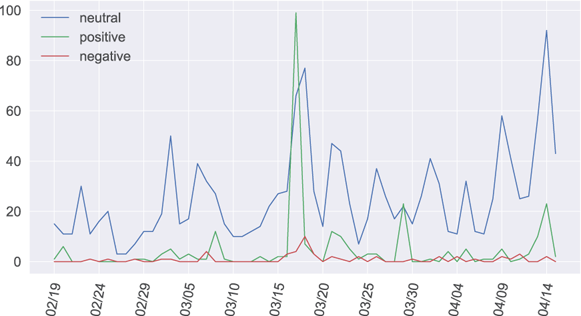
Fig. 37. Number of microblogs on vaccine during stage 2.
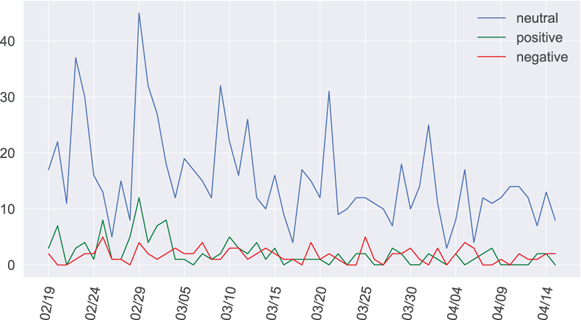
Fig. 38. Number of microblogs on going out during stage 2.
Some peaks that appeared in stage 2 are also shared among different topics from February 29 to March 15. There are several key events during this period: On February 29, the U.S. reported the first death case of COVID-19; on March 10, the confirmed cases in the U.S. increased to 1000; and On March 13 Trump issued the social distancing policy.
Besides, some activities within the Weibo platform also caused the user's discussions. For example, people may post a microblog with the content of “Don't party, go out less, wash your hands and wear masks! I am using $\#$ Weibo avatar pendant$\#$
 , to fight the pandemic together, let's start from wearing a mask” and so on. Such slogans may cause people's discussions on Weibo.
As for sentiment trend, most of the microblogs show neutral opinion, and the numbers of positive and negative microblogs are similar from the general opinion, except for washing hands in Fig. 22 and online learning in Fig. 29.
2) Staying at home
There is an obvious peak on January 25 as shown in Fig. 21. On January 25, discussions like “Cooking failures when staying at home” were widely posted on Weibo.
3) Quarantine
On March 3, 11 new imported COVID-19 cases were reported in Gansu Province.
4) Mask
Hubei plans to request emergency support of masks and other medical supplies around January 22. In addition, with the increasing demand for masks, people started to discuss how to buy masks which may bring panic to the Weibo community.
5) Online learning
February 3 is the first workday after the Spring Festival, student started to discuss online learning. There are some posts like “$\#$ Do not start online teaching before officially announced school opens$\#$
 ” around February 04. Several provinces confirmed to delay the start of school around February 14.
6) Washing hands
Peter Navarro posted warnings again about COVID-19 in the memorandum on February 3. Those microblogs related to promoting washing hands and other measures to prevent infection contribute to the community's positive attitude toward the epidemic.
7) Disinfection
Disinfection is discussed widely since January 1. Quarantine, vaccine, live streaming, and disinfection are four topics that had been concerned by public from January 1. Most of the peaks of disinfection are similar to other topics.
8) Live streaming
Live streaming is a major way to deliver news and other contents. Experts can publicize epidemic prevention knowledge to the public through live streaming.
9) Vaccine
There are several peaks of positive microblogs about vaccines. For example, on February 25, news about pharmaceutical industries starting research and development for combating COVID-19 was reposted. On February 13 and 14, many bloggers posted and reposted microblogs that blood from COVID-19 survivors might be used for severe patients in the absence of effective vaccines. On March 17, protein vaccines by academician Chen Wei's team was announced with clinical trial approval. On April 14, the first batch of COVID-19 inactivated vaccines obtained clinical trial approval.
10) Going out
The number of microblogs related to going out is influenced by the slogan in Section 1, which is in line with washing hands and other habits. On March 21, Chinese football player Wu Lei is confirmed to be infected by COVID-19 and warned people to go out less.
D) Interactions
Interactions play an important role in social media network. The number of interactions attracted by a microblog reflects the popularity of the blogger and microblog itself. In this section, we focus on the interactions related to microblogs in stage 2.
1) Overall statistics
We conduct statistical analysis of interactions (comments, likes, and reposts) on Weibo and provide a histogram in Fig. 39 with log-scale $y$ axis and $x$
 axis with 100-length intervals. Due to the limited space, microblogs with more than 4000 interactions are marked with 4000+ in Fig. 39. It is shown that interactions of most COVID-19-related microblogs are distributed in 0–100, which is intuitive in that most microblogs do not attract much attention. Another conclusion we can draw from the analysis is that most users express their interaction with likes rather than reposts or comments.
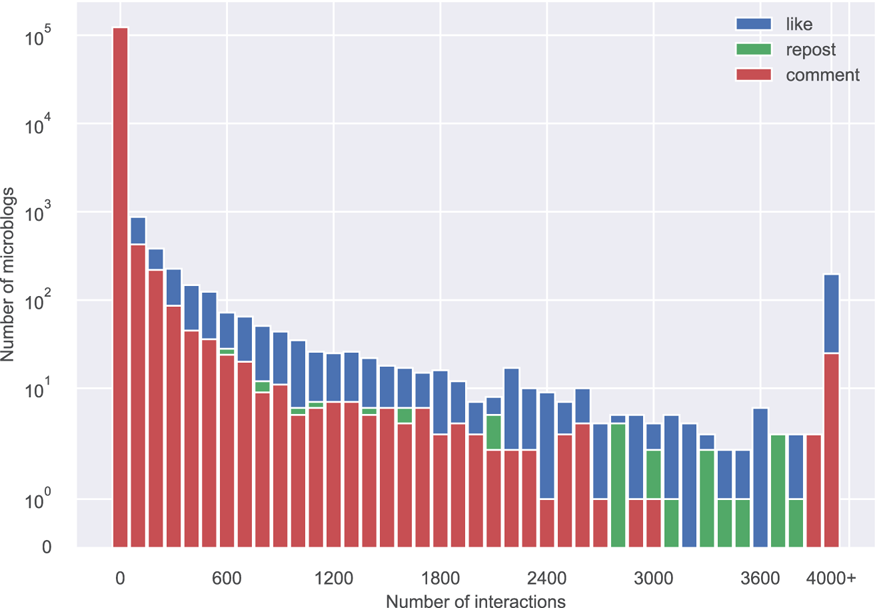
Fig. 39. Interactions in stage 2
We are also interested in the relationship between opinions and interactions. The histograms in Figs 40–42, show the relationship between sentiments and different types of interactions. Two observations can be directly made: (1) similar to the observations in Sections 1 and B), there are more neutral microblogs than positive and negative microblogs; (2) popular microblogs are more likely to be neutral and rare microblogs with many comments or reposts tend to express a negative sentiment; and (3) more of the microblogs with a large amount of reposts are positive than neutral. Compared with comments and reposts, some microblogs with a large number of likes express negative opinions. One possible reason is that clicking the like button incurs a less effort by the users than writing a comment or reposting to his/her timeline, which can also explain why users tend to interact by likes more often.
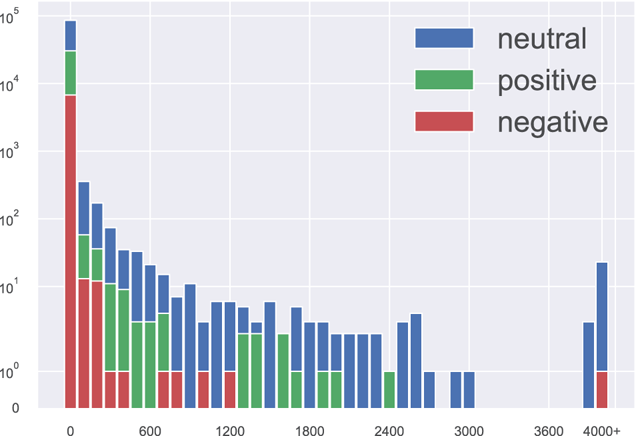
Fig. 40. The relationship between comments and opinions in stage 2.
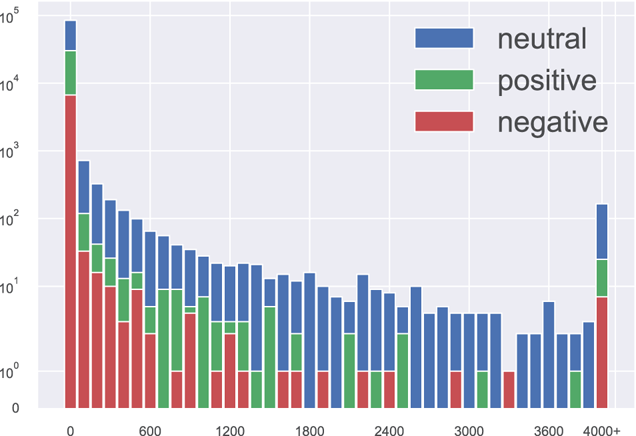
Fig. 41. The relationship between likes and opinions in stage 2.
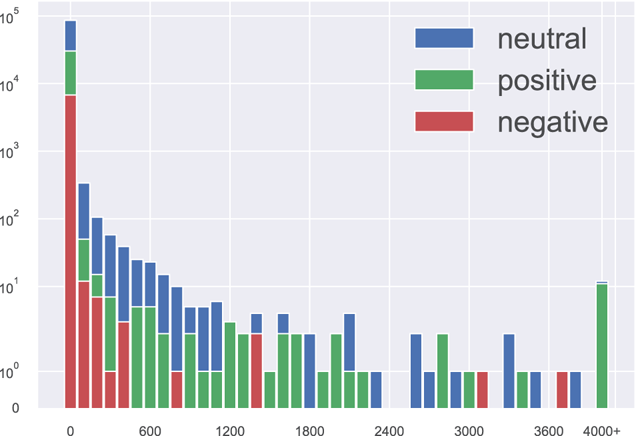
Fig. 42. The relationship between reposts and opinions in stage 2.
2) Opinion in comments
Different from likes or repost, opinions shown in comments can be agreement or disagreement. We first compare the sentiment index of microblogs and comments during stage 2. There are some similarities and differences between the curves as shown in Fig. 43. The regression coefficients (coeff.) and t-statistics (t) of comments are as follows: (1) Part-1. $coef.= -0.0056; t=-1.097; P>|t|:0.284$ ; and (2) Part-2. $coef.= -0.0025 ; t=-0.702; P>|t|:0.488$
 . In general, the overall trends of comments and microblogs are similar, while comments are more negative and extreme than microblogs themselves. The Pearson correlation coefficient of the two curves is $0.365$
 . On April 4, the Qingming Festival of China, people paid their homage to heroes fighting COVID-19 and encouraged each other during the pandemic.
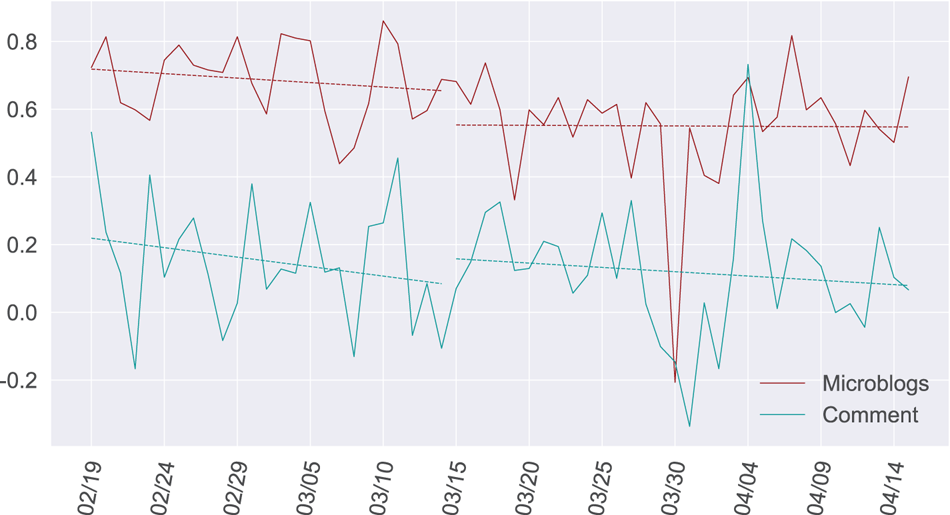
Fig. 43. Sentiment index of comments and microblogs in stage 2.
Furthermore, the relationship between the sentiment of microblogs themselves and their comments is interesting. It is interesting to know whether positive microblogs attract positive comments. Figures 44–46 show the statistics about the hypothesis. We find that positive microblogs do attract a higher proportion of positive comments than negative and neutral microblogs, while the same is also true for negative microblogs. Several additional observations can be driven: (1) for positive microblogs, the more number of comments they attract, the higher proportion of positive comments they have; (2) there are fewer positive comments for negative microblogs with more comments; and (3) for neutral microblogs, the proportions of positive and negative comments are similar.
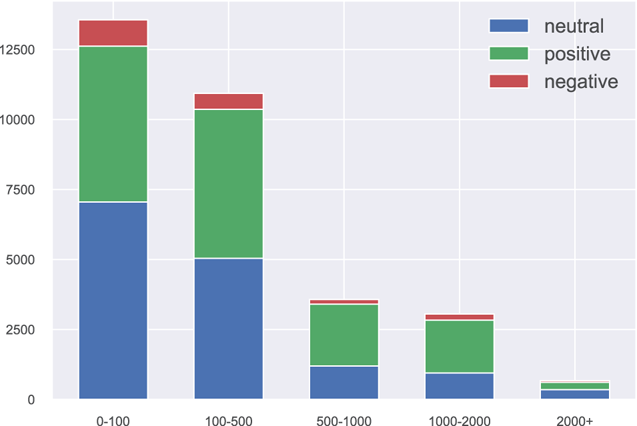
Fig. 44. The relationship between positive microblogs sentiment and their comments sentiment in stage 2.

Fig. 45. The relationship between negative microblogs sentiment and their comments sentiment in stage 2.
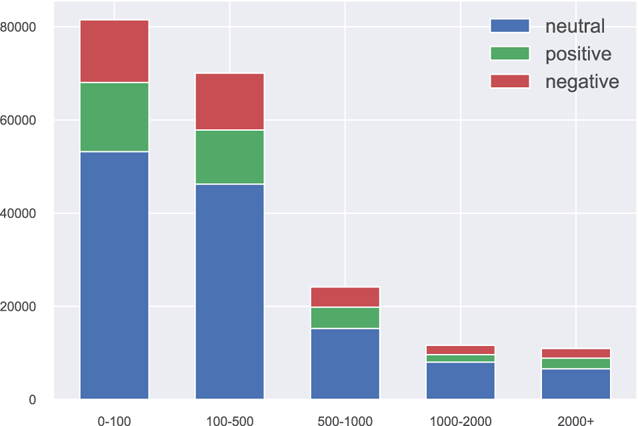
Fig. 46. The relationship between neutral microblogs sentiment and their comments sentiment in stage 2.
VI. CONCLUSION
We track the public opinion on Weibo during different stages of the pandemic. Through the analysis of extensively collected data, we find several factors that may influence the discussions on social media and public opinion: (1) Different stages of the COVID-19 pandemic. It is clear that in different stages of the pandemic, the public opinion varied. For example, the discussions on COVID-19 increased significantly when COVID-19 was officially announced human-to-human transmissible. (2) Policies. Major policies during the pandemic may ignite conversation, such as the Wuhan lockdown. (3) China–US relationship. Use of “Chinese virus” by the U.S. President caused heated discussions. (4) Infected celebrities. The news that the Chairman of Partito Democratico was infected gave rise to many microblogs about COVID-19 in Italy. (5) User-generated topics about daily life during the pandemic. For example, a hashtag about cooking at home during the pandemic was widely used. (6) Comments. The opinions of microblogs and comments might be quite inconsistent. With this work, we provide a multi-faceted data analysis on the public opinion during different stages of the COVID-19 pandemic along a multitude of dimensions. We hope more detailed analyses can help understand the public reactions and prepare the public and governments for a prolonged COVID-19 pandemic or future pandemics.
Yuqi Gao is a Ph.D. student in University of Rochester. He received the bachelor's degree and master's degree in software engineering from Nanjing University in 2017 and 2020 respectively. His research interests include social multimedia computing and web data mining.
Hang Hua is a Ph.D. student in computer science at the University of Rochester. He is currently a member of the VIStA group advised by professor Jiebo Luo. Hang got his master's degree from Peking University and bachelor's degree from the South China University of Technology. His research interests include natural language processing, machine learning, and social media.
Jiebo Luo is a Professor of Computer Science at the University of Rochester which he joined in 2011 after a prolific career of fifteen years at Kodak Research Laboratories. He has authored over 500 technical papers and holds over 90 U.S. patents. His research interests include computer vision,NLP-machine learning, data mining, computational social science, and digital health. He has been involved in numerous technical conferences, including serving as a program co-chair of ACM Multimedia 2010, IEEE CVPR 2012, ACM ICMR 2016, and IEEE ICIP 2017, as well as a general co-chair of ACM Multimedia 2018. He has served on the editorial boards of the IEEE Transactions on Pattern Analysis and Machine Intelligence (TPAMI), IEEE Transactions on Multimedia (TMM), IEEE Transactions on Circuits and Systems for Video Technology (TCSVT), IEEE Transactions on Big Data (TBD), ACM Transactions on Intelligent Systems and Technology (TIST), Pattern Recognition, Knowledge and Information Systems (KAIS), Machine Vision and Applications, and Journal of Electronic Imaging. He is the current Editor-in-Chief of the IEEE Transactions on Multimedia. Professor Luo is a Fellow of ACM, AAAI, IEEE-SPIE, and IAPR.


 Open access