


1. Introduction
Over recent years, the world has seen tremendous growth in the wind energy sector, with the global wind energy production capacity in 2021 standing at nearly 4.5 times the capacity in 2010 (IEA 2022). However, aligning with ambitious net-zero targets still requires a colossal effort to exploit the full potential of wind energy resources through improved design of wind farm layouts as well as individual turbines. Inside a wind farm, the wake produced from one turbine can contribute to significant power losses and fatigue damage to subsequent wind turbines downstream (Vermeer, Sørensen & Crespo Reference Vermeer, Sørensen and Crespo2003; Barthelmie et al. Reference Barthelmie, Frandsen, Nielsen, Pryor, Rethore and Jørgensen2007; Sanderse, Van der Pijl & Koren Reference Sanderse, Van der Pijl and Koren2011; Stevens & Meneveau Reference Stevens and Meneveau2017; Porté-Agel, Bastankhah & Shamsoddin Reference Porté-Agel, Bastankhah and Shamsoddin2020). Therefore, a better understanding of the spatial development of a turbine wake, as well as its dynamic properties, is necessary. With ever-increasing turbine diameter, particularly for offshore turbines, the turbine spacing is no longer a free parameter that can be decided solely based on optimising for total power output; rather, land/area related constraints also become a key factor in designing wind farm layouts (Gaumond et al. Reference Gaumond, Réthoré, Bechmann, Ott, Larsen, Peña and Hansen2012; Lignarolo et al. Reference Lignarolo, Ragni, Ferreira and Van Bussel2016; Howland, Lele & Dabiri Reference Howland, Lele and Dabiri2019). In that regard, studying the near wake of the turbine, where strong coherence is present, becomes particularly important.
The near wake (defined coarsely as the region within 2–4 rotor diameters ( $D$) downstream of the rotor plane) of a wind turbine is multiscale in nature as the flow is forced simultaneously at multiple length scales – for example, by the tower, nacelle, blade tip/root vortices – thereby introducing coherence into the overall wake at multiple time/length scales (Crespo, Hernandez & Frandsen Reference Crespo, Hernandez and Frandsen1999; Abraham, Dasari & Hong Reference Abraham, Dasari and Hong2019; Porté-Agel et al. Reference Porté-Agel, Bastankhah and Shamsoddin2020). Out of these, the most pronounced structures in the near wake are the tip vortices, which follow a helical path in the wake. The dynamics of the tip vortices has been studied extensively through numerous experimental (Sherry et al. Reference Sherry, Nemes, Lo Jacono, Blackburn and Sheridan2013a; Okulov et al. Reference Okulov, Naumov, Mikkelsen, Kabardin and Sørensen2014; Lignarolo et al. Reference Lignarolo, Ragni, Krishnaswami, Chen, Ferreira and Van Bussel2014, Reference Lignarolo, Ragni, Scarano, Ferreira and Van Bussel2015) and numerical (Ivanell et al. Reference Ivanell, Mikkelsen, Sørensen and Henningson2010; Lu & Porté-Agel Reference Lu and Porté-Agel2011; Sarmast et al. Reference Sarmast, Dadfar, Mikkelsen, Schlatter, Ivanell, Sørensen and Henningson2014; Hodgkin, Laizet & Deskos Reference Hodgkin, Laizet and Deskos2022) studies, as well as through stability analysis and a dynamical system's framework (Widnall Reference Widnall1972; Gupta & Loewy Reference Gupta and Loewy1974; Delbende, Selçuk & Rossi Reference Delbende, Selçuk and Rossi2021). The stability analysis of Widnall (Reference Widnall1972) showed the presence of three different instability modes of a single helical vortex filament: a short-wave mode, a long-wave mode and the mutual inductance mode. Gupta & Loewy (Reference Gupta and Loewy1974) further extended the work for a multi-bladed rotor. A pictorial demonstration of each of the instability types can be found in figure 6 of Widnall (Reference Widnall1972). Among these modes, the dominant mode is the mutual inductance mode where the neighbouring filaments attempt to roll up around one another (Widnall Reference Widnall1972; Felli, Camussi & Di Felice Reference Felli, Camussi and Di Felice2011; Sherry et al. Reference Sherry, Nemes, Lo Jacono, Blackburn and Sheridan2013a; Brown et al. Reference Brown, Houck, Maniaci, Westergaard and Kelley2022). The growth of this mode, and ultimately the break up process of the helical vortices, depends on several factors, such as the pitch of the vortex system and the strength of the vortex filaments, as well as the nature of disturbances introduced (Sherry et al. Reference Sherry, Nemes, Lo Jacono, Blackburn and Sheridan2013a; Okulov et al. Reference Okulov, Naumov, Mikkelsen, Kabardin and Sørensen2014; Quaranta, Bolnot & Leweke Reference Quaranta, Bolnot and Leweke2015; Quaranta et al. Reference Quaranta, Brynjell-Rahkola, Leweke and Henningson2019). For a given blade design, the pitch and strength of the vortex system depend on the tip speed ratio $\lambda$, defined as $\lambda = \omega R/U_{\infty }$, where $R$ is the turbine radius, $\omega$ is the rotational speed, and $U_{\infty }$ is the freestream velocity. Disturbances to the vortices can be introduced through blade imperfections (such as radial and axial/azimuthal displacement of blade tips relative to each other, or a slight change in pitch), due to wind turbine geometry such as the tower and due to freestream turbulence.
Depending on the blade configuration, distinct root vortices can also form near the root region of the blade (Sherry et al. Reference Sherry, Nemes, Lo Jacono, Blackburn and Sheridan2013a). However, they are much less persistent in comparison to the tip vortices, whose dynamics and breakdown are particularly important to initiate the recovery of the turbine wake. Medici (Reference Medici2005) noted that the tip vortex system in the near field acts as a shield, restricting the exchange of mass and momentum with the outer, background fluid. Lignarolo et al. (Reference Lignarolo, Ragni, Scarano, Ferreira and Van Bussel2015) showed that there was a net kinetic energy entrainment into the wake only after the tip vortices broke down. Hence breakdown of the tip vortices is a necessary process to re-energise the wake in the far field, reducing the velocity deficit, which is beneficial for the subsequent turbines in the grid. In the presence of freestream turbulence, the tip vortices were found to break down early, leading to faster wake recovery (Chamorro & Porté-Agel Reference Chamorro and Porté-Agel2009; Wu & Porté-Agel Reference Wu and Porté-Agel2012; Gambuzza & Ganapathisubramani Reference Gambuzza and Ganapathisubramani2023).
Chamorro et al. (Reference Chamorro, Hill, Morton, Ellis, Arndt and Sotiropoulos2013) studied the performance of a hydrokinetic turbine in a turbulent open channel flow, and showed a coupling between the spectral content of the turbine's performance and the low-frequency content of the inflow turbulence. They also found a dominant frequency in the far wake ( $x/D>4$). The corresponding Strouhal number based on $D$ and $U_{\infty }$ was $\approx 0.28$. The authors associated this frequency with wake meandering. Here, wake meandering is defined as the large transverse displacements of the wake centreline (which can be defined roughly as the location of maximum velocity deficit) in the far-wake region. Similarly, in a flow containing negligible freestream turbulence, Okulov et al. (Reference Okulov, Naumov, Mikkelsen, Kabardin and Sørensen2014) found a single dominant Strouhal number ${\approx }0.23$ in the far wake (which they defined as the streamwise distance $x > 2.5D$). They also reported that the Strouhal number was nearly independent of operating conditions. A similar Strouhal number in the range 0.15–0.4 has been noted in several other works (Medici & Alfredsson Reference Medici and Alfredsson2008; Chamorro et al. Reference Chamorro, Hill, Morton, Ellis, Arndt and Sotiropoulos2013; Foti et al. Reference Foti, Yang, Campagnolo, Maniaci and Sotiropoulos2018; Heisel, Hong & Guala Reference Heisel, Hong and Guala2018) and has been associated with wake meandering. Although the dominance of wake meandering in the far wake has been known for many years, the scientific community still holds varied opinions about the genesis of the meandering motion in the far wake. For instance, wake meandering has been seen as a passive advection of the turbine wake due to large-scale atmospheric structures (Larsen et al. Reference Larsen, Madsen, Thomsen and Larsen2008; Espana et al. Reference Espana, Aubrun, Loyer and Devinant2011). In contrast, Okulov et al. (Reference Okulov, Naumov, Mikkelsen, Kabardin and Sørensen2014) observed wake meandering when the freestream turbulence level was negligible. They proposed that wake meandering could be related to the instability of the shed vortices and connected it to the slow precession motion of the helicoidal vortex system. On a similar note, the importance of the nacelle in the generation of wake meandering was reported through experiments (Howard et al. Reference Howard, Singh, Sotiropoulos and Guala2015), linear stability analysis (Iungo et al. Reference Iungo, Viola, Camarri, Porté-Agel and Gallaire2013) and numerical simulations (Kang, Yang & Sotiropoulos Reference Kang, Yang and Sotiropoulos2014; Foti et al. Reference Foti, Yang, Guala and Sotiropoulos2016, Reference Foti, Yang, Campagnolo, Maniaci and Sotiropoulos2018). The large eddy simulations of Foti et al. (Reference Foti, Yang, Campagnolo, Maniaci and Sotiropoulos2018) showed that wake meandering is related to the slow precession motion of the helical hub vortex formed behind the nacelle. The authors suggested that the hub vortex grows radially and interacts with the outer wake, which potentially can augment wake meandering. Howard et al. (Reference Howard, Singh, Sotiropoulos and Guala2015) reported different scalings for the hub vortex and the wake meandering. They also argued that wake meandering is a rotor scale instability that depends on the velocity deficit and hence the turbine's operating condition. The initial perturbation to the instability can come either from the rotor itself, for example from the nacelle, or from freestream turbulence. There is growing evidence that wake meandering in a utility-scale turbine can be influenced by several factors, including the turbine's operating condition, turbine geometry and inflow turbulence (Heisel et al. Reference Heisel, Hong and Guala2018; Mao & Sørensen Reference Mao and Sørensen2018; Gupta & Wan Reference Gupta and Wan2019). Nevertheless, a thorough understanding of the cause of wake meandering remains elusive, which is perhaps indicated by the ineludible scatter of Strouhal numbers associated with wake meandering observed in different studies (Medici & Alfredsson Reference Medici and Alfredsson2008). The distance from the rotor plane, where a wake meandering frequency has been observed, has also varied in different studies. For instance, Chamorro et al. (Reference Chamorro, Hill, Morton, Ellis, Arndt and Sotiropoulos2013) found wake meandering after only three rotor diameters, whereas Okulov et al. (Reference Okulov, Naumov, Mikkelsen, Kabardin and Sørensen2014) reported the presence of a wake meandering frequency as close as $1.5D$ from the rotor (see figure 6 of Okulov et al. Reference Okulov, Naumov, Mikkelsen, Kabardin and Sørensen2014), where they found small variation in the frequency for different operating conditions. Medici & Alfredsson (Reference Medici and Alfredsson2008) reported a similar observation at one diameter downstream of the rotor, and concluded that the wake meandering frequency varied with both tip speed ratio and the thrust coefficient of the rotor. In the present study, we attempt to address some of these discrepancies through extensive laboratory experiments on a model wind turbine.
We perform a series of particle image velocimetry (PIV) experiments to study the near wake of a wind turbine at a range of tip speed ratios, while focusing primarily on  $\lambda =4.5$ and $6$. The wind turbine model had a nacelle and tower to imitate a real wind turbine as closely as possible within laboratory scale constraints. We report four main results. (a) The spatial region over which different frequencies are dominant in the near field varies drastically with $\lambda$. We introduce a length scale termed the ‘convective pitch’ that depends on $\lambda$ (and hence the spatial unfolding of the tip vortices), and show that it could be a better length scale than turbine diameter ( $D$) to demarcate the near wake. (b) The freestream turbulence intensity for the experiments was negligible ( ${\approx }1\,\%$); however, we still observed wake meandering. The Strouhal number of wake meandering decreased with tip speed ratio ( $\lambda$). (c) The wake meandering frequency is found to be present even very close to the nacelle, upholding the notion that the nacelle is important to ‘seed’ wake meandering. (d) The tower acts as an important source of asymmetry, resulting in a downward bending of the mean wake centreline, and increased turbulence and mixing in the lower plane.
2. Experimental method
A series of PIV experiments were performed on a small-scale wind turbine model in the hydrodynamics flume in the Department of Aeronautics at Imperial College London. At the operating water depth, the flume has cross-section  $60\times 60\ {\rm cm}^2$. A schematic of the model wind turbine is shown in figure 1, designed to mimic the design of an actual wind turbine to the closest extent possible while satisfying several experimental constraints. The diameter of the model was restricted to 20 cm to keep the blockage low (8.7 % based on turbine diameter, which is comparable to blockages encountered in previous experimental studies; Sherry et al. Reference Sherry, Nemes, Lo Jacono, Blackburn and Sheridan2013a; Miller et al. Reference Miller, Kiefer, Westergaard, Hansen and Hultmark2019). The freestream velocity ( $U_{\infty }$) was kept constant at $0.2\ {\rm m}\ {\rm s}^{-1}$. The freestream velocity profile was uniform across the rotor, and the incoming turbulence intensity ( $T_i$) was approximately $1\,\%$ (see Appendix A for details). The global Reynolds number $Re_D$ (based on turbine diameter $D$ and $U_{\infty }$) was 40 000, which is several orders of magnitude smaller than the Reynolds number at which actual wind turbines operate. Standard wind turbines operate at a high chord-based Reynolds number ${\sim }10^6$ (see figure 1 of Lissaman Reference Lissaman1983), and at such $Re$, standard aerofoils operate at high maximum lift to drag ratio $O(100)$, which is impossible to achieve in a small-scale model (for which the chord-based $Re_c$ is barely ${\sim }9000$ here) unless a pressurised facility is used to tailor the density of the incoming flow (Miller et al. Reference Miller, Kiefer, Westergaard, Hansen and Hultmark2019). Accordingly, there is inherently a Reynolds number mismatch of the order of 100. It is not well understood how the spatio-temporal properties of the wake scale from a lab-scale model wind turbine to a full-scale turbine; however, a faster expansion of the wake has been observed upon increasing the Reynolds number (McTavish, Feszty & Nitzsche Reference McTavish, Feszty and Nitzsche2013; Bourhis et al. Reference Bourhis, Pereira and Ravelet2023). Not only in the wake, Howard & Guala (Reference Howard and Guala2016) showed that the velocity reduction in the upwind induction zone could also be different in a utility-scale turbine, quoting the Reynolds number as one of the possible reasons.

Figure 1. A schematic of the wind turbine model and the fields of view used in the different experiments. The streamwise distance  $x$ is measured from the rotor plane, and transverse distances $z$ and $y$ are measured from the nacelle centreline. (a) Experiments 1A–1C focused on the plane aligned with the tower's axis and streamwise direction, i.e. the $xy$ plane. (b) The front view of the wind turbine model. The planes of different experiments are shown as lines. (c) Experiments 2 and 3 focused on $xz$ planes at different $y$ offsets.
At  $Re_c \sim 10^4$, thin flat plate aerofoils perform better than standard thicker smooth aerofoils (McMasters & Henderson Reference McMasters and Henderson1980; Sunada, Sakaguchi & Kawachi Reference Sunada, Sakaguchi and Kawachi1997; Hancock & Pascheke Reference Hancock and Pascheke2014; Winslow et al. Reference Winslow, Otsuka, Govindarajan and Chopra2018). Thus a flat plate aerofoil with thickness ratio $5\,\%$ and camber ratio $5\,\%$ was initially chosen for the blade, which gives the best performance at low Reynolds number ( $Re \sim 4 \times 10^3$) (Sunada et al. Reference Sunada, Sakaguchi and Kawachi1997). However, the blades were found to be incapable of sustaining the structural loads under the present experimental conditions, hence the thickness ratio was increased to $10\,\%$ for more structural rigidity. The chord and twist distributions of the blades were similar to those used by Hancock & Pascheke (Reference Hancock and Pascheke2014). Near the root section, the blade was linearly interpolated to a circular section that was fixed to the hub. A large number of experiments were conducted at a range of tip speed ratios ( $\lambda$) in the range $4.5\leq \lambda \leq 6.9$, with two main tip speed ratios 4.5 and 6. The turbine operated at close to optimal conditions at $\lambda =6$, and at a sub-optimal condition for $\lambda =4.5$ (see Appendix A for details).
The nacelle was represented as a cylindrical body of diameter 3.3 cm and length 4.9 cm. A hollow cylindrical tower of outer diameter 2.1 cm was attached to the nacelle. The tower was attached at the top to a mounting frame, and the wind turbine model was hung in an inverted fashion in the flume. A stepper motor RS 829-3512 was used along with a drive and signal generator to rotate the turbine at a prescribed RPM. The motor, along with the speed controlling electronics, was located outside the flume, and the torque from the motor was transmitted to the turbine shaft via a belt and pulley mechanism. The pulley and the shaft were placed inside the nacelle, and the belt ran through the hollow tower, which restricted any further reduction in the diameter of the nacelle or tower. Note that in multi-megawatt turbines, the nacelle diameter is often  ${<}5\,\%$ of the rotor diameter, and the tower diameter is ${\approx }3\,\%$ of the rotor diameter (Desmond et al. Reference Desmond, Murphy, Blonk and Haans2016). The design constraints in our experimental model, however, resulted in a nacelle diameter to rotor diameter ratio $16.5\,\%$, and tower diameter to rotor diameter ratio $10.5\,\%$. Indeed, in small-scale models used in laboratory experiments, it is not often possible to have a nacelle and tower with shape and size exactly similar to full-scale turbines. For instance, Howard et al. (Reference Howard, Singh, Sotiropoulos and Guala2015) and Chamorro et al. (Reference Chamorro, Hill, Morton, Ellis, Arndt and Sotiropoulos2013) had a nacelle to turbine diameter ratio ${\approx }9\,\%$, and Pierella & Sætran (Reference Pierella and Sætran2017) and Barlas, Buckingham & van Beeck (Reference Barlas, Buckingham and van Beeck2016) had a nacelle ${\approx }13\unicode{x2013}14\,\%$ of the rotor diameter. On the other hand, some studies had a nacelle much longer than usual (Okulov et al. Reference Okulov, Naumov, Mikkelsen, Kabardin and Sørensen2014; Pierella & Sætran Reference Pierella and Sætran2017). Pierella & Sætran (Reference Pierella and Sætran2017) had tower diameter $11.7\,\%$ of the turbine diameter. Akin to these studies, although the effect of the nacelle and tower could be overestimated with respect to a utility-scale turbine in the present experiments, important inferences can be drawn that can aid the understanding of the wake physics of wind turbines, and rotors more generally.
Three different experimental campaigns, named campaigns 1–3, were conducted to capture different regions and properties of the flow. The details of the experiments can be found in table 1 and figure 1. In campaign 1, four different experiments were conducted in the plane of symmetry aligned with the tower axis ( $z=0$). The first experiment in campaign 1 (henceforth referred to as 1A) focused on the region $0\leq y/D \leq 0.85$, measured from the symmetry line. Three Phantom v641 cameras were used to obtain a stitched field of view (FOV) spanning $0.25 \leq x/D \leq 3.45$ in the streamwise direction. Similarly, experiment 1B focused on the region $-0.85 \leq y/D \leq 0$, which contains the wake region of the tower. The third experiment (1C) covered the central region, $-0.42 \leq y/D \leq 0.43$. Experiments 1A–1C were conducted only for the two main tip speed ratios $\lambda =4.5$ and $6$. Experiment 1D had a FOV similar to experiment 1A but was run for five tip speed ratios, different to the two main tip speed ratios (see table 1 for details). In experimental campaign 2, two Phantom v641 cameras were used simultaneously to capture the near wake ( $0.29 \leq x/D \leq 1.95$) in the $xz$ plane. Experiment 2A focused on the symmetry plane ( $\,y=0$), while experiment 2B focused on an offset plane ( $\,y=-0.35D$) such that some influence from the tower wake is captured. All the parameters associated with the different experiments are tabulated in table 1. For experiments 1 and 2, each camera captured images (of dimension $2560\ {\rm px}\times 1600\ {\rm px}$) in double-frame single-exposure mode at acquisition frequency $f_{aq}= 100\ {\rm Hz}$, which was found to be adequate to resolve all scales of dynamic importance for the present study. Data were obtained for a total time ( $T$) of more than $54\ {\rm s}$ (corresponding to ${\approx }77$ turbine rotations for $\lambda =4.5$) for experiments 1 and 2, respectively.
Table 1. Parameters associated with the different experiments. Here,  $\delta x$ represents the spatial resolution of the experiments, and $f_{aq}$, $\delta t$ and $T$ are the acquisition frequency, time between successive laser pulses, and total time of data acquisition, respectively. Field of view is abbreviated as FOV.

The objective of campaign 3 was to obtain the wake meandering frequency accurately. Only one camera was used for each experiment, and the FOV was shrunk into a thin strip of dimension  $2560\ {\rm px} \times 256\ {\rm px}$ (see figure 1c), which facilitated obtaining a large time series of data ( $900\ {\rm s}$, which is close to 180 wake meandering cycles) within the memory constraints of the camera. The tip speed ratio was varied slowly from 4.5 to 6 in increments of 0.1. The acquisition frequency was reduced to $10\ {\rm Hz}$, and the time between successive laser pulses ( $\delta t$) was kept fixed at $0.01\ {\rm s}$ for all experiments. The fields of view of the experiments were centred at $x=2D$, $3D$ and $5D$, as shown in figure 1. The images acquired were processed in PIVlab (Thielicke & Stamhuis Reference Thielicke and Stamhuis2014). The adaptive cross-correlation algorithm in PIVlab used a multi-pass, fast Fourier transform to determine the average particle displacement. An initial interrogation area $64\times 64$ pixels was reduced in three passes, with a final interrogation area size $16\times 16$ pixels with 50 % overlap in the $x$ and $y$ directions. The spatial resolutions ( $\delta x$) of the experiments were close and were approximately 1.64–2.07 mm (see table 1). The smallest scales of dynamic importance in the near field, i.e. the tip vortex cores, were found to span ${\approx }6\,\delta x$. Since the interrogation windows had a $50\,\%$ overlap, meaning that adjacent vectors in the velocity fields were spaced $\delta x/2$ apart, the tip vortex cores spanned $\approx$12 PIV vectors. Accordingly, all scales of dynamic importance are believed to be resolved adequately.
3. Results and discussion
3.1. Instantaneous vorticity field
Figures 2(a) and 2(b) show instantaneous vorticity fields at  $\lambda = 4.5$ and $6$ in the $xy$ ( $z=0$) plane. Note that the fields of view from experiments 1A and 1B are stitched together for visual representation, but they were not acquired concurrently. The flow fields in figure 2 are inherently complex and contain several length/time scales (see also supplementary movies 1 and 2 available at https://doi.org/10.1017/jfm.2023.1095). In the top plane (experiment 1A), the array of the tip vortices can be seen that acts as a boundary between the wind turbine wake and the freestream. We can also see trailing sheet-like vortices shed along the span of the blade (Abraham et al. Reference Abraham, Dasari and Hong2019). For
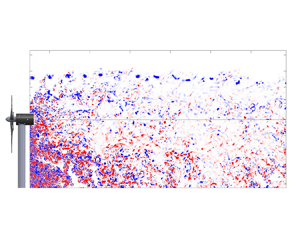
  $\lambda =4.5$, the tip vortices shed from the three blades start interacting after a streamwise distance $x/D \approx 2$, and initiate the merging process (see supplementary movie 1). Until $x/D \approx 2$, the wake boundary remains nearly horizontal, or in other words, in the presence of the tip vortices, the wake does not expand in the very near field. It supports the observation of Medici (Reference Medici2005) and Lignarolo et al. (Reference Lignarolo, Ragni, Scarano, Ferreira and Van Bussel2015), who noted that the tip vortices in the near field act as a shield to prevent mixing with the outer fluid. Beyond $x/D \approx 2$, the interaction and merging of the tip vortices aid wake expansion and wake recovery. For $\lambda =6$, the turbine operates at a higher thrust coefficient (see Appendix A) leading to stronger tip vortices that are more closely spaced (due to higher rotational speed). This results in an earlier interaction and merging (see supplementary movie 2) of the tip vortices (Felli et al. Reference Felli, Camussi and Di Felice2011; Sherry et al. Reference Sherry, Nemes, Lo Jacono, Blackburn and Sheridan2013a).

Figure 2. Instantaneous vorticity fields of a wind turbine wake for (a)  $\lambda =4.5$ and (b) $\lambda =6$, in the $xy$ plane. Fields of view from experiments 1A and 1B (at different time instants) are stitched together for a visual representation of the entire wake.
In the lower plane (experiment 1B), the vorticity field looks drastically different from the top plane. The tip vortices in the lower plane interact with the tower's vortex shedding, which increases the vorticity levels significantly. Note that vortices are shed from the tower in an oblique fashion. Such an oblique nature of vortex shedding from the tower was also reported by De Cillis et al. (Reference De Cillis, Cherubini, Semeraro, Leonardi and De Palma2021) through numerical simulations. Several factors can lead to oblique vortex shedding from the tower, such as the strongly sheared inflow condition (Silvestrini & Lamballais Reference Silvestrini and Lamballais2004) caused by the rotor and finite-span effects of the tower near the nacelle (Williamson Reference Williamson1996). It has been shown that the presence of shear or end effects can lead to oblique vortex shedding, which can promote three-dimensionality in the wake (Williamson Reference Williamson1996; Silvestrini & Lamballais Reference Silvestrini and Lamballais2004). Such oblique three-dimensional vortex shedding from the tower can be observed clearly in supplementary movies 1 and 2 (shown by a blue arrow). Interestingly, upward bursts of turbulent fluid are observed from around the wake centreline at several instances. These are shown by white arrows in supplementary movies 1 and 2. The origins of these bursts are not clearly understood yet. They are most likely related to the complex three-dimensional vortex shedding from the tower and its interaction with the nacelle's vortex shedding. However, it should be kept in mind that the effect of the tower/nacelle could be more pronounced in the present experiments than for utility-scale turbines due to the relatively large size of the tower and nacelle. Nevertheless, the flow field shown in figure 2 is qualitatively similar to that observed in an actual turbine (see figure 7 of Abraham et al. Reference Abraham, Dasari and Hong2019). Abraham et al. (Reference Abraham, Dasari and Hong2019) utilised natural snowfall to visualise the wake of a utility-scale turbine in the symmetry plane ( $xy$ plane according to the present nomenclature) and showed that the flow structures in the lower plane were significantly more chaotic and distorted due to the presence of the tower. Hence we believe that the present experiments replicate the wake of an actual turbine well in spite of the geometric dissimilarities and inherent Reynolds number difference.
Figure 3 shows the instantaneous vorticity fields in the  $xz$ plane at different $y$ offsets for $\lambda =4.5$ and 6 (experiment 2). At the symmetry plane (figures 3a,b), the evolution of the tip vortices and trailing sheet vortices looks similar to that obtained from experiment 1A (see supplementary movies 3 and 4). Figures 3(c,d) show the vorticity field at an offset (experiment 2B) from the nacelle. The central region of the wake shows an oscillatory behaviour (see supplementary movies 5 and 6) that was not pronounced in the symmetry plane in experiment 2A. It is evident that this oscillation results from the vortex shedding of the tower that interacts with the vortices shed from the blades. From supplementary movies 5 and 6, it can be seen that the vortex shedding pattern from the tower is not perfectly regular as it interacts with the regular passage of trailing sheet vortices. Note that the wakes in figure 3 appear to be deflected slightly towards the side $z>0$. Such asymmetric expansion of the wake was also observed by (Howard et al. Reference Howard, Singh, Sotiropoulos and Guala2015). Due to the rotation of the turbine, the wake rotates in the opposite sense (Medici & Alfredsson Reference Medici and Alfredsson2006). The turbine of Howard et al. (Reference Howard, Singh, Sotiropoulos and Guala2015) rotated in a anticlockwise sense when viewed from the upwind side. They found the wake to be slightly deflected in a negative $z$ direction (following our nomenclature). Our turbine rotated in a clockwise sense, and we observe a deflection in the opposite, positive $z$ direction. However, there could also be a non-negligible contribution from slight experimental misalignment of the rotor plane with the freestream direction.

Figure 3. Instantaneous vorticity fields of a wind turbine wake in the  $xz$ ( $\,y=0$) plane for (a) $\lambda =4.5$ and (b) $\lambda =6$. (c,d) The vorticity fields at an offset plane ( $\, y=-0.35D$) for $\lambda = 4.5$ and 6, respectively.
3.2. Mean velocity field
We show the mean velocity deficit ( $\Delta U/U_{\infty }$, where $\Delta U = U_{\infty } - U$) profiles at different streamwise distances for the two different tip speed ratios in figure 4. The plots are shown only in the $xy$ plane (experiment 1). A Gaussian curve (black dashed lines) is fitted to the mean velocity deficit profiles corresponding to $\lambda =6$ for comparison. Close to the turbine, in the upper plane, five inflection points are observed (figure 4a). We know that the mean velocity/velocity deficit profiles in the wake of a single-scale bluff body contain only one inflection point on each side of the wake. The existence of multiple inflection points in the wake of the wind turbine essentially shows its multiscale nature. Baj & Buxton (Reference Baj and Buxton2017) observed mean velocity profiles of a similar nature in the near wake of a multiscale array of prisms having unequal widths. Note that the qualitative natures of the wake deficit profiles are similar for both tip speed ratios considered. In the upper plane, at $x/D=0.5$, there is an inflection point at $y/D \approx 0.1$ (shown by a $\times$ symbol), which corresponds to the wake of the nacelle. The other inflection point, corresponding to the nacelle's wake, is present below the symmetry line ( $\,y=0$), but inflection points are shown only for the upper plane ( $\,y>0$). The second pair of inflection points, shown by red dots, occurs at $0.2< y/D<0.4$. These inflection points appear most likely due to the sheet-like vortices shed from the blades as seen in figures 2 and 3. The third pair of inflection points (shown by $+$ symbols) occurs at $y/D\approx 0.5$ and corresponds to the tip vortices. The first inflection point is the least spatially persistent (until $x/D \approx 1$), indicating a small spatial extent of the nacelle wake, while the other inflection points are observed further downstream due to the persistent nature of the vortices shed from the blades. Note that such inflection points in wake profiles have also been observed in previous studies (Yang, Sarkar & Hu Reference Yang, Sarkar and Hu2012; Lignarolo et al. Reference Lignarolo, Ragni, Scarano, Ferreira and Van Bussel2015). If observed carefully, five inflection points can be observed in the Yang et al. (Reference Yang, Sarkar and Hu2012) data as well (see the curve corresponding to $\lambda =4.5$ in figure 4 of Yang et al. Reference Yang, Sarkar and Hu2012); however, the curvature of the mean velocity profile was much milder as the experiments were conducted inside a turbulent boundary layer. Additionally, based on the design of the turbine, a separate pair of inflection points may or may not be observed for the blade wake and nacelle wake. Alternatively, there could be one combined wake of the two, forming a single pair of inflection points, which we see further downstream (from $x/D=1.5$) in our case (see figure 4).

Figure 4. Mean velocity deficit at (a)  $x/D = 0.5$, (b) $x/D = 1.0$, (c) $x/D = 1.5$, (d) $x/D = 2.0$, (e) $x/D = 2.5$, and (f) $x/D = 3.0$, for $\lambda = 4.5$ and $6$. The black dashed lines represent a Gaussian fit to the mean velocity deficit profiles corresponding to $\lambda =6$.
Important observations can be made if we compare the mean velocity deficit profiles with standard wake models used in industry. Standard models like Jensen (Reference Jensen1983) or Frandsen et al. (Reference Frandsen, Barthelmie, Pryor, Rathmann, Larsen, Højstrup and Thøgersen2006) assume that the velocity deficit has a symmetric top hat shape. Although the aim of these models is not to produce the correct wake profile, the discrepancy between the assumed wake profile and the actual wake profile in figure 4 should be noted. The far-wake model proposed by Bastankhah & Porté-Agel (Reference Bastankhah and Porté-Agel2014) assumes a Gaussian distribution of the velocity deficit profile, which is a more realistic assumption but still has its limitations. As can be seen from figure 4, even at  $x/D = 3$, the wake deficit profile is not exactly Gaussian. Sharp gradients exist near the wake edge as coherent tip vortices are still present. In the presence of freestream turbulence, however, the wake profile approaches a Gaussian nature earlier (see Wu & Porté-Agel Reference Wu and Porté-Agel2012; Vahidi & Porté-Agel Reference Vahidi and Porté-Agel2022), leading to a better agreement with the model. Another important thing to note is that the wake centreline, defined as the location where the velocity deficit is maximum, drifts from the geometric centreline ( $\,y=0$) towards $y<0$. This downward drift in the mean wake centreline is caused by the asymmetry induced by the turbine tower (Pierella & Sætran Reference Pierella and Sætran2017). Such asymmetry in the wake is not accounted for in the aforementioned models in use.
3.3. Important frequencies
The temporal fluctuation in the wake of a wind turbine is important as that determines the nature of the fluctuating loads induced on downstream turbines exposed to the wake of the wake-producing machine. Due to the inherent multiscale nature of the wake, multiple frequencies can be expected to characterise the wake dynamics. Let us first identify the important frequencies towards the outer edge of the wake for different tip speed ratios. For that, we introduce a length scale, which we term convective pitch,  $L_c$, and define it as $L_c={\rm \pi} D/\lambda$. This length scale can be interpreted physically as the distance travelled by a fluid element at velocity $U_{\infty }$ in the time taken for the rotor to complete one full rotation. Note that $L_c$ is not exactly the same as the pitch of the tip vortices as the tip vortices propagate at a velocity slightly smaller than the freestream velocity. For the present configuration, $L_c = 0.70D$ and $0.52D$ for $\lambda = 4.5$ and 6, respectively. We evaluate fast Fourier transforms at selected points (shown by $+$ symbols in figure 2) based on the fluctuating transverse velocity component, and show them in figure 5. The Strouhal number $St_C$ is calculated based on $U_{\infty }$ and $L_c$. Figures 5(a) and 5(e) show the transverse velocity spectra at $x/L_c = 1$ for $\lambda = 4.5$ and $6$, respectively. Apart from an energetic low-frequency region near the nacelle ( $\,y\approx 0$), a number of distinct frequencies are observed that are close to integer multiples of $St_C$. These frequencies and their relative strengths can be observed more clearly from figures 5(b) and 5(f) (for $\lambda = 4.5$ and $6$, respectively), which show the frequency spectra at $x/L_c=1$ and $y/D=0.55$, i.e. near the outer wake. Note that the spectra look qualitatively similar for both tip speed ratios. Here, the dominant frequency is $St_C \approx 3$, which corresponds to the blade passing frequency (henceforth denoted as $3f_r$, where $f_r$ is the rotor frequency). This similarity holds up the possibility to demarcate the very-near field of the turbine wake (where the influence of the blade passing frequency is significant) based on the convective pitch $L_c$, which we discuss further in § 3.3.1. Although the dominant frequency is the same for both $\lambda$ values at this location, there are subtle differences in the spectra. In particular, for $\lambda =6$, the rotor frequency $f_r$ ( $St_C \approx 1$), as well as other harmonics of $f_r$, are more pronounced compared to $\lambda =4.5$. Comparing figures 2(a) and 2(b), we can see that for $\lambda =6$ at $x/L_c=1$, there is a waviness at the edge of the wake that, owing to the early merging process for $\lambda =6$, is not present at $x/L_c=1$ for $\lambda =4.5$. This wavy nature has frequency $f_r$. As a result, $f_r$ and its harmonics are much stronger in the near field for $\lambda =6$.

Figure 5. Transverse velocity spectra obtained at  $x/L_c=1$ for (a) $\lambda =4.5$ and (e) $\lambda =6$. (b,f) The same at $x/L_c=1$, $y/D=0.55$ for the two tip speed ratios. (c,g) The spectra at $x/L_c=4$ for $\lambda = 4.5$ and $\lambda = 6$, respectively. (d,h) The corresponding spectra at $x/L_c=4$, $y/D=0.55$. Strouhal numbers $St_C$ and $St_D$ are defined based on $L_c$ and $D$ as the length scale, and $U_{\infty }$ as the velocity scale.
The difference between the two tip speed ratios becomes more significant in the far field, as can be seen from figures 5(c) and 5(g), which show the transverse velocity spectra at  $x/L_c = 4$. Clearly, $f_r$ is much stronger for $\lambda =6$ here. The corresponding spectra at $x/L_c=4$ and $y/D=0.55$ are shown in figures 5(d) and 5(h). It can be seen that the blade passing frequency ( $3f_r$) is no longer dominant. For $\lambda =4.5$, the dominant frequency is $2f_r$, while the strengths of the $f_r$ and $2f_r$ peaks are similar. For $\lambda =6$, however, $f_r$ is by far the dominant frequency at this location, which implies that the merging process for $\lambda =6$ is different from that for $\lambda =4.5$. The presence of both rotor frequency and blade passing frequency has been reported previously in the near wake (Felli et al. Reference Felli, Camussi and Di Felice2011; Chamorro et al. Reference Chamorro, Hill, Morton, Ellis, Arndt and Sotiropoulos2013; Okulov et al. Reference Okulov, Naumov, Mikkelsen, Kabardin and Sørensen2014; Toloui, Chamorro & Hong Reference Toloui, Chamorro and Hong2015). Different modes of tip vortex merging have been reported in experiments (Felli et al. Reference Felli, Camussi and Di Felice2011; Sherry et al. Reference Sherry, Nemes, Lo Jacono, Blackburn and Sheridan2013a) and theory (Widnall Reference Widnall1972). The merging process is known to be driven primarily by mutual inductance of the tip vortices, and it has been shown to depend on vortex strength, vortex core size and pitch of the vortices (Widnall Reference Widnall1972). In addition, disturbances from the freestream or rotor geometry, such as slight imperfections in the blade construction, can influence the merging and breakdown of the tip vortices (Ivanell et al. Reference Ivanell, Mikkelsen, Sørensen and Henningson2010; Toloui et al. Reference Toloui, Chamorro and Hong2015; Abraham & Leweke Reference Abraham and Leweke2023; Ramos-García et al. Reference Ramos-García, Abraham, Leweke and Sørensen2023). The tower is another source of disturbance to the tip vortices, as seen in figure 2 here. Felli et al. (Reference Felli, Camussi and Di Felice2011) and Sherry et al. (Reference Sherry, Nemes, Lo Jacono, Blackburn and Sheridan2013a) argued that the merging of the tip vortices is a two-step process, where two vortex filaments get entangled first and thereafter merge with the third filament further downstream, leading to a single vortical structure. The dominance of $2f_r$ in the far field for $\lambda =4.5$ is believed to be the result of such a two-step merging process. However, this is not very evident from supplementary movie 1, as the vortex cores of the tip vortices for $\lambda =4.5$ are weaker compared to $\lambda =6$, and they get diffused quickly. For $\lambda =6$, the vortex cores are stronger and their separation is shorter, as a result of which there is a stronger and earlier interaction.
By calculating the circulation around the phase-averaged tip vortices, it can be shown that the tip vortices for  $\lambda =6$ are ${\approx }5\,\%$ stronger than those for $\lambda =4.5$, while there is ${\approx }25\,\%$ reduction in separation between the vortices for the higher $\lambda$. From the nature of the Biot–Savart law, which governs the mutual inductance mode, we can vaguely expect the growth of the mode to be directly proportional to the strength of the vortices, and inversely proportional to the square of the separation (Sørensen et al. Reference Sørensen, Mikkelsen, Henningson, Ivanell, Sarmast and Andersen2015). Combining these two facts, we can say that the reduced separation is the main factor for the earlier tip vortex interaction for $\lambda =6$ compared to $\lambda =4.5$ that we observe here. However, note that the growth rate of the mode also depends strongly on the nature of disturbances/asymmetries available or introduced to the system at a given $\lambda$ (i.e. a fixed separation on an average), as dictated by previous works (Quaranta et al. Reference Quaranta, Bolnot and Leweke2015; Brown et al. Reference Brown, Houck, Maniaci, Westergaard and Kelley2022; Abraham, Castillo-Castellanos & Leweke Reference Abraham, Castillo-Castellanos and Leweke2023; Abraham & Leweke Reference Abraham and Leweke2023). Disturbances have been introduced into the system dynamically by changing the frequency or the pitch of the blades (Quaranta et al. Reference Quaranta, Bolnot and Leweke2015; Brown et al. Reference Brown, Houck, Maniaci, Westergaard and Kelley2022), or passively by introducing a small axial/radial displacement to the blade tips (Abraham & Leweke Reference Abraham and Leweke2023; Ramos-García et al. Reference Ramos-García, Abraham, Leweke and Sørensen2023). For instance, Abraham & Leweke (Reference Abraham and Leweke2023) reported that an axial displacement of $0.013D$ in one of the blade's tips reduced the leapfrogging distance by $17\,\%$ at $\lambda =3$ for a three-bladed rotor. We did not have any dynamic forcing on our rotor; however, we observed a small axial displacement of approximately 0.5 mm or $0.0025D$ at the tip of the blades. Note that this is not unexpected, as the tip thickness was quite small ( ${\approx }0.5\ {\rm mm}$) in the present case, unlike works that studied categorically the effects of blade asymmetry using much thicker blades (Abraham & Leweke Reference Abraham and Leweke2023; Ramos-García et al. Reference Ramos-García, Abraham, Leweke and Sørensen2023). The blade eccentricity observed most likely resulted in the tip vortices being of slightly unequal strength, as can be seen from figure 2(b) for $\lambda =6$. For the same reason, for $\lambda =4.5$ in figure 2(a), one of the tip vortices looked slightly different. Note that some degree of eccentricity is inevitable in any experimental set-up, and an asymmetry of around $0.0025D$ is not large. This is particularly evident from the tip vortices being prevalent beyond $x \approx 2D$ for $\lambda =4.5$ for the present case, which is similar to the leapfrogging distance of the baseline case of Abraham & Leweke (Reference Abraham and Leweke2023) for a lower tip speed ratio ( $\lambda =3$), although their Reynolds number was higher. We discuss this further in § 3.3.1.
From supplementary movie 2, it can be noted that for  $\lambda =6$, two tip vortices start revolving around the third tip vortex and eventually merge into a single vortical structure beyond $x/D \approx 1.5$. This hints at a single-step merging process for the tip vortices unlike that observed for $\lambda =4.5$. Therefore, our data lead us to believe that the merging process may or may not be a multistage process as proposed in previous studies (Felli et al. Reference Felli, Camussi and Di Felice2011; Sherry et al. Reference Sherry, Nemes, Lo Jacono, Blackburn and Sheridan2013a). Instead, the process should depend on the tip speed ratio as well as the design of the turbine blades. It can also change with Reynolds number, as that would change the $C_l - C_d$ characteristics of the blade's section aerofoils, hence changing the strength of the tip vortices.
Let us now look at the frequencies near the central region of the wake. For that, we perform fast Fourier transforms at selected points from experiment 2, which are shown by the  $+$ signs in figure 3. The results are shown in figure 6 and are for only $\lambda =6$, as the corresponding results for $\lambda =4.5$ were similar. Hence, unlike figure 5, the Strouhal number is calculated based only on diameter $D$. Figures 6(a) and 6(b) are obtained from experiment 2A ( $\,y=0$ plane) at $x/D=0.5$, $z/D=0$ and $x/D=1.5$, $z/D=0$, respectively. Near the nacelle (figure 6a), the dominant frequency is $St_D=0.42$. Note that the nacelle diameter for this study is close to six times smaller than the rotor diameter. Hence if we use the nacelle diameter to scale the frequency instead, then the Strouhal number is approximately $0.069$. Abraham et al. (Reference Abraham, Dasari and Hong2019) and Howard et al. (Reference Howard, Singh, Sotiropoulos and Guala2015) reported a similar nacelle shedding frequency $St \approx 0.06$ for a utility-scale turbine. Accordingly, we believe that this frequency is related to vortex shedding from the nacelle, and henceforth denote it as $f_n$. Interestingly, away from the nacelle, at $x/D=1.5$, $z/D=0$ (figure 6b), an even lower dominant frequency is observed at $St_D \approx 0.23$. This Strouhal number correlates well with the wake meandering frequencies reported in several previous studies (Chamorro et al. Reference Chamorro, Hill, Morton, Ellis, Arndt and Sotiropoulos2013; Okulov et al. Reference Okulov, Naumov, Mikkelsen, Kabardin and Sørensen2014), and is henceforth denoted as $f_{wm}$. The origin of $f_{wm}$ is discussed in more detail in § 5.

Figure 6. Transverse velocity spectra obtained at (a)  $x/D=0.5$, $z/D=0$, and (b) $x/D=1.5$, $z/D=0$ in the plane $y=0$ (experiment 2A). The same is shown at an offset plane (experiment 2B) at (c) $x/D=0.5$, $z/D=0$, and (d) $x/D=1.5$, $z/D=0$. All the spectra are shown for $\lambda = 6$ only.
Figures 6(c) and 6(d) are obtained from experiment 2B, i.e. at an offset plane ( $\,y=-0.35D$), away from the nacelle and downstream of the tower. In the near wake ( $x/D=0.5$, $z/D=0$, figure 6c), a dominant frequency is found at $St_D \sim 0.8$. We expected that this frequency corresponds to the vortex shedding from the tower, and denoted it as $f_T$. However, upon non-dimensionalisation based on tower diameter ( $d_T$) and $U_{\infty }$, the Strouhal number ( $St_{d_T}$) is found to be around 0.084, which is significantly lower than the expected value $St\approx 0.2$ for vortex shedding from a cylinder in this Reynolds number range (Williamson Reference Williamson1996). We speculate that a combination of two main factors could have resulted in such a reduction in the vortex shedding's Strouhal number. First, note that the Strouhal number was calculated based on freestream velocity. The incoming velocity just ahead of the tower was not measured in the experiments. Nonetheless, we can expect a velocity reduction of ${\approx }20\,\%$ relative to the freestream value as the flow crosses the rotor disk, using the blade element momentum method. Second, the tower is exposed to a complex rotational flow containing frequencies such as $f_r$ and $3f_r$. These factors strongly influence the tower's vortex shedding, which we can see clearly from supplementary movies 5 and 6. Note that a similar reduction in the Strouhal number corresponding to vortex shedding from the upper portion of the tower was also reported recently by De Cillis et al. (Reference De Cillis, Cherubini, Semeraro, Leonardi and De Palma2021).
To demonstrate this further, in Appendix B we show the transverse velocity fluctuation signals just behind the tower from experiment 2B for  $\lambda =6$ and $4.5$, respectively. For $\lambda =4.5$, $St_{d_T}$ reduced slightly to 0.071. It is interesting to note that the shedding frequencies are close to half of the turbine's rotational frequency ( $f_r$). This makes us speculate that there could be a lock on between the tower's vortex shedding frequency and $f_r$, similar to that observed in vortex shedding exposed to oscillatory flows (Barbi et al. Reference Barbi, Favier, Maresca and Telionis1986). Further downstream, at $x/D = 4.5$ (figure 6d), $f_T$ is no longer found to be prominent. The wake meandering frequency is still observed, but is weaker compared to the central plane ( $y=0$), indicating a stronger influence of wake meandering in the central region of the wake.
3.3.1. Frequency maps
Having observed the presence of multiple frequencies in the near field, let us identify the zones in which a particular frequency is dominant. We define the dominant frequency to be that at which the transverse velocity spectrum attains its maximum value at a particular location. For instance, in figures 5(b) and 5(f), i.e. in the near field and in the tip region, the dominant frequency is  $3f_r$, while relatively far from the rotor, near the central region (see figure 6b), it is the wake meandering frequency ( $f_{wm}$) that is dominant. We obtain the dominant frequencies at all the spatial locations, and create a frequency map demarcating zones where a particular frequency is dominant. The dominant frequency map for $\lambda =4.5$ in the $xy$ plane is shown in figure 7.

Figure 7. Zones of dominant frequencies for  $\lambda = 4.5$.
In the top plane, large zones with distinct boundaries are observed where a particular frequency is dominant. Near the rotor in the tip region,  $3f_r$ is dominant until $x/D \approx 2.25$, beyond which $2f_r$ and $f_r$ become important. We thus identify that the merging process initiates at $x/D \approx 2.25$, which correlates well with our earlier observation from the instantaneous vorticity field in § 3.1. At similar $Re$, Sherry, Sheridan & Jacono (Reference Sherry, Sheridan and Jacono2013b) observed merging at $x/D\approx 2.5$ for $\lambda =4$, and at $x/D\approx 1.5$ for $\lambda =5$ (see figure 5 of Sherry et al. Reference Sherry, Nemes, Lo Jacono, Blackburn and Sheridan2013a). Since the merging location that we observe lies between these two values, we can state that our results match well with Sherry et al. (Reference Sherry, Nemes, Lo Jacono, Blackburn and Sheridan2013a) in spite of the differences in turbine design. Sherry et al. (Reference Sherry, Nemes, Lo Jacono, Blackburn and Sheridan2013a) also observed distinct root vortices (having frequency $3f_r$) in the vicinity of the root of the blade. We do observe a small region in the vicinity of the root region where $3f_r$ is dominant (see figure 7); however, root vortices were not observed clearly in the present study, which can be seen from figure 2 (see also supplementary movies 1 and 2). We believe that this is related to the specific design of the blades in the root region that produce only very weak root vortices that are sustained only very briefly. The relatively large size of the nacelle in the present study could also be a factor.
Interestingly, near the root region of the blade, until  $x/D \approx 1.5$, there is a large region where $f_r$ is dominant. Here, $f_r$ is formed most likely due to the merging of the unstable root vortices and the trailing sheet vortices, which can be seen from figures 2(a) and 3(a). Very close to the nacelle, there is a small region of nacelle shedding frequency ( $\,f_n$). Further downstream, a large region is seen where the dominant frequency is close to the tower frequency ( $\,f_T$). However, at this location there were no high-magnitude spectral peaks, so the mode associated with the tower's shedding frequency was identified simply as the dominant frequency in relation to a relatively incoherent region of the flow. Nevertheless, the observation of $f_T$ in the $xy$ plane is interesting, and it indicates the inherent three-dimensionality of the vortex shedding from the tower.
In the lower plane ( $\,y<0$), the tip vortices break down earlier due to their interaction with the tower's vortex shedding. Patches of high-frequency regions can be seen near the tip region in the lower plane, which are the remains of the blade passing or rotor frequencies. Apart from that, a number of other frequencies are also observed, making it look more broadband and turbulent like. The wake meandering frequency ( $\,f_{wm}$) is found to be dominant only near the central region in the near wake. The entire wake looks like a shell of high frequency fluid surrounding the central region dominated by low-frequency dynamics.
The scenario remains qualitatively similar for  $\lambda = 6$, as can be seen in figure 8; however, the streamwise/transverse extents of the dominant zones clearly look different. In the upper plane, the zones where $3f_r$ and $2f_r$ are dominant are quite small, and $f_r$ is dominant in a large portion of the upper plane. From figure 2(b) as well as from supplementary movie 2, we can note that for $\lambda =6$, merging occurs beyond $x/D \approx 1.5$. Sherry et al. (Reference Sherry, Nemes, Lo Jacono, Blackburn and Sheridan2013a) observed merging to occur at a closer distance $x/D \approx 1.2$ for $\lambda =6$ at a similar $Re$. Okulov et al. (Reference Okulov, Naumov, Mikkelsen, Kabardin and Sørensen2014) observed merging of tip vortices at $x/D \approx 1$ for $\lambda =6$, although their Reynolds number was higher. This variability in the merging location could be related to the specific design of the blades and possible blade eccentricities. It also bolsters the fact that the observed blade eccentricity of approximately $0.0025D$ has a relatively small impact on the merging of the tip vortices. Nevertheless, it is safe to say that the specific design of the blades and the presence of any asymmetry in the blades can alter the frequency zones that we observe, especially near the tip shear layer (Abraham & Leweke Reference Abraham and Leweke2023; Ramos-García et al. Reference Ramos-García, Abraham, Leweke and Sørensen2023).

Figure 8. Zones of dominant frequencies for  $\lambda = 6$.
In the lower plane, for  $\lambda =6$, traces of the tip vortices are still observed, but again there are several new frequencies present and it is more broadband. In the central region, wake meandering is dominant again, and the transverse extent of the region where it is dominant grows with downstream distance. In fact, $f_{wm}$ remains dominant over a larger region at $\lambda =6$ compared to $\lambda =4.5$, which shows a possible dependence of wake meandering on the tip speed ratio. This dependence is discussed further in § 5.
Next, we investigate the frequency zones obtained from experiment 2. Figures 9(a) and 9(c) correspond to  $\lambda =4.5$ and $6$ respectively, at the central plane ( $y=0$), and are similar to the upper plane in figures 7 and 8. This offers reassurance that the results of the experiments are reproducible. The wake meandering frequency remains dominant over a larger region for $\lambda =6$ compared to $\lambda =4.5$. The difference between the two tip speed ratios is more pronounced at the offset plane (experiment 2B). For $\lambda =4.5$, the tower frequency ( $\,f_T$) dominates the central part of the wake (see figure 9b). Contrastingly, for $\lambda =6$, $f_T$ has sole dominance only before $x/D \approx 1$, beyond which the strengths of $f_T$ and $f_{wm}$ become comparable. This evidence indicates further that the strength of wake meandering depends on the tip speed ratio. Note that for $\lambda =6$, the wake appears to be slightly deflected towards the side $z>0$ that is most likely related to the rotation of the turbine, which leads to a rotation of the flow in the opposite sense to the blades; a similar asymmetric wake expansion was also shown by Howard et al. (Reference Howard, Singh, Sotiropoulos and Guala2015).

Figure 9. Zones of dominant frequencies for  $\lambda = 4.5$ in the planes (a) $y=0$ and (b) $y=-0.35D$. (c,d) The same for $\lambda =6$.
Let us take a closer look at the streamwise evolution of the ‘strength’ of different frequencies. The ‘strength’ of a frequency can be measured locally by taking the maximum amplitude in the transverse velocity spectra of a particular frequency at a particular streamwise distance, which we denote as  $|a|_{v}$. For instance, in figure 5(g), we see that the signature of the frequency $f_r$ is present over a range of $y$ (from $y/D \approx 0.35$ to $y/D \approx 0.75$) at a particular $x$. However, its amplitude is maximum at $y/D \approx 0.5$ at this $x$ location. We take this maximum value of $f_r$'s amplitude and denote it as the strength of $f_r$ at this particular $x$ location. Similarly, we obtain the spectra at all $x$ points and search for the maxima for each of the frequencies present. In figure 10(a), $|a|_{v}$ is shown over streamwise distance in the upper plane (experiment 1A) for $\lambda = 4.5$. In the near field, the blade passing frequency ( $3f_r$) dominates other frequencies and corresponds to the passage of tip vortices. At $x/D \approx 2.25$, $2f_r$ surpasses $3f_r$, and at $x/D \approx 3.2$, $f_r$ surpasses $2f_r$, which is indicative of the two-step merging process. The higher harmonics are comparatively damped and less important beyond $x/D \approx 1.5$. The wake meandering frequency is observed even very close to the nacelle, and the local strength of the frequency does not change appreciably throughout the domain of investigation.

Figure 10. The evolution of the ‘strength’ of different frequencies with streamwise distance for (a)  $\lambda =4.5$ and (b) $\lambda =6$. The strength is calculated as the magnitude of the largest peak in the spectra of transverse velocity at a particular streamwise location.
Figure 10(b) shows  $|a|_{v}$ for $\lambda = 6$. Similarly to $\lambda = 4.5$, the dominant frequency in the near field is $3f_r$. However, owing to the higher tip speed ratio, the tip vortices interact much earlier. As a result, $f_r$ surpasses $3f_r$ much closer to the turbine, at $x/D \approx 0.92$, and remains dominant even beyond three rotor diameters. Although $2f_r$ is present, it never becomes dominant. The strength of wake meandering shows a trend similar to $\lambda = 4.5$ and remains roughly constant throughout the domain of investigation. However, the strength of wake meandering is increased markedly for $\lambda = 6$. The wake meandering frequency, although not dominant, is present in the near wake, and in fact it exists close to the nacelle in the central region, which hints at the fact that the genesis of wake meandering could be related to the shedding of the nacelle or the nacelle/turbine assembly considered together as a porous bluff body. The porosity of the bluff body changes with tip speed ratio, which in turn changes the nature of the vortex shedding from the bluff body. This is explored in more detail in § 5.
In the lower plane (experiment 1B), the frequency spectrum is more broadband and turbulent, as can be seen from figures 7 and 8. As a result, a similar analysis for the lower plane revealed a large number of frequencies of comparable strengths, making it difficult to draw firm conclusions, hence it is not discussed any further. The same analysis is also performed for experiment 2, and the strengths of the different frequencies are shown in figure 11. The results from experiment 2A (i.e. at the plane  $y=0$) are shown in figures 11(a) and 11(c) for $\lambda =4.5$ and $6$, respectively, and they resemble closely figure 10 despite being different experiments. Note that for $\lambda =6$, $f_{wm}$ surpasses $3f_r$ exactly at $x/D\approx 1.7$, similarly to figure 10(b). The nacelle frequency $f_n$ is important only in the very near field, and the tower frequency is rather weak. Figures 11(b) and 11(d) show the strength of frequencies at the offset plane (experiment 2B). The tower frequency now becomes important and can even be the dominant frequency in the near field. The streamwise evolution of $f_T$ is similar in figures 11(b) and 11(d), showing minimal dependence on $\lambda$. Similarly to figure 10, the strength of wake meandering for $\lambda =6$ is higher than for $\lambda =4.5$ for both the planes considered, which firmly establishes the fact that the strength of wake meandering is a function of the tip speed ratio.

Figure 11. Strengths of different frequencies in the  $xz$ ( $\,y=0$) plane for (a) $\lambda = 4.5$ and (c) $\lambda = 6$. (b,d) The same at an offset plane $y = -0.35D$.
4. On the definition of near wake
The near wake is defined coarsely as the region where the effect of the coherent structures shed from the turbine is pronounced. Contrastingly, in the far wake, the mean wake velocity profile starts to resemble a Gaussian owing to wake recovery. The distinction between the two is generally not trivial and depends on several factors, including turbine geometry and operating condition, as well as inflow condition. The transition between the near and far wakes is thus often defined vaguely to be in the range 2D–4D from the rotor (Hall Reference Hall2023; Vermeer et al. Reference Vermeer, Sørensen and Crespo2003).
In the presence of freestream turbulence, the tip vortices break down earlier and the wake recovers faster, leading to a shorter near wake (Chamorro & Porté-Agel Reference Chamorro and Porté-Agel2009; Wu & Porté-Agel Reference Wu and Porté-Agel2012). Recently, Gambuzza & Ganapathisubramani (Reference Gambuzza and Ganapathisubramani2023) studied the effect of both freestream turbulence intensity ( $T_i$) and integral time scale. They tested $T_i$ from $3\,\%$ to $12\,\%$, and integral time scales $0.1\unicode{x2013}10$ times the convective time scale based on turbine diameter. They reported a shorter near wake for higher $T_i$ and short integral time scale. The extent of the near wake would thus depend on several factors, and it is safe to say that an unambiguous definition of the near wake based simply on the turbine diameter may not be possible (Howard et al. Reference Howard, Singh, Sotiropoulos and Guala2015). Various attempts have been made to define the near wake systematically. Sørensen et al. (Reference Sørensen, Mikkelsen, Henningson, Ivanell, Sarmast and Andersen2015) and Vahidi & Porté-Agel (Reference Vahidi and Porté-Agel2022) defined the near wake as the distance from the rotor at which the mean velocity profile becomes approximately Gaussian. De Cillis et al. (Reference De Cillis, Cherubini, Semeraro, Leonardi and De Palma2021) defined the near wake's extent as the distance where the time-averaged coherent kinetic energy dropped to a certain level. Gambuzza & Ganapathisubramani (Reference Gambuzza and Ganapathisubramani2023) defined the near wake to be the region where the material derivative of turbulent kinetic energy is positive.
Unlike these approaches, we make an attempt to demarcate the near wake based on the strength of the different frequencies observed. Note that the dominant frequency signature in the immediate vicinity of the turbine is that of the tip vortices, while in the far wake, the dominant frequency is expected to be that of wake meandering. We propose that the location where the strength of wake meandering (let us call it  $S_{wm}$) surpasses the strength of the blade passing frequency ( $S_{3fr}$) can be used as a robust definition of the near wake. Note that this idea of defining the near wake is similar to that proposed by Howard et al. (Reference Howard, Singh, Sotiropoulos and Guala2015). They made a qualitative distinction between the near and far wakes based on the importance of the hub vortex (signature of the near wake) and the wake meandering (signature of the far wake). We take up a more quantitative approach here, and use the strength of the tip vortices as the near wake signature instead.
Note from figure 10 that the crossover between  $S_{wm}$ and $S_{3fr}$ happens at $x/D \approx 2.2$ and $1.7$ for $\lambda =4.5$ and $6$, respectively. Although these locations are far apart in terms of turbine diameter $D$, they are found to be close in terms of convective pitch $L_c$, and correspond to $3.15 L_c$ and $3.24 L_c$, respectively. To investigate further the effectiveness of $L_c$ as a length scale in the near wake, we performed a series of experiments in experimental campaign 1D (see table 1 for details) at tip speed ratios different from the two main tip speed ratios. We show the evolution of the relative strength of the tip vortices and wake meandering (defined as $S_{3fr} - S_{wm}$) with both turbine diameter $D$ and the convective length scale $L_c$ for all the tip speed ratios tested in experiments 1A and 1D in figure 12. A better collapse is observed for different $\lambda$s when $x$ is non-dimensionalised using $L_c$. Further, the relative strength becomes zero, i.e. the strength of wake meandering surpasses that of $3f_r$ in the vicinity of $x \approx 3L_c$. The blue shaded region in figure 12 shows the scatter in the location where the relative strength becomes zero in terms of $D$ and $L_c$. Based on this experimental evidence, we propose that a distance $3L_c$ from the rotor plane can be a good estimate of the near wake when the freestream turbulence level is low. In the presence of freestream turbulence, the extent of the near wake might be expected to be shorter than $3L_c$ due to the earlier breakdown of the tip vortices, as discussed earlier.

Figure 12. Variation of relative strength of  $3f_r$ and $f_{wm}$ with (a) turbine diameter $D$ and (b) convective length scale $L_c$, for different tip speed ratios.
5. Wake meandering
Wake meandering has been described as the large-scale motion that dominates the ‘far wake’ dynamics of a wind turbine. However, there exist varied opinions about the exact cause of wake meandering (Larsen et al. Reference Larsen, Madsen, Thomsen and Larsen2008; Espana et al. Reference Espana, Aubrun, Loyer and Devinant2011; Okulov et al. Reference Okulov, Naumov, Mikkelsen, Kabardin and Sørensen2014; Foti et al. Reference Foti, Yang, Campagnolo, Maniaci and Sotiropoulos2018). For example, wake meandering has been described as large intermittent displacements of the entire wake due to passive advection by large-scale structures in the incoming flow (Espana et al. Reference Espana, Aubrun, Loyer and Devinant2011; Porté-Agel et al. Reference Porté-Agel, Bastankhah and Shamsoddin2020). On the other hand, a well-defined low frequency has been obtained in the far wake, which has been associated with wake meandering when the freestream turbulence is negligible (Medici & Alfredsson Reference Medici and Alfredsson2006, Reference Medici and Alfredsson2008; Okulov et al. Reference Okulov, Naumov, Mikkelsen, Kabardin and Sørensen2014; Howard et al. Reference Howard, Singh, Sotiropoulos and Guala2015). These authors argued that wake meandering observed in the absence of freestream turbulence is associated with vortex shedding from the turbine, similar to large-scale helical vortical structures found behind porous or solid disks (Berger, Scholz & Schumm Reference Berger, Scholz and Schumm1990; Medici & Alfredsson Reference Medici and Alfredsson2005). The wake meandering observed in the present study is of the latter type, which is induced by the wake-generating body itself, as opposed to any inflow turbulence.
Figures 7 and 8 reveal that the wake meandering frequency is dominant in the central region, within  $-0.4D < y<0.4D$. Accordingly, experiment 1C focused on this region (see figure 1a) to capture the centreline dynamics and the nature of the wake meandering. To understand the nature of wake meandering, we utilise phase averaging (see e.g. Reynolds & Hussain Reference Reynolds and Hussain1972; Cantwell & Coles Reference Cantwell and Coles1983) based on the frequency of the wake meandering observed for the two tip speed ratios. We used 48 phase bins to obtain the phase-averaged flow fields. Thereafter, the second Fourier mode of the phase-averaged flow field was obtained. More details about this method can be found in Baj & Buxton (Reference Baj and Buxton2017) and Biswas, Cicolin & Buxton (Reference Biswas, Cicolin and Buxton2022). The limited total acquisition time ( $\approx$10–15 cycles of wake meandering) in experiment 1C, however, yielded poorly converged modes. Nevertheless, to have a qualitative idea, the transverse velocity components of the phase-averaged modes are shown in figures 13(a,b) for $\lambda =4.5$ and $6$, respectively. Note that the modes are qualitatively similar and they resemble vortex shedding modes from a bluff body (for instance, see the modes associated with vortex shedding behind cylinders; Chen, Tu & Rowley Reference Chen, Tu and Rowley2012; Baj, Bruce & Buxton Reference Baj, Bruce and Buxton2015) of characteristic diameter $D$ (albeit a porous body) that initiates from the vicinity of the nacelle. In fact, the wavelength of the mode is also similar to helical vortex shedding modes found behind a solid circular disk (Berger et al. Reference Berger, Scholz and Schumm1990) at similar $O(Re_D)$. Note that wake meandering behind a turbine is inherently three-dimensional (Medici & Alfredsson Reference Medici and Alfredsson2006; Foti et al. Reference Foti, Yang, Guala and Sotiropoulos2016), whereas we present simply a planar slice of the mode in figure 13.

Figure 13. Transverse velocity components of the phase-averaged wake meandering modes for (a)  $\lambda = 4.5$ and (b) $\lambda = 6$.
Parallels have been drawn previously between a rotating turbine and a non-rotating porous disk (Lignarolo et al. Reference Lignarolo, Ragni, Ferreira and Van Bussel2016; Neunaber et al. Reference Neunaber, Hölling, Whale and Peinke2021; Vinnes et al. Reference Vinnes, Gambuzza, Ganapathisubramani and Hearst2022). It has been shown in several works that the wake characteristics of a porous disk can be similar to those of a turbine, at least in the far field, weakly agreed upon as  $x\gtrsim 3D$ (Aubrun et al. Reference Aubrun, Loyer, Hancock and Hayden2013; Neunaber et al. Reference Neunaber, Hölling, Whale and Peinke2021). The seminal work of Castro (Reference Castro1971) showed that the Strouhal number of vortex shedding from a two-dimensional porous plate decreases if porosity is reduced, and it asymptotes to $\approx$0.14 for a solid plate. A similar trend of wake meandering Strouhal number reducing with $\lambda$ was reported by Medici & Alfredsson (Reference Medici and Alfredsson2006, Reference Medici and Alfredsson2008). Further, Castro (Reference Castro1971) did not observe vortex shedding for low porosity. On a similar note, Medici & Alfredsson (Reference Medici and Alfredsson2006) did not observe wake meandering at lower $\lambda$ ( $\lambda <3$ for a two bladed turbine). Indeed, the effective porosity of a wind turbine changes if $\lambda$ is changed. If $\lambda$ is increased, then a greater area is swept by the blades in the time taken for a parcel of fluid to convect across the rotor disk, thus increasing the effective blockage, or reducing the porosity. In Appendix C, we perform a simple calculation to show how the effective ‘porosity’ of the turbine reduces with $\lambda$. Medici & Alfredsson (Reference Medici and Alfredsson2008) reported the reducing trend of $St$ with $\lambda$ only at a distance $1D$ downstream of the rotor, which can be said to be well within the near wake of a turbine. An interesting question to ask is does the wake meandering frequency show a similar dependence on $\lambda$ even in the far field? Okulov et al. (Reference Okulov, Naumov, Mikkelsen, Kabardin and Sørensen2014) reported that the wake meandering frequency was a function of operating condition for $1.5< x/D<2.5$, beyond which it was invariant to operating condition. However, if wake meandering is to be related to the vortex shedding of the turbine disk, then its characteristic frequency should scale similarly with $\lambda$ or effective porosity everywhere in the wake. To answer this question, we performed a series of experiments (labelled experiment 3 in figure 1 and table 1) that focused on thin strip-like fields of view at different locations in the flow.
For a precise measurement of the wake meandering frequency, a large time series of data is required as wake meandering involves rather slow dynamics. A strip FOV was therefore taken, which allowed us to obtain a long time series ( $\approx$15 min or $\approx$180 wake meandering cycles) of data considering the storage constraints of the cameras used. The FOV was centred at three different locations, $x/D = 2$, 3 and 5. Experiments were conducted at 16 tip speed ratios from 4.5 to 6 in steps of 0.1. The spectra were obtained at the local geometric centreline using Welch's power spectral density estimator (Welch Reference Welch1967) only. The number of windows used in Welch's estimator was varied for each $\lambda$ tested to ensure that there was a robust detection of a single spectral peak that could be ascribed to the wake meandering. The Strouhal numbers of wake meandering, $St_{wm}$ (defined based on $D$ and $U_{\infty }$) obtained at different locations are shown in figure 14. A decreasing trend of wake meandering Strouhal number with $\lambda$ is observed at all three locations. This result establishes that wake meandering in a wind turbine wake is related to the global vortex shedding mode of a porous bluff body, the frequency of which depends on $\lambda$ (i.e. porosity). We do not exclude the possibility that background turbulence can affect the wake meandering; nevertheless, we show that it exists even in the absence of freestream turbulence. The fact that Okulov et al. (Reference Okulov, Naumov, Mikkelsen, Kabardin and Sørensen2014) found wake meandering $St$ to be invariant to operating conditions beyond $x/D \approx 2.5$ could be due to the long arm-like nacelle (which was longer than the turbine diameter) in their turbine, which could have altered significantly the far-field boundary conditions around the central wake region where wake meandering is found to be the strongest in the present study. It could also be that their frequency resolution was not good enough to capture minute changes in the wake meandering frequency (they could capture only ${\approx }23$ wake meandering cycles at the highest $U_{\infty }$ considered, while we had data corresponding to ${\approx }180$ wake meandering cycles). The importance of the nacelle in the genesis of wake meandering has been highlighted rather recently in several works (Howard et al. Reference Howard, Singh, Sotiropoulos and Guala2015; Foti et al. Reference Foti, Yang, Guala and Sotiropoulos2016, Reference Foti, Yang, Campagnolo, Maniaci and Sotiropoulos2018). Howard et al. (Reference Howard, Singh, Sotiropoulos and Guala2015) argued that the nacelle provides an important perturbation to initiate wake meandering. We also see the importance of the nacelle as wake meandering initiates from the vicinity of the nacelle.

Figure 14. Variation of wake meandering Strouhal number with  $\lambda$ at (a) $x/D=2$, (b) $x/D=3$, and (c) $x/D=5$. The red dashed line shows the linear best-fit lines.
Another interesting question to ask is, upon what does wake meandering depend more: the porosity of the turbine disk or the thrust coefficient, or both? It is not trivial to distinguish the separate effects of blockage of mass (porosity) and momentum ( $C_T$) as both change with $\lambda$. Medici & Alfredsson (Reference Medici and Alfredsson2008) showed that wake meandering frequency depends on $C_T$. They performed experiments on turbines with different numbers of blades. Interestingly, for the turbine with a single blade, they did not observe wake meandering at all, although the corresponding thrust coefficient was high. However, at similar thrust coefficients, they observed wake meandering for two- and three-bladed turbines. Accordingly, for wake meandering to be present, both porosity and $C_T$ are likely important.
To further understand the nature of wake meandering, especially in the absence of freestream turbulence, linear stability analysis (e.g. Iungo et al. Reference Iungo, Viola, Camarri, Porté-Agel and Gallaire2013) could be a useful tool. Determining the growth rate of the wake meandering mode could aid in understanding the observed dominance of wake meandering over  $3f_r$ beyond $x \approx 3L_c$. However, as shown in figure 4, the mean velocity field in the near wake is complex, non-axisymmetric and spatially varying, meaning that linear stability analysis of such a base flow is non-trivial. Modelling the wind turbine as a porous object could be useful, but this would require matching of both the porosity and the thrust coefficient, as both are likely important parameters. Additionally, the radial distribution of the inhomogeneous porosity likely plays an important role since the nacelle has been shown to be important in the genesis of wake meandering (Howard et al. Reference Howard, Singh, Sotiropoulos and Guala2015).
6. Conclusion
We conducted particle image velocimetry experiments on the near wake of a lab-scale wind turbine model at varying tip speed ratios ( $\lambda$). The wind turbine model consisted of a nacelle and a tower to imitate a utility-scale turbine and to examine the influence of the geometry on the near wake. The freestream turbulence level was low, and the wake properties obtained were due solely to the wake generating body. The near field was found to be dominated by the array of coherent tip vortices, which appeared to be inhibiting mixing with the outer non-turbulent fluid in the immediate near wake, before the tip vortices merged. The merging and the breakdown process of the tip vortices were found to be strongly dependent on $\lambda$. To be precise, for $\lambda =4.5$, a two-step merging process was observed as reported in previous studies (Felli et al. Reference Felli, Camussi and Di Felice2011; Sherry et al. Reference Sherry, Nemes, Lo Jacono, Blackburn and Sheridan2013a). For $\lambda =6$, however, there was an earlier and stronger interaction between the tip vortices, and the vortices appeared to merge directly in a one-step process.
We proposed a new way of defining the near wake based on the relative strength of the tip vortices (signature of the near wake) and wake meandering (signature of the far wake). We defined a length scale termed the convective pitch ( $L_c = {\rm \pi}D/\lambda$, where $D$ is the diameter) that varies with $\lambda$ and is related to the pitch of a helical vortex filament. We found that the distance from the rotor plane to the location where the strength of the wake meandering surpassed that of the tip vortices was close to $3L_c$ for all the tip speed ratios tested. This indicates that a distance $3L_c$ from the rotor disk could be used as a robust definition of the immediate near wake (where the effects of tip vortices are important) of the turbine irrespective of tip speed ratio, at least when the freestream turbulence level is low.
Distinct frequencies associated with the shedding from the tower and nacelle were identified in the near field. The tower frequency is observed over a broad region, and it could even be the dominant frequency in the near field for the present experimental conditions. Below the nacelle ( $\,y<0$), the interaction of the tip vortices with the tower resulted in an earlier breakdown of the tip vortices, and increased levels of turbulence and mixing. Indeed, the tower acted as the major source of asymmetry in the wake, also evident by a deflection of the wake centreline towards the tower side ( $\,y<0$).
The nacelle frequency was important only very close to the nacelle, and was not particularly energetic. However, the nacelle was found to be important in ‘seeding’ wake meandering, indicated by the presence of the wake meandering frequency from relatively close to the nacelle ( $x/D<0.5$). A plausible role of the nacelle in aiding wake meandering, combined with the fact that freestream turbulence levels were negligible in the present experiments, upholds wake meandering as a global instability of the turbine wake, the characteristic of which should vary with operating condition. In order to justify this, separate experiments were performed to calculate the wake meandering frequency at three different streamwise locations, $x/D=2$, $3$ and $5$, for $4.5\leq \lambda \leq 6$. The Strouhal number of wake meandering was found to decrease when $\lambda$ was increased (or effective porosity was decreased) at all three streamwise stations probed in a similar fashion. Interestingly, a similar decreasing trend of Strouhal number with porosity was observed for vortex shedding behind a porous plate (Castro Reference Castro1971). This similarity bolsters the notion that wake meandering is a global instability of the wake generating body, i.e. a ‘porous’ turbine with characteristic length scale $D$, and is in contrast to the observation of previous works that found wake meandering frequency to be invariant to operating condition in the far wake (Okulov et al. Reference Okulov, Naumov, Mikkelsen, Kabardin and Sørensen2014).
Supplementary movies
Supplementary movies are available at https://doi.org/10.1017/jfm.2023.1095.
Declaration of interests
The authors report no conflict of interest.
Appendix A. Design of experiments
Figure 15(a) shows the turbulence intensity ( $T_i$) and mean velocity ( $U_{\infty }$) profiles measured at the position of the turbine disk, while the turbine was removed. The span of the profiles is the same as the span of the FOV associated with experiment 1A (see figure 1). The freestream velocity profile is uniform across the rotor, showing no effect of the boundary layer developing at the bottom wall of the flume in the vicinity of the rotor. The turbulence intensity is ${\approx }1\,\%$.

Figure 15. (a) Mean streamwise velocity and turbulence intensity profiles at the rotor location. (b) Variation of power ( $C_P$) and thrust ( $C_T$) coefficient of the turbine with tip speed ratio ( $\lambda$) obtained from blade element momentum theory.
We used the conventional blade element momentum method (see Burton et al. Reference Burton, Jenkins, Sharpe and Bossanyi2011) to get a rough idea about the power ( $C_P$) and thrust ( $C_T$) coefficients of the turbine at different tip speed ratios. Note that the sections of our wind turbine blades were cambered flat plate aerofoils with $5\,\%$ camber. The $C_l\unicode{x2013}\alpha$ curve required for the calculation at comparable Reynolds number is obtained from Sunada et al. (Reference Sunada, Sakaguchi and Kawachi1997). We ignored drag on the blade elements. The calculations were performed based only on the part of the blades from the root (maximum chord) to tip. From the root, the blade was interpolated linearly to match the circular section fixed to the hub (see figure 1); this section was ignored in the calculation. The results are shown in figure 15(b). The thrust coefficients for $\lambda =4.5$ and $6$ are found to be 0.49 and 0.53, respectively. The actual thrust could be higher due to the contribution from the nacelle and the tower. However, it is safe to say that at $\lambda =6$, the turbine operates at a higher $C_T$.
Appendix B. The tower's shedding frequency
In figures 16(a) and 16(c), we show the transverse velocity fluctuations’ signals just behind the tower from experiment 2B for  $\lambda =6$ and $4.5$, respectively. Observing the red line (filtered signal), we can sense that the dominant frequency is <1 Hz. The corresponding spectra based on the unfiltered signals are shown in figures 16(b) and 16(d). The Strouhal number of the dominant frequency based on tower diameter ( $d_T$) is $\approx 0.085$ and $0.071$ for $\lambda =6$ and $4.5$, respectively.

Figure 16. (a) Transverse velocity fluctuations just behind the tower, and (b) corresponding fast Fourier transform spectra for  $\lambda =6$. The grey line is the unfiltered signal, and the red line is the filtered signal. The spectra are obtained based on the unfiltered signal. (c,d) The same for $\lambda =4.5$.
Appendix C. Calculation of turbine porosity
In this appendix, we present a method to estimate the effective porosity of the wind turbine as a function of  $\lambda$. First, using the blade element momentum method, we calculate the axial induction factors at different $\lambda$. As an example, the variation of the induction factor with radial distance $r$ is shown in figure 17(a) for $\lambda =6$. This gives the streamwise velocity at the rotor plane as a function of $r$. Next, using the knowledge of the chord and twist variation of the blades, we can calculate the projected thickness of the blades in the $xy$ plane (see figure 1) as a function of $r$. Using the two, we get a time scale $t(r)$ that tells us how much time a fluid parcel would take to cross the rotor disk at a particular radial location. We take a blade element at radial distance $r$, and calculate the area covered by the element in the $yz$ plane (normal to freestream) in time $t(r)$ for a particular $\lambda$. Integrating the area covered over the blade, we can get an estimate of the effective blockage or porosity. The variation of effective porosity with $\lambda$ is shown in figure 17(b). As can be expected, porosity of the turbine reduces as $\lambda$ is increased. The porosities in figure 17(b) are lower than the actual values as the blockages caused by the nacelle and tower, as well as the connecting part below the root of the blades, were ignored. Nevertheless, the calculation serves our motivation to show how porosity depends on the turbine's operation.

Figure 17. (a) Axial induction factor obtained from the blade element momentum method for  $\lambda =6$. (b) Variation of rotor porosity with $\lambda$.


 Open access