In the last decades, obesity and diet-related chronic diseases have been considered public health issues worldwide, since obesity prevalence has been increasing over time acting as a risk factor for millions of premature deaths and disabilities(1). In Portugal, more than 20 % of the population was considered obese in 2015–2016, and this prevalence was nearly twice as high in elderly people(Reference Oliveira, Araújo and Severo2). Moreover, in 2017, 88 % of the deaths in Portugal were related to non-communicable diseases (NCD)(3).
These health burdens have been accompanied by shifts in the eating pattern of populations, which have evolved as modernisation and globalisation took place. Food systems in countries with different development levels have been changed towards remarkably profitable production of convenient foods. Thus, food processing performed by transnationals manufacturing has been based on high-yield crops and animal carcasses added by fat, sugar, salt and many cosmetic additives(Reference Monteiro, Moubarac and Cannon4).
Although food processing offers some advantages to consumers such as shelf stability, variety and convenience, it becomes a pitfall when it affects health, social, cultural, economic, political and environmental aspects of society through strategies including formulation, low prices, aggressive market and easy access(Reference Monteiro, Cannon and Moubarac5,Reference Monteiro, Cannon and Levy6) .
In this context, a new method named NOVA has been proposed to classify foods according to the nature, extent and purpose of industrial food processing. NOVA divides foods in four groups: unprocessed or minimally processed foods, processed culinary ingredients, processed foods and ultra-processed foods(Reference Monteiro, Cannon and Levy6). Specially, ultra-processed foods are industrial formulations containing little or no whole food. They are made entirely or mostly from chemical compounds not conventionally used in culinary preparations (i.e. hydrogenated fats, modified starches and protein isolates) and cosmetic food additives (notably, flavours, colours and emulsifiers), which are used to make them palatable and attractive(Reference Monteiro, Cannon and Levy6).
Several studies, including a randomised clinical trial(Reference Hall, Ayuketah and Brychta7), have already shown the association between the consumption of ultra-processed foods and NCD outcomes such as obesity(Reference Hall, Ayuketah and Brychta7–Reference Canhada, Luft and Giatti13), CVD and metabolic diseases(Reference Srour, Fezeu and Kesse-Guyot14–Reference Martínez Steele, Juul and Neri16), asthma and wheezing(Reference Melo, Rezende and Machado17), frailty(Reference Sandoval-Insausti, Blanco-Rojo and Graciani18), depression(Reference Adjibade, Julia and Allès19,Reference Gómez-Donoso, Sánchez-Villegas and Martínez-González20) , gastrointestinal disorders(Reference Schnabel, Buscail and Sabate21), cancers(Reference Fiolet, Srour and Sellem22) and mortality(Reference Blanco-Rojo, Sandoval-Insausti and López-Garcia23–Reference Rico-Campà, Martínez-González and Alvarez-Alvarez26). Such association may be explained by the negative influence of ultra-processed food consumption on diet quality. Nationally representative studies, performed in developed and developing countries around the world, have demonstrated that high dietary contribution of these products promotes unbalanced diets accordingly to the international recommendations on the prevention of NCD(Reference Martínez Steele, Popkin and Swinburn27–Reference Vandevijvere, De Ridder and Fiolet37).
To date, studies regarding the consumption of ultra-processed foods in Portugal are scarce. An ecological study including nineteen European countries indicated that, in 2000, ultra-processed foods contributed to nearly 10 % of total purchased dietary energy in Portugal, the lowest percentage among all assessed countries(Reference Monteiro, Moubarac and Levy38). However, to our knowledge, studies examining the effective consumption of ultra-processed foods and its impact on diet quality in this population lack in the literature. Therefore, the present study aims to investigate the dietary share of ultra-processed foods and its association with NCD-related dietary nutrient profile of adult and elderly populations in Portugal.
Methods
Data source and collection
This study used data from the National Food, Nutrition and Physical Activity Survey of the Portuguese Population (IAN-AF 2015–2016). Protocol and methodology of this survey are described in detail elsewhere(Reference Lopes, Torres and Oliveira39,Reference Lopes, Torres and Oliveira40) . The survey was designed to be representative of the Portuguese population through multistage sampling, which involved stratification by seven geographical regions, randomly selection of Primary Health Care Units and randomly selection of its individuals considering a fixed number by sex and age groups. Data were collected through an electronic platform (‘You eAT&Move’) specially developed for the survey purposes and in agreement with the European protocols (EU-Menu, European Food Safety Authority(Reference Lopes, Torres and Oliveira39–41). The present study included adults (≥18 and <65 years) and elderly (≥65 years) who participated in the two interviews performed 8–15 d apart by trained interviewers. Total sample consisted of 3852 individuals, including 3102 adults and 750 elderly. This study was conducted according to the guidelines established in the Declaration of Helsinki, and all procedures involving human subjects were approved by the National Commission for Data Protection, the Ethical Commissions of each one of the Regional Administrations of Health and the Ethical Committees of the Universities of Porto and São Paulo. Written informed consents were obtained from all participants.
Dietary assessment and NOVA classification
In the IAN-AF 2015–2016, dietary intake was assessed by two non-consecutive 24-h recalls applied 8–15 d apart. Interviews were distributed in a period of 12 months and included all days of the week (randomly selected) to attenuate seasonal effects and day-to-day variation in food intake. Data were collected through the eAT24 software, which uses the Portuguese Food Composition Table(42) to transform portion sizes or grams of foods into energy and nutrients. Food items not included in the composition table were incorporated from the European Food Information Resource database(Reference Roe, Bell and Oseredczuk43) or from the food labelling information. Detailed information about each item eaten or drunk in the correspondent period was recorded, including name, quantity, brand and cooking methods, as well as the place and time for each eating occasion. When the weight or volume of consumed food item was unknown, food portion size was estimated with the help of illustration book, household measure list and package information. The recipes recorded in the interviews were systematically disaggregated at the ingredient level through a method previously described(Reference Reinivuo44).
Dietary outcomes evaluated in this study were chosen according to nutrient intake recommended by the WHO for prevention of NCD(45–48). Total energy intake was expressed as kJ/d (kcal/d), and dietary content of proteins, carbohydrates, free sugars, total fats and saturated fats was expressed as percentage of total energy intake, while dietary content of fibre, Na and K was expressed as nutrient concentration (g or mg) per 4184 kJ (1000 kcal). Dietary energy density was estimated based on energy of solid foods divided by its amount consumed in grams. The content of free sugars was estimated using the algorithm proposed by Louie et al. (Reference Louie, Moshtaghian and Boylan49) and previously applied in the IAN-AF 2015–2016, as elucidated by Marinho et al. (Reference Marinho, Severo and Correia50).
All reported food items were identified according to the extent and purpose of food processing by using the NOVA system(Reference Monteiro, Cannon and Moubarac5,Reference Monteiro, Cannon and Levy6) . NOVA divides foods and beverages into four groups and related subgroups: unprocessed or minimally processed foods (e.g. cereals; potatoes and other tubers and roots; vegetables; legumes and fresh meats), processed culinary ingredients (e.g. plant oils; animal fats and table sugar), processed foods (e.g. non-industrial breads; cheeses; ham and other salted, smoked or canned meats; vegetables and fruits preserved in brine) and ultra-processed foods (e.g. soft drinks; sweet snacks; confectionery; industrial cakes and desserts; sausage and other reconstituted meat products; ready-to-eat foods; industrial breads and toasts). Detailed description of the NOVA food classification can be found elsewhere(Reference Monteiro, Cannon and Levy6).
Food items classification was performed independently by two experts in food consumption assessment and the NOVA system. Subsequently, another expert researcher checked the classifications indicating discrepant items to be discussed among all researchers and, later, determined by consensus. In case of dubious classification (whether a food item was commercial or homemade, for example), the experts deliberated for the most conservative classification.
Covariates
Demographic and socio-economic characteristics, including age, sex, household income, educational level, employment status and marital status, were considered in the present study.
Sex (male/female) and birth date were imported from the National Health Registries databases and confirmed with the participants in the first interview. Age, in years, was calculated from date of birth and date of the first interview. Household income was considered as total budget of all household members and classified in ranges, varying from ‘<485€’ to ‘more than 4365€’ per month. Educational level was divided into three categories: none, first and second cycle of primary education; third cycle of primary education and high school and higher education level. Employment status was defined as ‘worker for a fee or profit’, ‘unemployed’ or ‘other situation’ (retired, permanently disabled, student, domestic worker, etc.). Finally, marital status identified participants as ‘single’, ‘married’ (including non-marital partnership) and ‘other’ (divorced and widowed).
Regarding the regions of Portugal assessed by the IAN-AF 2015–2016, five of them corresponded to the Geographic Units of Mainland (North, Center, Lisbon Metropolitan Area, Alentejo and Algarve) and the other two to the Portuguese islands (Madeira and Azores).
Data analysis
The dietary share of each NOVA food group and subgroup was calculated over to the total energy intake. Differences between the mean relative intake of NOVA groups and subgroups in adults and elderly were assessed by Student’s t test. Based on the energy share of ultra-processed foods, the population was divided into quintiles of consumption, in which the first quintile (Q1) corresponded to the lowest consumption of ultra-processed and the fifth quintile (Q5) to the highest consumption. Thus, total energy distribution of NOVA food groups and subgroups, as well as nutritional indicators, was analysed across these quintiles through linear regression models. Standardised regression coefficients (β) were provided in order to compare the magnitudes of effect sizes among variables with different units of measure.
The inadequate intake of nutritional indicators related to NCD was also evaluated across quintiles of energy share of ultra-processed foods. To assess more accurately the prevalence of inadequacy, dietary nutrients intake was adjusted to estimate the usual intake considering inter- and intraindividual variation by the multiple source method(Reference Harttig, Haubrock and Knüppel51). Then, following the WHO recommendations for preventing NCD, dietary nutrient intake was considered inadequate when ≥10 % of total energy for free sugars and saturated fats; ≤12·5 g/4184 kJ (1000 kcal) for fibre; ≥1 g/4184 kJ (1000 kcal) for Na and <1755 mg/4184 kJ (1000 kcal) for K(45–48). Prevalence ratios were estimated by using Poisson regression, which analysed prevalence of nutrient inadequacy across quintiles of ultra-processed food consumption.
Besides the estimation of crude models, all regressions were adjusted for potential confounding covariates such as age (years), sex, geographical region, rates of household income, educational level, employment status and marital status. Independent variables were examined for multicollinearity by using the variance inflation factors.
Statistical analyses were performed using Stata Statistical Software (version 14)(52) and considered sample weights to permit inferences from participants to the Portuguese population. The P values were two-tailed, and P < 0·05 was considered statistically significant.
Results
Contribution of NOVA food groups on daily energy intake and across quintiles of the dietary share of ultra-processed foods
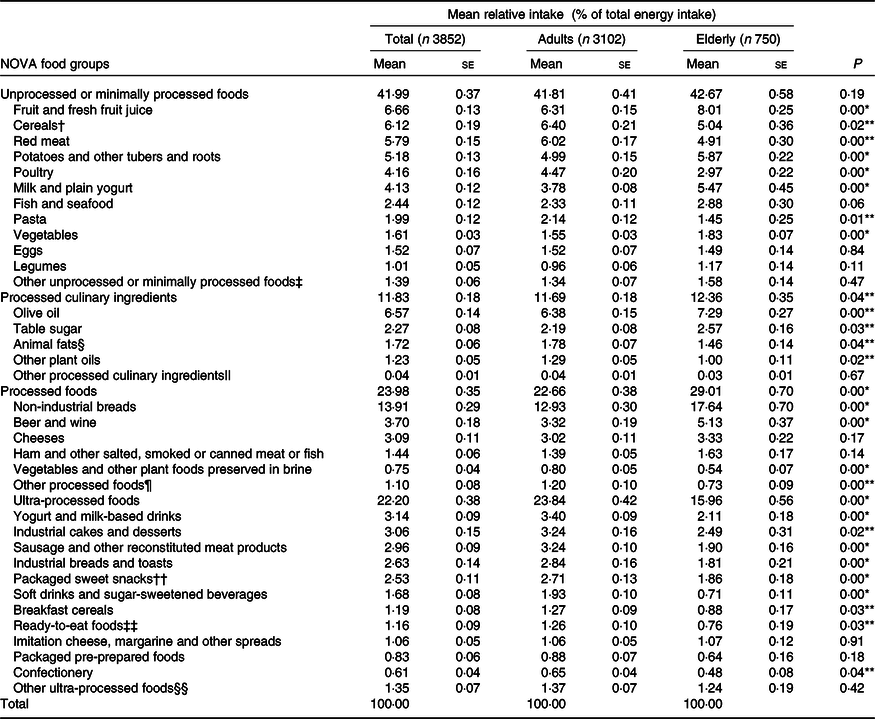
Table 1 shows the energy share of each NOVA food group and subgroup for adults, elderly and overall sample, according to the IAN-AF 2015–2016. Mean daily energy intake of Portuguese population aged 18 years and above was 7707 kJ/d (1842 kcal/d), in which 42·0 % was derived from unprocessed or minimally processed foods, 11·8 % from processed culinary ingredients, 24 % from processed foods and 22·2 % from ultra-processed foods. Among adults, mean daily energy intake was 7966 kJ/d (1904 kcal/d), in which 41·8 % was derived from unprocessed or minimally processed foods, 11·7 % from processed culinary ingredients, 22·7 % from processed foods and 23·8 % from ultra-processed foods. Among elderly, mean daily energy intake was 6707 kJ/d (1603 kcal/d), in which 42·7 % was derived from unprocessed or minimally processed foods, 12·3 % from processed culinary ingredients and 29·0 % from processed foods and 16·0 % from ultra-processed foods.
Table 1. Distribution of total energy intake according to NOVA food groups in the Portuguese population aged ≥18 years (2014–2015): the UPPER project

* P < 0·001 and **P < 0·05 for difference of mean relative intake between adults and elderly.
† Including grains and flours.
‡ Including coffee/substitutes, tea, cocoa, fungi, nuts, seeds and yeast.
§ Including butter and lard.
|| Including starches, gelatin, baking powder and vinegar.
¶ Including sweetened or salted nuts, processed cakes, crackers, sauces and fruit-based beverages, jams, condensed milk and commercial baby foods.
†† Including cookies, biscuits and cereal bars.
‡‡ Including sandwiches, pastry puffs and savory pies.
§§ Including packaged salty snacks, industrial sauces, bouillon cubes, distilled alcoholic drinks, flavoured ciders, artificial sweeteners, food supplements and infant formula.
The most common unprocessed or minimally processed foods in terms of dietary energy were cereals (6·4 %), fruits (6·3 %) and red meat (6·0 %) for adults and fruits (8·0 %), potatoes and roots (5·9 %) and milk and plain yogurt (5·5 %) for elderly. Olive oil (6·4 % for adults and 7·3 % for elderly) and table sugar (2·2 and 2·6 %, respectively) provided the highest percentage of dietary energy among processed culinary ingredients, while non-industrial breads (12·9 and 17·6 %, respectively), beer and wine (3·3 and 5·1 %, respectively) and cheeses (3·0 and 3·3 %, respectively) provided the highest energy intake among processed foods, for both adults and elderly. Finally, the most common ultra-processed foods were yogurt and milk-based drinks (3·4 %), sausage and other reconstituted meat products (3·2 %), industrial cakes and desserts (3·2 %) and industrial breads and toasts (2·8 %) among adults, while industrial cakes and desserts (2·5 %), yogurt and milk-based drinks (2·1 %), sausage and other reconstituted meat products (1·9 %) and packaged sweet snacks (1·9 %) were more common among elderly (Table 1).
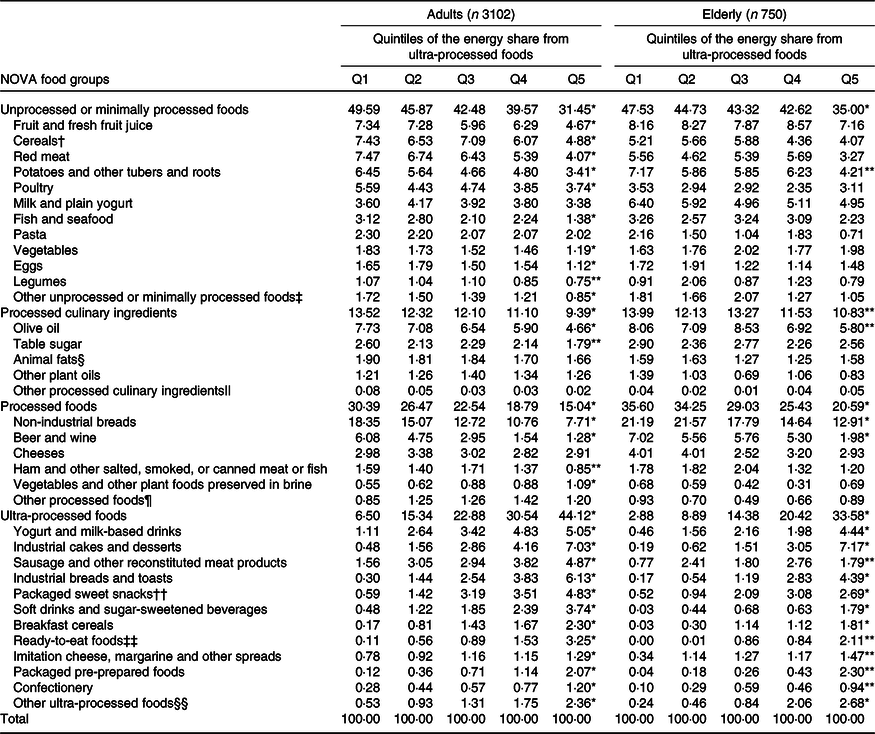
Table 2 illustrates the energy share of NOVA food groups and subgroups across quintiles of ultra-processed food consumption focusing only on adults and elderly, as their dietary pattern based on food processing was seen to be different. Nevertheless, the results regarding the overall sample are shown in the online Supplementary Table S1. The mean dietary share of ultra-processed foods ranged from 6·5 % for adults and 2·9 % for elderly (Q1) to 44·1 and 33·6 % (Q5), respectively.
Table 2. Distribution of mean relative intake (percentage of total energy intake) according to NOVA food groups across quintiles of ultra-processed food consumption in the Portuguese population aged ≥18 years (2014–2015): the UPPER project
* P < 0·001 and ** P < 0·05 for linear trend across quintiles of ultra-processed food consumption.
† Including grains and flours.
‡ Including coffee/substitutes, tea, cocoa, fungi, nuts, seeds and yeast.
§ Including butter and lard.
|| Including starches, gelatin, baking powder and vinegar.
¶ Including sweetened or salted nuts, processed cakes, crackers, sauces and fruit-based beverages, jams, condensed milk and commercial baby foods.
†† Including cookies, biscuits, and cereal bars.
‡‡ Including sandwiches, pastry puffs and savory pies.
§§ Including packaged salty snacks, industrial sauces, bouillon cubes, distilled alcoholic drinks, flavored ciders, artificial sweeteners, food supplements and infant formula.
In adults, the dietary share of most subgroups of unprocessed or minimally processed foods, processed culinary ingredients and processed foods decreased significantly across quintiles of the dietary share of ultra-processed foods, while in elderly this trend was seen only for potatoes, other tubers and roots; olive oil; non-industrial breads and beer and wine. Instead, and as expected, energy share of all subgroups of ultra-processed foods increased significantly from the lowest to the highest quintile, with the greatest increases coming from ready-to-eat foods, industrial breads and packaged pre-prepared foods, for adults and ready-to-eat foods, packaged pre-prepared foods, breakfast cereals, soft drinks and sugar-sweetened beverages (SSB), for elderly.
Nutritional indicators in overall diet and across quintiles of the dietary share of ultra-processed foods
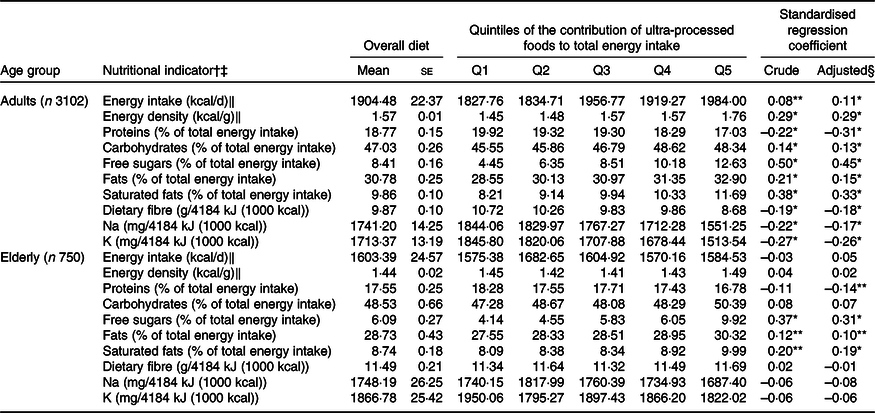
Table 3 shows the NCD-related dietary nutrient indicators in overall diet and across quintiles of the dietary share of ultra-processed foods.
Table 3. Nutritional indicators of the overall diet across quintiles of ultra-processed food consumption in the Portuguese population aged ≥18 years (2014–2015): the UPPER project
(Mean values with their standard errors)
* P < 0·01 and **P < 0·05 for linear trend across quintiles of ultra-processed food consumption.
† All values refer to means.
‡ Values recommended by the World Cancer Research Foundation for energy density (5·23 kJ/g (1·25 kcal/g)) and by the WHO for proteins (10–15 % of total energy), carbohydrates (55–75 % of total energy), free sugars (<10 % of total energy), fats (15–30 % of total energy), saturated fats (<10 % of total energy), dietary fibre (>12·5 g/4184 kJ (1000 kcal)), Na (<1000 mg/4184 kJ (1000 kcal)) and K (≥1755 mg/4184 kJ (1000 kcal)).
§ Adjusted for age (years), sex, geographical region, household income, educational level, employment status and marital status.
‖ To convert kcal to kJ, multiply by 4·184.
In adults, as the consumption of ultra-processed foods increased, the total energy intake, the dietary energy density and the contents of carbohydrates, free sugars, total fats and saturated fats increased significantly in both crude and adjusted models. Contents of protein, fibre and Na decreased significantly as the dietary share of ultra-processed foods increased also in both models. In the adjusted models, the larger significant and positive effect sizes were observed for free sugars, saturated fats and energy density with an increment of 184, 42 and 22 % from the first to fifth quintiles of ultra-processed foods, respectively. In an opposite manner, the larger significant negative effect sizes were observed for proteins, K and fibre, with a reduction of 14, 18, 19 % from the first to fifth quintiles of ultra-processed foods, respectively.
In elderly, as the consumption of ultra-processed foods increased, the dietary contents of free sugars, total fats and saturated fats increased significantly in both crude and adjusted models. After adjustment for confounders, proteins decreased significantly as the dietary share of ultra-processed foods increased. The highest effect sizes among significant associations were found for free sugars and saturated fats, with an increment of 140 and 23 % from the first to fifth quintiles of ultra-processed foods, respectively. Moreover, total fats presented an increment of 10 %, while proteins presented a reduction of 8 % from the first to fifth quintiles.
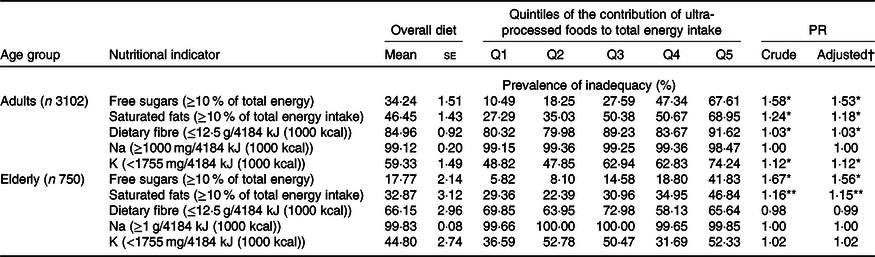
Regarding dietary recommendations for preventing NCD, Table 4 describes the prevalence of inadequate nutrient intakes in overall diet and across quintiles of the dietary share of ultra-processed foods. Besides prevalence of people exceeding the upper limits recommended for Na has reached almost all individuals in both age groups, the lower limits recommended for dietary fibre and K were not reached by about half or more of the population. As the dietary share of ultra-processed foods increased, the prevalence of people exceeding the upper limits recommended for free sugars and saturated fats increased significantly in adults and elderly. The prevalence of inadequate nutrient intake of fibre and K also increased as the consumption of ultra-processed foods raised in adults group. Notably, from the lower to the upper quintile, the prevalence of excessive intake increased by 544 % for free sugars and 153 % for saturated fat in adults and by 619 and 60 %, respectively, in elderly. After adjustment for socio-demographic covariates, no changes in statistical significance of models have been observed associating inadequate nutrient intake and dietary share of ultra-processed foods.
Table 4. Prevalence of inadequate nutrient intake across quintiles of ultra-processed food consumption in the Portuguese population aged ≥18 years (2014–2015): the UPPER project
(Mean values with their standard errors)
PR, prevalence ratios estimated using Poisson regression.
* P < 0·01 and ** P < 0·05 for linear trend across quintiles of ultra-processed food consumption.
† Adjusted for age (years), sex, geographical region, household income, educational level, employment status and marital status.
Discussion
In this study, where data from a nationally representative sample of the Portuguese population have been employed, we found that ultra-processed foods contributed to, approximately, 24 % of the total energy intake in adults and to 16 % in elderly. Yogurt and milk-based drinks, sausage and other reconstituted meat products, industrial cakes and desserts, industrial breads and toasts, packaged sweet snacks and soft drinks and SSB accounted for approximately 70 % of dietary energy originated from ultra-processed foods in both age groups. In addition, we found a negative impact of ultra-processed food consumption on NCD-related dietary nutrient profile of adults and elderly, particularly for increasing the dietary content of free sugars, total fats and saturated fats, and reducing the dietary content of protein as consumption of ultra-processed foods increases.
In comparison with most of the high-income countries previously studied (USA, UK, Canada and Australia)(Reference Martínez Steele, Popkin and Swinburn27–Reference Machado, Steele and Levy30), in which ultra-processed foods reach more than 50 % of daily energy intake, Portugal more resembles Mediterranean (Spain and France)(Reference Blanco-Rojo, Sandoval-Insausti and López-Garcia23,Reference Schnabel, Kesse-Guyot and Allès24) and Latin American countries (Chile, Brazil, Colombia and Mexico)(Reference Cediel, Reyes and da Costa Louzada31–Reference Marrón-Ponce, Flores and Cediel34), where freshly prepared meals still persist as the basis of populations’ diet and ultra-processed foods account for a maximum of 30 % of daily energy intake. The only study conducted in Portugal regarding ultra-processed foods so far estimated these products to provide 10 % of total purchased dietary energy. However, the study consisted in evaluating household food availability data and refers to year of 2000(Reference Monteiro, Moubarac and Levy38).
The current study revealed a lower consumption of ultra-processed foods by elderly people when compared with adults. The former also differs from the latter due its higher consumption of processed culinary ingredients and processed foods, but not in terms of unprocessed or minimally processed foods. We observed that as the ultra-processed food consumption increases, all the other NOVA food groups are displaced, providing a significant reduction in the consumption of unprocessed or minimally processed foods, processed foods and processed culinary ingredients in both age groups. In terms of NOVA subgroups, there was a notable decrease in the consumption of olive oil among adults and elderly, as well as in the consumption of unprocessed or minimally processed foods, including cereals, fruits, vegetables, legumes and fishes, across the quintiles of ultra-processed food consumption, mainly in adults. These results suggest that ultra-processed food consumption may amplify the decline of Mediterranean diet adherence, lately seen in Portugal and Mediterranean countries(Reference Vilarnau, Stracker and Funtikov53).
Nevertheless, the IAN-AF 2015–2016 report demonstrated that Portuguese elderly had a higher adherence to Mediterranean diet than adults(Reference Lopes, Torres and Oliveira54), corroborating our results, based on food processing, that indicates elderly dietary pattern to be superior than that from their younger counterparts. Among elderly, there was no significant trend for almost all subgroups of unprocessed or minimally processed foods across the quintiles of ultra-processed food consumption. Differently than adults, the ultra-processed food consumption among elderly people tends to displace mostly processed food subgroups, particularly non-industrial breads, beer and wine, whose mean relative contribution exceeds 20 % of their total energy intake.
This study corroborates previous studies performed in different countries when reveals that the increase in the consumption of ultra-processed foods provokes the decrease of diet quality, which can lead to diet-related NCD(Reference Martínez Steele, Popkin and Swinburn27–Reference Vandevijvere, De Ridder and Fiolet37). In adults, these results seem to be impressive to a greater extent than in elderly, whose variation across the quintiles was not consistent or significant for most of the nutritional indicators. The impact of ultra-processed foods on elderly’s diet is likely to be minimised by their dietary pattern as a whole, which could be explained by the stability in the consumption of unprocessed or minimally processed foods since their ultra-processed and processed food consumption are commonly interchangeable. Additional analysis (data not shown) indicate that the 20 % of elderly who has the highest consumption of ultra-processed foods, for example, also consumes important amount of non-ultra-processed foods, including fruits, vegetables, legumes, cereals, tubers, nuts, seeds and non-industrial breads, which contributes to keep their daily fibre content similar to those who consume less ultra-processed foods.
Concerning free sugars, Portuguese adults and elderly presented a mean energy intake lower than other populations with similar dietary contribution of ultra-processed foods(Reference Cediel, Reyes and da Costa Louzada31–Reference Marrón-Ponce, Flores and Cediel34). However, among the nutritional indicators, free sugar content was by far the most negatively impacted by ultra-processed food consumption in the diet of both age groups. Ultra-processed foods contributed with 59 % of total free sugar intake in adults and 46 % in elderly, followed by processed culinary ingredients that account for 30 and 43 %, respectively.
Oppositely to the findings in the UK(Reference Rauber, da Costa Louzada and Steele28), Australia(Reference Machado, Steele and Levy30) and Belgium(Reference Vandevijvere, De Ridder and Fiolet37), our study demonstrated that Na intake among Portuguese adults was significantly and inversely associated with ultra-processed food consumption, as well as seen in Brazil(Reference Costa Louzada, Martins and Canella55). As the Brazilian(Reference Costa Louzada, Martins and Canella55), Portuguese population had a notably higher intake of Na when compared with the other populations(Reference Rauber, da Costa Louzada and Steele28,Reference Machado, Steele and Levy30,Reference Vandevijvere, De Ridder and Fiolet37) , which could be justified by the massive inadequacy of Na intake in all quintiles of ultra-processed food consumption. In the Portuguese diet, Na contribution came, mainly, from the added salt of culinary preparation, summing up more than half of total Na intake (unprocessed or minimally processed foods plus processed culinary ingredients), followed by processed foods. As the consumption of ultra-processed foods increased, the use of added salt decreased (data not shown), reflecting a displacement of unprocessed or minimally processed foods and processed culinary ingredients, which are commonly used during meals preparation. Therefore, beyond discouraging ultra-processed food consumption, Portuguese food policies should promote strategies of food and nutrition literacy focused on the reduction of added salt.
In 2019, a co-regulation agreement to reformulate some ultra-processed foods in terms of added sugar and Na content was signed between Portuguese government and the food industry sector(56). However, reformulation policies present several limitations as long as industries generally replace the sources of negative nutrients by other processed ingredients and cosmetic additives instead of adding real food, which could be even more harmful to health(Reference Scrinis and Monteiro57). Moreover, a recent modelling study has stated that co-regulation agreements with the food industry are insufficient to improve diet quality and avoid premature NCD deaths in Portugal(Reference Goiana-da-Silva, Cruz-E-Silva and Allen58). Hence, it is also of utmost relevance to reduce salt and sugar consumption through promoting market regulation, warning labelling and taxation, while subsiding unprocessed or minimally processed foods(Reference Goiana-da-Silva, Cruz-E-Silva and Allen58–Reference Niebylski, Redburn and Duhaney60).
Our findings further arouse the need of multiple public health strategies to curb ultra-processed consumption and avoid NCD-related nutrient profile in Portugal. In terms of unhealthy food taxation, in 2017, Portugal implemented a SSB tax. The SSB tax has a banded structure and is applied to any drink with added sugar or artificial sweeteners, except those considered with nutritional value (milk-based drinks, fruit- or vegetable-based juices, cereal- or nut-based drinks and drinks for special dietary needs or nutritional supplements)(61). This tax has been associated with decrease in SSB sales, beverage reformulation to avoid the highest tax rate and consequently reduction in the energy intake from SSB(Reference Goiana-da-Silva, Cruz-E-Silva and Allen58,Reference Goiana-da-Silva, Severo and Cruz e Silva62) . A modelling study has projected the impact of this SSB tax on obesity incidence according to scenarios in which sales volume plus reformulation or reformulation alone were considered. Its results indicated that the impact of the decrease in sales plus reformulation would have been 4–8 times more effective in decreasing obesity incidence than the industry reformulation alone(Reference Goiana-da-Silva, Severo and Cruz e Silva62). Nevertheless, despite the effort in taxing some SSB, it is important to highlight that adverse effects, such as the substitution of taxed SSB by untaxed ultra-processed beverages, can be expected(Reference Niebylski, Redburn and Duhaney60). Thus, comprehensive policies aimed to tax ultra-processed foods and beverages in general could be a measure to avoid such an effect, while covering all the other inconveniences found in these formulated products.
Regarding nutrition labelling, since scientific evidence has been suggesting front-of-pack nutrition labels to promote healthier food choices, the Portuguese National Program for the Promotion of Healthy Eating (PNPAS) has developed, in 2019, a technical proposal for the implementation of an interpretive front-of-pack nutrition labelling model. However, to be in line with the European legislation, the final report recommends that its adoption by the food industry may be voluntary, instead of considering to endorse mandatory front-of-pack nutrition labels, as recommended by the WHO(56,Reference Direção-Geral da63,64) .
The Portuguese Food Wheel Guide, a food literacy tool developed in 2003, has been adapted to the Mediterranean food pattern in 2017(65) and is planned to be updated in 2019–2020(56). This dietary guideline divides a wheel in seven food groups according to their recommended contribution to the total daily diet(Reference Rodrigues, Franchini and Graça66). Apart from the Food Wheel Guide key messages advising a limited consumption of products with high sugar and salt contents, this guide does not discriminate the quality of food items belonging to each food group considering, for example, whole foods and modified foods, added by uncommon substances, in a same group (e.g. dairy group includes plain yogurt and yogurt-based drinks flavored and sweetened with sugar or low-energy sweetener). Therefore, considering the impact of ultra-processed foods on quality of diet confirmed by this study, a next version of this guide should include guidance on food processing degree, as already incorporated by Brazil, Ecuador, Uruguay and Peru in their national dietary guidelines(67–Reference Lázaro-Serrano and Domiínguez-Curi70) and by France in its National Nutrition and Health Program recommendations(71).
In view of the possibilities of implementing and improving public policies considering food processing, negative impacts of ultra-processed food consumption on public health could be attenuated. As our results reveal a poor nutrient profile for adults compared with the elderly, perspectives of NCD incidence and mortality, already alarming in Portugal, could even rise in the next decades. Moreover, these findings reflect the population food consumption in 2015–2016 and, since then, their NCD-related nutrient profile may have worsen, considering evidence of the continuous increase in the volume of sales of ultra-processed foods around the world, including European countries(Reference Kelly and Jacoby72).
This study had some limitations that should be considered. Dietary intake was estimated by 24-h recalls, an instrument with intrinsic weak points such as being a self-reported tool liable to omit or underestimate the consumption of unhealthy foods. However, problems related to this method were attenuated by the survey data collection procedure, besides the adjustment for estimating usual intake, which increases data accuracy(Reference Lopes, Torres and Oliveira39,Reference Lopes, Torres and Oliveira40,Reference Harttig, Haubrock and Knüppel51) . In addition, depending on the details given by the participants in the interview, some few food items may have been misclassified regarding their industrial processing degree. As in this case, trained researchers classified and revised food items according to NOVA followed by discussion and choice for the most conservative food group, it might have led to an underestimation of ultra-processed food consumption.
On the other hand, several strengths characterized our study. Data used herein were collected in the latest national representative survey on food, nutrition and physical activity, which allow a generalisation of our findings to Portuguese adults and elderly. Contrastingly to household budget surveys, our dietary data were based on individual consumption, considering out of home consumption and food wastage at home, which enables a more accurate estimation. Additionally, food items in this study were classified using the NOVA system framework, globally known as a relevant tool to be applied in epidemiological studies and influence food policy makers, due its wider perspective of food and nutrition since it focuses on food processing(Reference Eaton73).
Conclusion
To our knowledge, this was the first study to evaluate ultra-processed food consumption in a national representative sample of the Portuguese population and its impact on diet quality. Ultra-processed foods contributed to, approximately, 24 and 16 % of the energy consumed by adults and elderly, respectively. Along with other populations, as the consumption of ultra-processed foods increased, all other NOVA food groups were displaced and NCD-related dietary nutrient profile was negatively impacted, especially in Portuguese adults. This scenario indicates the great demand for effective strategies to halt the consumption of ultra-processed foods since its dietary contribution is still modest among the Portuguese population. Likewise, it is necessary to preserve cooking habits based on unprocessed or minimally processed foods, as well as to increase promotion of health education and food literacy in this population. These measures, taken together, can ensure an improvement of diet quality and prevent diet-related NCD.
Acknowledgements
The authors thank all healthcare workers, researchers and individuals who participated in the UPPER project.
This article is a result of the project ‘Consumption of ultra-processed foods, nutrient profile and obesity in Portugal (UPPER)’, supported by Competitiveness and Internationalisation Operational Programme (POCI), under the PORTUGAL 2020 Partnership Agreement, through the European Regional Development Fund (ERDF) and through national funds by the FCT–Fundação para a Ciência e a Tecnologia. This work was also supported by the Fundação de Amparo à Pesquisa do Estado de São Paulo (FAPESP) (grant numbers 2018/07391-9, 2019/05972-7 and 2016/14302-7).
R. C. M., F. R., R. B. L. and S. R. designed the study; R. C. M. and M. M. M. performed data management and analyses; R. C. M., F. R., M. M. M., C. A., C. S., S. R. and R. B. L. interpreted the data; R. C. M. wrote the first draft of the manuscript; F. R., M. M. M., C. A., C. S., S. R. and R. B. L. revised each draft of the manuscript for important intellectual content. All authors read and approved the final manuscript.
The authors declare that there are no conflicts of interest.
Supplementary material
For supplementary material referred to in this article, please visit https://doi.org/10.1017/S000711452000344X