Extensive research has demonstrated that there is a significant correlation between nutrition and disease in rural and urban areas in China(Reference Wang, Mi and Shan1). Dietary intake has been associated with an increased risk of chronic diseases such as hypertension(Reference Wang, Hong and Wu2), CHD(Reference Satija, Bhupathiraju and Spiegelman3) and type 2 diabetes(Reference Kiefte-de Jong, Li and Chen4). There is growing evidence to suggest that a dietary tool does not fully provide valuable evidence about the relationship between foods, nutrient patterns and protection from disease(Reference Golley, Bell and Hendrie5).
There have been a number of nutrition surveys in China, but there have been few dietary surveys for the rural population. By the end of 2016, 42·65 % of the population of China lived in rural locations. To achieve the strategic goal of a healthy China by 2030, in-depth research of the health of the rural population is required. To our knowledge, no studies of the rural diet have been undertaken in China. Therefore, it is important to accurately measure the dietary intake of the rural population to identify diet-related behaviours in order to ensure their current and future health.
Dietary assessment tools such as questionnaires, 24 h recalls, diet histories or food records have been utilized previously(Reference Golley, Bell and Hendrie5). FFQ have been the most frequently used dietary assessment method in cohort studies and also in nutrition-related studies(Reference Hammond, Nelson and Chinn6,Reference Cade, Thompson and Burley7) . Regarding reference methods to validate FFQ, the most frequently used have been food records and 24 h diet recalls (24DR), although food records have been used less frequently because they are more demanding and their completion requires a high level of motivation.
The present study aimed to evaluate the validity and reproducibility of our quantitative thirteen-item FFQ regarding identification of dietary conditions in a rural population of China.
Participants and methods
Participants
The study participants originated from the Henan Rural Cohort Study, which has been described elsewhere(Reference Liu, Mao and Li8). Briefly, the Henan Rural Cohort Study is an ongoing prospective cohort study that enrolled 39 259 adults aged 18–79 years for baseline data. A detailed questionnaire to retrieve basic information such as general demographic characteristics, lifestyle, sleeping situation, personal and family history of diseases suffered, reproductive history (for women) and mental health was completed face-to-face with respondents. The recruitment for the reliability and validity evaluation studies described in the present paper was conducted from June to August 2017. A total of 295 individuals agreed to participate in the reliability study. Participants completed the first FFQ (FFQ1) at the beginning of the study with the second FFQ (FFQ2) conducted approximately 4 weeks later in the same participants. The response rate was 100 %. Most researchers believe that the time interval of repeat measurements should be 2–4 weeks, because the time interval should be neither too long nor too short but determined according to the specific research project to avoid any influence of memory of the first survey. For the validity study, a total of 121 people completed both FFQ1 and three 24DR. The three 24DR were completed within 2 weeks following FFQ1 and included two weekdays and one weekend day.
FFQ
The FFQ, based on the Dietary Guidelines for Chinese Residents and the eating habits of Henan people, consisted of questions about thirteen main food groups, including staple foods, livestock, poultry, fish, eggs, dairy, fruits, vegetables, beans, nuts, pickles, cereal and animal oil. For each food item, participants were asked to report the quantity and frequency of food they consumed over the previous year. The interviewee was required to state the quantity of food consumed (kilograms, grams) according to five frequencies of consumption (never, day, week, month, year). For each question, a card with samples of a standard portion of food relevant for typical diets was shown to the respondents. The data for each FFQ were obtained face-to-face by an experienced interviewer.
24 h Diet recalls
The repeated 24DR was utilized as the gold standard technique for validation of the FFQ. In the present study, the three consecutive 24DR included one weekend day and two weekdays. Information for the three 24DR was collected face-to-face on the first day and by telephone interview on subsequent occasions. Participants were asked to recall their consumption in the previous 24 h of all foods, such as staple foods, fruits and snacks. The previous 24 h period was defined as the twenty-four consecutive hours between bedtime on day 1 and bedtime on the following day.
Statistical analysis
Descriptive statistics are presented as number and percentage or as median and interquartile range for categorical and continuous variables, respectively. For the FFQ, the weekly food intake was calculated from the frequency of consumption of each food group. For the 24DR, weekly intake was calculated from the mean of the three 24DR multiplied by 7. A comparison of differences of intake between the two FFQ (FFQ1 v. FFQ2) and between the two methods (FFQ1 v. 24DR) was conducted using Wilcoxon’s signed-rank test, because the food group intake data were not normally distributed. The reproducibility of the two FFQ and the validity of the two methods were assessed by calculation of Spearman’s correlation coefficients (SCC) and intraclass correlation coefficients (ICC)(Reference Rosner and Willett9). We also calculated partial correlation coefficients (PCC) adjusting for culture, per capita monthly income and age, which were major social and demographic characteristics. A Bland–Altman analysis was also used to examine the agreement between the two FFQ and the two methods(Reference Bland and Altman10). The mean difference between the two FFQ was plotted v. the mean intake of food items from the two FFQ, and the mean difference between FFQ1 and the average of the three 24DR was plotted v. the mean intake of food items from the two methods. The 95 % limits of agreement were calculated as the mean difference ± 1·96 sd. All statistical analyses were performed using the statistical software package IBM SPSS Statistics version 21.0. In all analyses, the cut-off for statistical significance (two-tailed) was 0·05.
Results
Overall, 295 residents participated in the reproducibility study, while there were 123 in the validation study. Their main characteristics are presented in Table 1. There were no significant differences between the reproducibility and cohort studies in terms of age, gender and marital status. Participants in the cohort study had received better levels of education and income than those in the reproducibility study. The validation study participants were younger and better educated than the cohort population. There were no significant differences between validation and cohort studies in terms of gender and marital status.
Table 1 Comparison of the characteristics of participants in the reproducibility and validation studies with those of the Henan Rural Cohort Study population

† P value of the difference between the reproducibility study participants and the cohort population.
‡ P value of the differences between the validation study participants and the cohort population.
Reproducibility
Table 2 displays the median and mean consumption of different food groups from the two FFQ. There was no difference in the majority of food groups between the two FFQ (P > 0·05), except for the three food groups livestock (P = 0·001), eggs (P = 0·039) and nuts (P = 0·001). SCC between the two FFQ ranged from 0·06 (vegetables) to 0·58 (eggs) with a mean of 0·35. The mean ICC for food groups was 0·19, ranging from −0·001 for animal oil to 0·56 for eggs.
Table 2 Comparison of the median and mean food consumption values from the first (FFQ1) and second (FFQ2) administration of the FFQ, and the correlation coefficients between FFQ1 and FFQ2, among 295 adult residents from the Henan Rural Cohort Study, China, June–August 2017
P25, 25th percentile; P75, 75th percentile; SCC, Spearman’s correlation coefficient; ICC, intraclass correlation coefficient; PCC, partial correlation coefficient adjusting for culture and per capita monthly income.
*P < 0·05, **P < 0·01, ***P < 0·001.
† Units of consumption are grams per week except for eggs, which is number of eggs per week.
‡ Differences were tested by using Wilcoxon signed-rank tests.
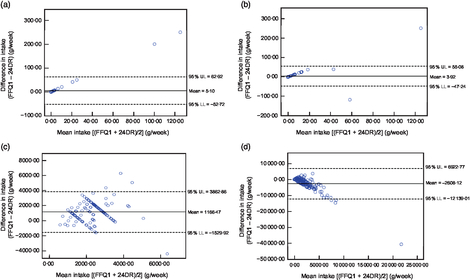
Figure 1 presents Bland–Altman plots of the data from the FFQ1 and FFQ2 for animal oil, pickles, vegetables and fruits. The narrowest limits of agreement were found for animal oil and pickles, and the widest for vegetables and fruits. For foods that fell outside the limits of agreement, the range was from 0·7 % (fish) to 5·8 % (nuts) for all the food groups examined.
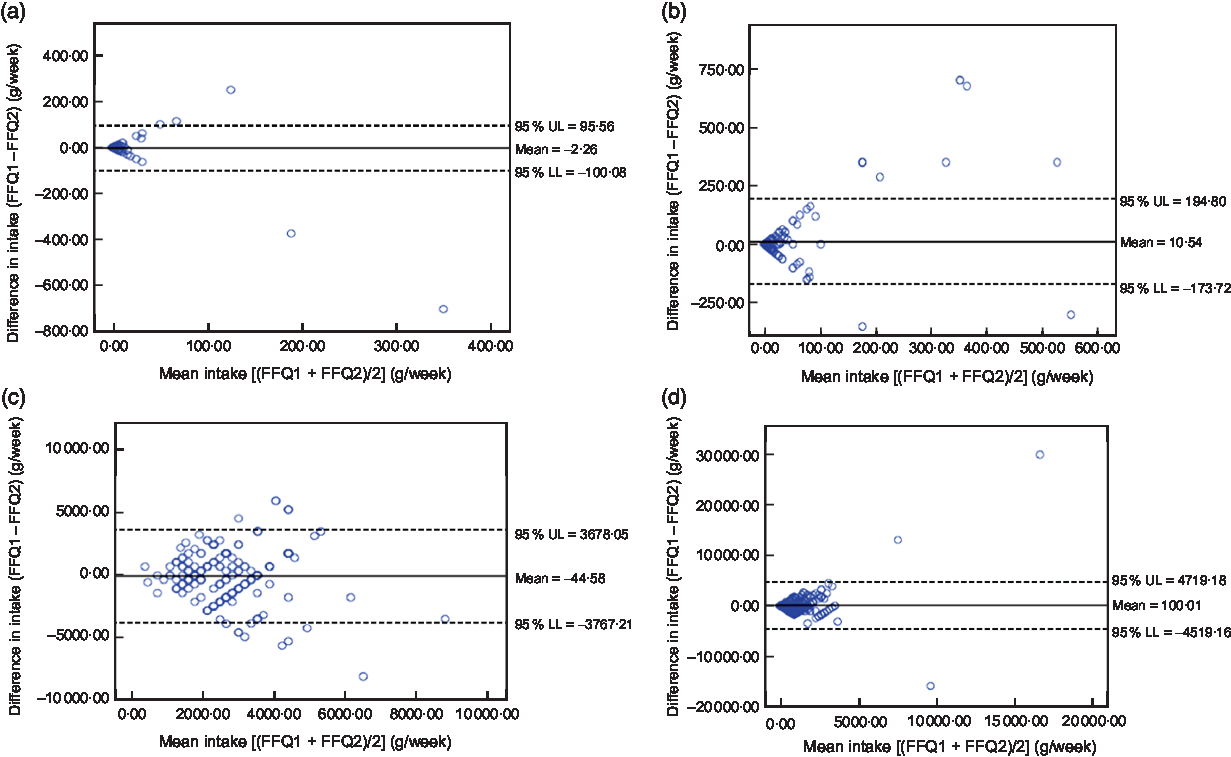
Fig. 1 Bland–Altman plots assessing the reproducibility of the thirteen-item FFQ among 295 adult residents from the Henan Rural Cohort Study, China, June–August 2017. The difference in intake between the first (FFQ1) and second (FFQ2) administration of the FFQ and is plotted v. the mean intake from the two administrations of the FFQ for: (a) animal oil, (b) pickles, (c) vegetables and (d) fruits. — represents the mean difference (bias) and - - - represent the limits of agreement (UL, upper limit; LL, lower limit)
Validity
Table 3 presents the median and mean consumption of food groups as collected in FFQ1 and the average of the three 24DR. There were some food groups with a higher consumption in FFQ1, including staple foods, livestock, poultry, fish, eggs, vegetables, beans, nuts and cereal. The SCC between the two methods ranged from 0·01 for cereal to 0·49 for staple foods. The mean ICC for food groups was 0·17, ranging from −0·05 (nuts) to 0·48 (staple foods).
Table 3 Comparison of the median and mean food consumption values from the first administration of the FFQ (FFQ1) and the average of the three 24 h diet recalls (24DR), and the correlation coefficients between FFQ1 and 24DR, among 123 adult residents from the Henan Rural Cohort Study, China, June–August 2017

P25, 25th percentile; P75, 75th percentile; SCC, Spearman’s correlation coefficient; ICC, intraclass correlation coefficient; PCC, partial correlation coefficient adjusting for culture, per capita monthly income and age.
*P < 0·05, **P < 0·01, ***P < 0·001.
† Units of consumption are grams per week except for eggs, which is number of eggs per week.
‡ Differences were tested by using Wilcoxon signed-rank tests.
Figure 2 shows the Bland–Altman plots for animal oil, pickles, vegetables and fruits between FFQ1 and the average of the three 24DR. The narrowest limits of agreement were found for animal oil and pickles, and the widest for vegetables and fruits. For foods that fell outside the limits of agreement, the range was from 0·8 % (fish) to 8·3 % (nuts) for all food groups examined.
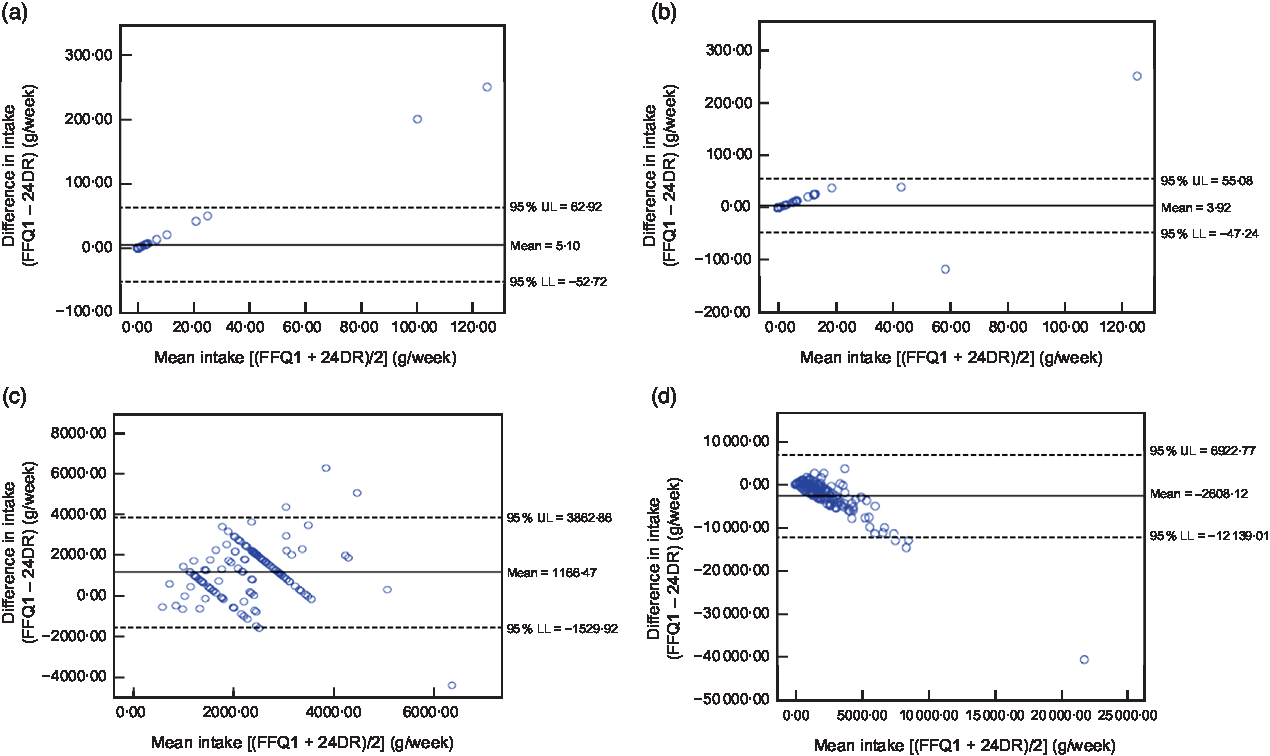
Fig. 2 Bland–Altman plots assessing the relative validity of the thirteen-item FFQ among 123 adult residents from the Henan Rural Cohort Study, China, June–August 2017. The difference in intake between the first administration of the FFQ (FFQ1) and the average of the three 24 h diet recalls (24DR) is plotted v. the mean intake from the two methods for: (a) animal oil, (b) pickles, (c) vegetables and (d) fruits. — represents the mean difference (bias) and - - - represent the limits of agreement (UL, upper limit; LL, lower limit)
Discussion
Participants in the cohort study had better education and income than those in the reproducibility study. In general, respondents had received less education than those in the recent national survey(11).
Validation participants were younger and better educated than the cohort population. Participants with high levels of education were selected to ensure successful completion of the 24DR. This demographic is similar to the Guangzhou cohort study in China(Reference Yuan, He and Chen12) and a study of a multi-ethnic Asian population(Reference Whitton, Ho and Tay13).
In the reproducibility study, the eggs food group had the highest SCC (r = 0·58), followed by dairy (r = 0·53), livestock (r = 0·49) and staple foods (r = 0·41), while vegetables had the lowest, similar to findings in an FFQ validation study among adults in Taizhou, China(Reference Zhuang, Yuan and Lin14). However, the ICC of the two FFQ (−0·001 to 0·56) in the present study were lower than those in a previous study that used a similar approach to ours (0·62 to 0·83)(Reference Saeedi, Skeaff and Wong15), in which just the frequency of each food group was selected. Compared with our findings, Li et al. reported a similar SCC for the following food groups: livestock (0·49 v. 0·40) and poultry (0·37 v. 0·37)(Reference Li, Halldorsson and Bjerregaard16). A comparison with studies conducted in Western countries(Reference Khani, Ye and Terry17–Reference Gwynn, Flood and D’Este20) demonstrated that they had higher SCC for reproducibility, which may be attributable to the differences in Western dietary culture compared with that of the Chinese. Westerners are used to eating from a dish, while the Chinese often share from a plate of food, so it is easier for Westerners to estimate their intake. For example, a Swedish study demonstrated that the SCC ranged from 0·44 for eggs to 0·82 for wine, with half of the values >0·55(Reference Khani, Ye and Terry17).
In the validity study, the staple foods group had the highest SCC (r = 0·49), followed by livestock (r = 0·41) and eggs (r = 0·30). These food groups are eaten daily or weekly in rural China, therefore they were well correlated. Food groups that are less frequently consumed in rural areas include fish, nuts, cereal and animal oil, so they had a lower correlation coefficient. It is not possible to obtain accurate diet data based on only one three-day dietary survey (three 24DR), especially for those food groups (e.g. dairy, poultry and fruits) that are eaten on special days such as the spring festival, the mid-autumn festival or days that families spend together. This is similar to the findings from a study in rural Bangladesh, where the ICC for the fruits and legumes groups were lower(Reference Lin, Bromage and Mostofa21).
The strength of the present study is that different groups of people were selected to evaluate the reliability and validity of the questionnaire. Although a number of previous studies have evaluated the reproducibility and validity in the same population, this approach reduced the participation of the study population while maintaining the accuracy of the data. Our survey increased the work required of each individual, but we obtained more detailed information. An additional advantage was that our study assessed the reproducibility and validity of a quantitative thirteen-item FFQ. Many previous studies have evaluated qualitative FFQ. In addition, there are only two published articles, to our knowledge, about surveys of dietary questionnaires in rural of China and they focused on pregnant women(Reference Li, Halldorsson and Bjerregaard16,Reference Cheng, Yan and Dibley22) . It is necessary to evaluate the validity of any FFQ applied to a rural population.
Although our data are based on an appropriate sample size for assessing the reliability of the FFQ, several limitations should be recognized about our study. First, there was only one three-day dietary survey (three 24DR) to validate the dietary intake of the FFQ during one year. There may be seasonal bias because we collected dietary data for only one season. However, as quality of life improves in rural habitations, an increasing number of supermarkets reduces the seasonal variations in food. Second, we did not collect data about the intake of salt, oil or spices, so we were unable to evaluate the validity of nutrient intake. Third, the 24DR were susceptible to measurement error bias due to the shortcomings of memory. We still used this as the reference method, for consistency with the many previous studies that used this method to evaluate the validity of FFQ. Finally, the characteristics of the participants in the present study may have affected the validity of the study. It may be difficult for an individual with little formal education to accurately assess the intake of each food group.
In conclusion, we have demonstrated that the FFQ designed for the present study provided acceptable reproducibility and validity. Therefore, this FFQ can be used as a representative tool for the assessment of diet in a rural population. Future research should fine tune the proposed FFQ to improve its validity for certain food intakes.
Acknowledgements
Acknowledgements: The authors are grateful to the villagers who took part in this study, the research team and the hospital staff for their cooperation and assistance. Financial support: This research was supported by the National Key Research and Development Program Precision Medicine Initiative of China (grant number 2016YFC0900803), National Natural Science Foundation of China (grant numbers 81872626 and 81573151), Henan Natural Science Foundation of China (grant number 182300410293), Science and Technology Foundation for Innovation Talent of Henan Province (grant number 154200510010). The funders had no role in the study design, data collection and analysis, interpretation, decision to publish, or preparation of the manuscript. Conflict of interest: The authors declare no conflicts of interest. Authorship: W.-J.L. and C.-J.W. conceived and designed the study. B.-Y.W., C.L., Z.-X.M., S.-C.Y. and X.L. performed the investigation. Y.X., Y. W. and H.-L.S. analysed the data. Y.X. wrote the manuscript. All authors read and approved the final manuscript. Ethics of human subject participation: This study was conducted according to the guidelines laid down in the Declaration of Helsinki and all procedures involving human subjects were approved by the Ethics Committee of Zhengzhou University. Written informed consent was obtained from all subjects.